TRADE POTENTIAL IN AN ENLARGED EUROPEAN UNION: A RECENT APPROACH1
Maria Paula Fontoura*, Enrique Martínez-Galán**, and Isabel Proença***
* ISEG, Technical University of Lisbon ** Portuguese Ministry of Finance *** ISEG, Technical University of Lisbon
Abstract
This paper aims to evaluate the trade potential of manufactured products between countries belonging to the EU in the threshold of its Eastern enlargement. For this purpose we use a Gravity model which is estimated with a Poisson Pseudo-Maximum Likelihood Method. We extend the specification of the gravity model in order to capture bilateral trade specificities between groups of countries of the enlarged EU, allowing to test the statistical significance of these inter-groups’ trade potential. In addition, it includes the Commodity Composition of Trade. The estimated coefficients are used to project exports of each country. We conclude that in 2002 the CEEC as a group had exhausted their export potentialities to the enlarged EU, whereas the same does not apply to its imports from the EU members.
JEL Codes: F14, F15 and F17.
Keywords: European Union, CEEC, Gravity Model, Commodity Composition of Trade Poisson Pseudo-Maximum Likelihood Estimator, Trade Potential.
Corresponding author:
Maria Paula Fontoura, Department of Economics, ISEG. Room 416, Rua Miguel Lupi, n. 20. 1249-078 Lisbon, Portugal. Telephone: + 351 21 3952800 - Fax: + 351 21 3925850
Email: [email protected]
1
The authors are indebted to J.M.C. Santos Silva for his helpful comments. Useful comments received at the 4th annual European Economic and Financial Society conference and the 7th annual European Trade Study Group conference are equally welcomed. We gratefully appreciate the financial support received from
Fundação para a Ciência e a Tecnologia, under the FCT/POCTI, partially funded by FEDER, and the Fundo
1. Introduction
On May 2004 the European Union (EU) registered its 5th Enlargement, mainly by incorporating eight Central and Eastern European Countries. This paper aims at evaluating the trade potential of manufactured products between the EU25 countries in the threshold of its Eastern enlargement, more precisely in 2002. When referring to the EU25 we include the current EU member States excluding Cyprus and Malta, due to their small size and specific characteristics, but we added Romania and Bulgaria, as Accession Countries that will become members in a near future.
The process of enlargement of the EU was prepared by the Europe Agreements - a total of ten agreements signed between the EU and the Central and Eastern European Countries (CEEC) in the period 1991-1996- which led to a free trade area in 1 January 2002 in the manufacturing industry of the EU25 and laid the foundations of the accession process by implying full convergence of the domestic system of the CEEC that will adhere in 2004 to the EU acquis communautaire (i.e. the comprehensive body of laws, rules and regulations that govern the EU). Both changes were expected to have already produced relevant adjustments in trade between the CEEC and the EU members by the year 2002. Most previous studies on the subject that also aim to calculate trade potential involving CEEC do not present individual bilateral trade estimates for all EU and CEE countries2, in addition to the fact that most of them focus periods prior to full liberalization3. By choosing the year 2002 it will be possible to verify whether trade between the previous EU members and the CEEC deviates significantly from what normal (nonpreferential) trade relations would predict.
2
Exceptions are Baldwin (1994), Nilsson (2000) and Caetano and Galego (2005).
3
In this study, three groups of countries will be considered: the CEEC, the Cohesion Countries (CC) and the remaining countries belonging to the EU25 (EU11). The consideration of the CC as a separate group from the remaining eleven previous EU members is based on the specificities of the former that allow to assume that these two groups may have reacted differently to the eastern enlargement.
For the purpose of our study we follow the well-diffused method of estimating a gravity model and using the parameters to project the trade relations amongst the EU25 countries. The estimated model includes the 25 countries under consideration (in-sample approach), an option also followed by an increasing number of authors that also aimed to assess trade potential of the CEEC and EU members as the period of their analysis approached the full adoption by CEEC of the EU trade rules - and, therefore, the total sample became a highly homogeneous group of countries in terms of both economic regime and trade integration4 .
With regard to similar previous studies, we consider a Poisson Pseudo-Maximum Likelihood (PML) estimator as proposed by Santos Silva and Tenreyro (2006). While the application of gravity models to calculate trade potentials has been in most cases based on a cross-section analysis5, more recently some authors recommended the use of panel econometric methods to control heterogeneity6. However all of these studies made use of log-linear models, an option that these authors have shown no not to be adequate to consistently estimate the parameters of the gravity model in the presence of heteroscedasticity and in no case should be used to project trade. Following Santos Silva and Tenreyro (2006), we opt for a cross-section model.
4
This was also the option of, for instance, Baldwin (1994), Nilsson (2000) Caetano and Galego (2005). Other authors have opted for excluding the CEEC from the regression analysis, such as Wang and Winters (1991), Hamilton and Winters (1992) and Brülhart and Kelly (1999).
5
See, for instance, Wang and Winters (1991), Hamilton and Winters (1992) Brülhart and Kelly (1999) and Nilsson (2000).
6
See, for instance, Baldwin (1994), Gros and Gonciarz (1996), Mátyás (1997), Egger (2000), Egger (2003), Egger and Pfaffermayr (2003), De Benedictis and Vicarelli (2004) and Cheng and Wall (2004).
In addition, the specification we use for the gravity model allows to directly assess the trade potential between the three groups of countries that we considered. The advantage of this procedure is threefold. First, it allows testing the statistical significance of the estimated trade potential. Second, it controls heterogeneity at the country group’s level. Thirdly, it avoids Egger (2002)’s criticism to calculating trade potential of inter-groups of countries with an in-sample approach.
The trade potential of each of the EU25 countries to each group of countries will be evaluated following the usual procedure, i.e. by focusing our attention on the ratio between potential (“normal”) and verified trade relations, considering that potential trade is equal to fitted trade (trade projected by using the coefficients of the estimated gravity model). As the last incorporates the specific inter-group trade relations, evaluation of each country’s trade potential will thus be corrected by the trade relations’ specificities of the group to which the bilateral relation belongs. Nonetheless, for sake of comparison we will also present the trade potential’s results that would be obtained without this correction.
Trade potential calculations will also take into account the degree of commodity correspondence between the exports of a country and the imports of its trade partner, the so-called Commodity Composition of Trade (CCT). The CCT measure will be considered both as a rough measure of trade potential in bilateral trade and as an explanatory variable in the gravity model.
The remaining of the paper will be organized as it follows. In section 1, we will focus on a descriptive approach to the recent evolution of the verified manufacturing trade flows within the EU25 countries. In section 2, we measure the complementarity between the export and import vectors of pairs of EU25 trade partners. In section 3, we estimate two gravity models, one making use of the Poisson Pseudo-Maximum Likelihood estimator and the other with recourse to the classic OLS estimator, with their results being compared. In
section 4, we calculate the trade potential flows for each one of the EU25 countries with each of the three groups of countries that we consider. Section 5 concludes.
1. A Descriptive Approach to Evolving Trade flows
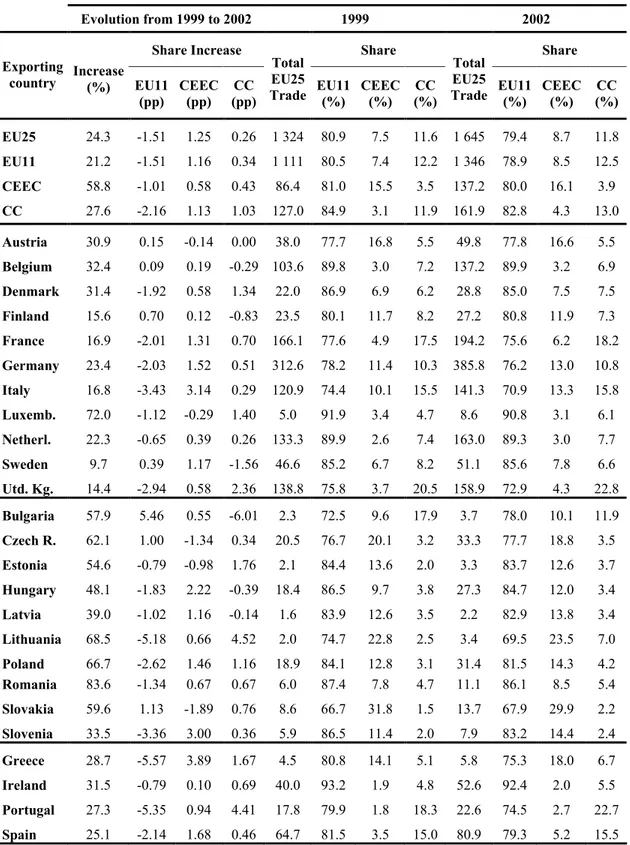
In order to have an overall picture of the trading relationships of manufacturing products in the EU25 space in the threshold of the EU enlargement, we will focus our attention on the verified trade flows in the period from 1999 to 2002, presented in Table 1. This period was chosen on account of data restrictions7.
Table 1
Taking into consideration the EU25 pattern of geographical exports, 79.4% of the EU25 exports had as its destination one of the EU11 countries in 2002. Note that this value decreased from 80.9% in 1999. The analogous figure for the CC did not display a relevant change, as it barely increased from 11.6% in 1999 to 11.8% in 2002 whereas the corresponding CEEC’s weight increased from 7.5% in 1999 to 8.7% in 2002, absorbing all the EU11 countries relative decrease.
In what concerns the evolution of exports to the EU25, in the CEEC’s case they increased on average by 58.8%, with ten out of the eleven higher increases in the EU25 occurring in this group. As regards the EU11, exports to the EU25 barely increased by 21.2% on average, and it is noteworthy that the seven lower increases in the EU25 occurred in this group (namely Sweden, United Kingdom, Finland, Italy, France, the Netherlands and Germany). The CC as a group registered an increase slightly greater than the EU11 (27.6%).
7
The European Commission (Eurostat-Comext database) only started to publish homogeneous trade data for Bulgaria and Romania in 1999.
A notable observation is therefore that in the period analyzed the CEEC was the group that most remarkably increased its importance in the EU25 space not only as importer but also as exporter. Additionally, this increase was higher as regards the CEEC’s exports than relatively to the CEEC’s imports, as could be expected considering that the process of liberalization favored the CEEC8.
We now turn our attention to the trading relations amongst the three groups of countries. Focusing on the EU11, it can be observed that 78.9% of the export flows originated in this group had the EU11 countries themselves as their destination in 2002. The remaining EU11 export flows were divided between the CC (12.5%) and the CEEC (8.5%). Even if these weights are rather similar to those displayed in 1999, the CEEC’s quota increased, as expected, by 1.1 p.p. Some specific evidence deserves to be highlighted on the previous global picture: exports of Luxembourg, Belgium and the Netherlands were highly concentrated in the EU11 (higher than 89%), whereas Austria, Italy, Germany and Finland were the countries with relatively higher shares of their exports oriented to the CEEC (higher than 10%).
In what concerns the CC, it can be observed that 82.8% of the export flows originated in this group had as their destination the EU11 in 2002. The remaining export flows were divided between the CEEC (4.3%) and the CC themselves (13%). The evolution between 1999 and 2002 shows a decrease of 2.16 p.p. in the EU11’s quota, distributed rather similarly by the two other groups. It is worthwhile highlighting that whereas the Irish exports displayed the EU25-highest concentration in the EU11 countries (92.4%), the Greek export flows were relatively highly concentrated in the CEEC (18%), as a consequence of the Bulgarian preponderance as a trade partner.
8
The CEEC had to liberalise market access for manufactured goods over a (maximum) period of ten years, while in the case of the EU it was only five years.
Finally, taking into consideration the CEEC, it can be observed that 80% of their exports had the EU11 countries as their destination in 2002. The remaining export flows were divided between the CC (3.9%) and the CEEC themselves (16.1%). These values are rather similar to those displayed in 1999 although a slight decrease of the EU11 weight needs to be mentioned. With regard to the exports to the CC, they are still small in relative terms (3.9%), although showing an increasing trend in the period analyzed. Taking each CEEC separately, Romania shows a high concentration of its exports in the EU11 (86%), whereas Slovakia and Lithuania present the relatively highest concentration in the CEEC (higher than 23%). Other countries of this group registered a considerable group reorientation of their trade in the period analyzed. This was the case of the Lithuanian exports’ shift from the EU11 to the CC, whereas Slovenia reoriented a significant part of its exports from the EU11 to the CEEC.
2. Commodity Composition of Trade
A tool that has been adopted for the characterization of potential trade flows is the analysis of the degree of commodity correspondence between the exports of a country and the imports of its trading partner9. This approach leads us to the concept of Commodity Composition of Trade, which is determined by means of a trade complementary measure between the export structure of the supplying country and the import structure of the demanding country.
The average of a country’s CCT values is assumed to provide some information about its export potential, since an exporting country with a supply vector that comprehensively fits the import needs of its counterparts is likely to have better export prospects than an exporter with a poorly matching export structure. This is especially true
9
in the case of large importers and has been theoretically grounded10 on the demand-related factors suggested by Linder’s theory that envisages international trade as an extension across national frontiers of a country’s own web of economic activity (see Linder, 1961, pp. 88). Since exports are viewed as an extension of the domestic market in Linder’s analysis, it follows that trade flows will be more intensive between countries with similar demand patterns.
We considered the two trade indexes that have alternatively been used as methods of measuring the CCT, namely the Cosine Measure (COS) (1), introduced by Linnemann (1966), and the Export-Import Similarity Index (EIS) (2), set up by Finger and Kreinin (1979), and later upgraded by Linnemann and Beers (1988). Both are a relative index and thus immune to the absolute magnitudes of values. Their formulae are as follows.
∑ ∑
∑
= k k jk ik k jk ik ij m x m xCOS
2 2 . . (1)∑
∑
∑
= k k jk jk k ik ik ij m m x xEIS
min , (2)wherexik equals multilateral exports of commodity k by country i to the rest of the world and m equals multilateral imports of commodity k by country j from the rest of the jk world. Note that both the export vector of the country i (x ) and the import vector of the ik country j (m ) are composed by n elements (k = (1, … , n)), where n is the total number jk of commodities. An index value of one would indicate perfect overlap of the exporting structure of a country with the importing structure of its trade partner, while a value of zero would indicate a complete difference. Data is disaggregated at the 6-digit level of the Comext´s Combined Nomenclature.
Despite the fact that both variables are strongly correlated11 and although, to some extent, they display similar results, we opt for the COS-measure. This choice was based on
10
See, for instance, Kösekahyaoğlu (1994).
11
its relatively wider variance12, which is an advantage considering that this variable will be used as regressor in the econometric model.
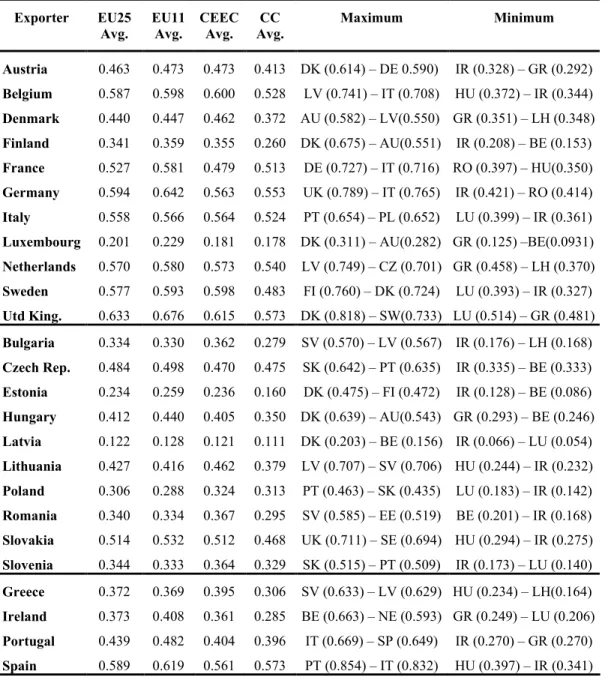
Table 2 presents the obtained results as follows: for each country, it shows (i) the average COS with the EU25 and each country group (EU11,CEEC and CC) and (ii) the partner countries with the maximum and the minimum COS in intra-EU25 trade (and their respective values).
Table 2
As expected, the biggest five economies of the EU25, namely Germany, France, United Kingdom, Spain and Italy, jointly with Belgium, the Netherlands and Sweden, emerge as the most prepared to face the EU25 market as a whole, in terms of trade specialization, as they present a relatively high average COS-value (higher than 0.53) in 2002. The cases of the Lithuania, Czech Republic, Hungary and Slovakia as exporters, all of them displaying an value over 0.40, must also be highlighted; their average COS-measure shows that these four CEEC have better export possibilities than Finland, Luxembourg, Greece or Ireland. On the other hand, Bulgaria, Romania, Latvia, Estonia, Poland and Slovenia appear to have a relatively inadequate trade specialization to tackle the challenge of the EU25 market. Furthermore, the CC patterns of specialization also appear to be worse than the average of the EU25, with the exception of Spain.
Some obvious limits may be, nonetheless, pointed out to considering the CCT as an indicator of trade potential. First, it is basically a static characteristic. Second, countries with large and diversified export bases tend to exhibit a high degree of complementarity between their exports and the imports of their trade counterparts when compared with
12
COSij and COSji variances represent 0.0178 and 0.0033, respectively, whereas EISij and EISji variances represent
diversified economies. The Irish case confirms the latter; despite the well-known success of Ireland as an exporting economy in the recent years, it displays low values in terms of its COS-measure. This outcome is a result of the high concentration of its export structure in a low number of products13, which implies that exports cannot extensively match dispersed import structures of trade. Third, a high CCT in bilateral trade does not necessarily imply that imports demand will be supplied by the exports of that specific trade partner.
In what follows, we focus on the evaluation of the trade potential by making use of the gravity approach, as previously mentioned. Nonetheless, the CCT will be taken into consideration as an additional explanatory variable of actual bilateral trade in such modeling and expected to be positively related to bilateral trade. This same option was also taken in a few gravity model studies, namely Linnemann and Beers (1988), Beers and Linnemann (1992), Arnon et al. (1996), Beers and Biessen (1996), and Lamotte (2002), although only Lamotte (2002) aimed at evaluating the trade potential by making use of the gravity models’ coefficients.
3. The Gravity Model
The gravity model, which received a big revival in the 1990s partly as a consequence of its use to project bilateral trade relations14, explains the geographical distribution of the (bilateral) trade flows of a given country (or region) with different partners. Inspired in the gravity law from Physics, it is based on the assumption that bilateral trade volumes between two countries (either the export or the import flow) depend positively on their market size (economic mass), generally measured by GDP and
13
The “Machinery and Mechanical Appliances”, “Organic Chemicals” and “Electrical Machinery and Electrical Equipment” 2-digit Comext sectors represented around 61% of the Irish total manufacturing exports in 2002.
14
See, for instance, among the pioneers, Wang and Winters (1991), Hamilton and Winters (1992) and Baldwin (1994).
population, and negatively on the geographical distance between their “economic centers of gravity”. This basic model has been augmented with several trade-impediment and preference factors of bilateral trade relations, such as a common border, a common language, preferential trade relations, monetary variables to capture the role of exchange rate variability and of sharing a common currency15, as well as a location index to take the remoteness of a country into consideration. Most of these effects are now common additions in recent gravity models (the so-called augmented model16) and will be also considered in the specification that we use.
Our model considers bilateral manufacturing trade between the EU25 countries in 2002. Data consists of a cross-section series of 600 bilateral trading pairs of countries. None of the observations represent problematic zero-trade flows.
In subsection 3.1, the gravity model specification will be introduced together with the description of the variables. The standard OLS and PML alternative estimation procedures will be discussed and compared in subsection 3.2. Results will be presented and discussed in subsection 3.3.
3.1 Model Specification and Explanatory Variables
We will consider as the dependent variable of our model either the export or the import flows, and accordingly, we will identify the variables corresponding to each equation by X and M, respectively17. Note that some authors have estimated the gravity equation using only import data on the assumption that countries tend to monitor their imports more carefully than their exports18 .
15
Rose (2000) estimated that countries with a common currency trade more than three times with each other than with countries with different currencies but some criticism has involved this result, which has been considered overestimated (see, for instance, Yeyati, 2001).
16
See for instance, Kandogan (2004) for a presentation of the “augmented” version.
17
Among others, Dhar and Panagariya (1999) argued that total trade should not be the dependent variable, because it imposes equality of coefficients for imports and exports, a criticism that is widely accepted.
18
The usual specification of the gravity equation for the volume of trade (either exports or imports) between countries i and j is given by the equation,
ij ij ij
ij x u
T =exp(β0 +α ) β (1)
where x is a vector with the gravity variables that explain the trade flows, ij β a vector of unknown coefficients, αij is the term capturing unobserved heterogeneity of the bilateral trade flow assuming fixed effects and u is an error term which verifiesij E
[
uij |xij]
=1, such that[
]
β α β ij ij ij ij x x T E | =exp( 0 + ) (2)Given the use of a cross section data, we have to impose some restrictions on the behavior of the heterogeneity term. We consider heterogeneity only at the country group-pair level19, distinguishing nine heterogeneous behaviors resulting from combining bilateral trade relations between the three groups under consideration (CC, CEEC and EU11) and between countries of the group itself. Assuming a fixed-effects specification, heterogeneity can be estimated by including nine dummy variables (with a dummy for each group-pair), leading to
[
]
β δ β ij k ij k ij ij x Dk x T E | exp( ) 8 1 0∑
= + = (3)with Dkij =1 if the country-pair ij belongs to the k-th group-pair (k=1,…,8).
These nine group dummies that aim to pick up special links between heterogeneity caused by the special links between the pairs of country groups will be designated as follows: CEECX-CEECM; CEECX-CCM; CEECX-EU11M; CCX-CEECM; CCX-CCM; CCX-EU11M; EU11X-CEECM; EU11X-CCM and EU11X–EU11M, where the first refers to the group of the exporting country and the second to the group of the importing country
19
(for instance, CEECX-CEECM means that a country belonging to the CEEC group is exporting to another country of this group). To avoid the dummy trap we leave out the last dummy.
Some additional considerations have to be taken concerning these group-pair specific dummies. Their estimated coefficients also yield direct information about the bilateral trade potential between the group-pairs of countries, with the advantage that its statistical significance can be tested. For example, a positive coefficient in a dummy shows that bilateral trade between the two groups of countries is higher than the average behavior of the countries with the same characteristics in the omitted pairs of groups, implying that these two groups have exhausted their current trade capacities. On the other hand, if the coefficient is negative, trade is lower than that average, meaning that there is a positive trade potential between these two groups.
Note, in addition, that the in-sample approach adopted in previous papers to calculate trade potential between different groups of countries was based on the analysis of the residuals of gravity models. However, Egger (2002) claimed that this is an incorrect procedure as large systematic residuals should be interpreted as a sign of misspecification and not necessarily of trade potential. By capturing the effect directly within the model, through the inclusion of these dummies, we overcome Egger’s criticism.
On what concerns the independent variables included inx , the GDP (MGDP, ij XGDP) of both countries involved in the bilateral trade flows and their population (MPOP, XPOP) are used as proxies to the “economic mass” variables. The intensity of bilateral trade variables is also captured by an absolute and a relative distance variables between both countries (DIST, RDIST), their respective COS-measure (COS) and the magnitude of the reciprocal flow to the one that it is being considered in the respective regression as the dependant variable lagged one year (RECI (-1)). In addition, we added dummy variables to
capture both countries sharing adjacency (NEIGH), the same language (IDIOM), the case in which the nationals of a given country represent a significant share of population in its counterpart (ETHN), having the euro as their common currency (EURO), landlockedness for either the importing or the exporting country (MLOCK, XLOCK) and a possible specific German bias (GERMAN)20.
The GDP variable is calculated at market exchange prices (MES), following the argument of authors such as Gros and Gonciarz (1996) or Frankel (1997) according to which the proper measure of a country trade potential should be based on the international value of goods and services and not on how well off its inhabitants are, as would be the case if GDP were calculated in terms of purchasing power parities (PPP)21.
The absolute distance variable is included as a measure of the several costs that may be associated with distance and it is assumed to be negatively related to trade flows. The most popular absolute distance variable is the distance between capitals, which is assumed to be a proxy for the “economic centre” of a country. It is widely recognized that the measurement of distances between capitals may not be the most appropriate choice (for instance, when capitals are very close, like in the case involving Austria and Slovakia). However, Boisso and Ferrantino (1997) found very little difference between the gravity equation using either the distance between the most populous cities or the geographical centers. In our case, we opted to proxy the absolute distance by the geodesic distance between capitals22, measured as the surface distance between two points of latitude and longitude (great circle distance23). The main problem with this measure of absolute distance is the fact that it does not take into account a whole series of trade impediments
20 This is a common variable in studies that include CEEC. See for instance Beers and Biessen (1996).
21
Nonetheless, Baldwin (1994), Bayoumi and Eichengreen (1995), Beers and Biessen (1996), Boisso and Ferrantino (1997) and Paas (2002), among others, make use of income at PPP.
22
Some authors, such as Christie (2002), substitute the capital by a major city that seems to be closer to the country’s economic centre of gravity. At this respect, we opted by considering Amsterdam instead of Den Haag as the Dutch capital.
23
Also known as “as the crow flies”, which is technically defined as the great-circle distance between the two latitude-longitude combinations.
that surely matter, such as real transport costs, complex orography, waiting times at borders24, transport infrastructure quality25 or differences between maritime, road or train costs, which could not be included for lack of data.
Since Polak (1996), it has also been nonetheless considered that not only the absolute distance between two economies but also their geographical location as regards the trade-economic centre influences bilateral trade volumes. The hypothesis is that two countries located far away from this centre tend to rely to a larger extent on trade with each other. Omitting countries’ relative location may thus lead to an underestimate of trade flows that take place between countries geographically isolated from the trade-economic centre and an overestimate in the case of centrally located countries. Accordingly, Polak proposed the inclusion of a measure of this relative location, in addition to the absolute distance variable between a country and its counterparts.
To define the relative distance, we follow Javorcik (2001)’s methodology26 by measuring the geodesic distance between the midpoint of each trading-country pair and a previously defined trade-economic center. In the case of this paper, the latter is given by the European Trade Centre in 200127, calculated to be located on the Ostbayern (Bavarian Forest, Germany), quite near to the Czech and the Austrian borders.
The effect that the location of a pair of countries relative to the trade-economic center, as measured by Javorcik (2001), has on their goods exchange is nonetheless ambiguous, as focused by this author (ob. cit., pp. 6-7). On one hand, the share of their bilateral trade in their total trade may increase the further away they are from this center, as
24
Christie (2002), attempted to take account of border waiting times by making use of a transport time matrix between the main transport nodes of the CEEC but he concluded that that this specific variable does not clearly outperform the traditional distance measure.
25
See Martínez-Zarzoso and Nowak-Lehmann (2001) for an inclusion of infrastructure facilities endowment (namely in terms of road, train, maritime and air infrastructures) in a gravity model.
26
Polak (1996) used a location index equal to the sum of all bilateral distances weighted by partners’ GDPs.
27
Other authors such as Schumacher (2001, pp. 28) presented different formulas for calculating geodesic distances by making use of latitude and longitude coordinates.
suggested by Polak (1996); on the other hand, countries at the periphery may trade less in absolute terms than economies of the same size located closer to the trade-center28.
The RECI(-1) variable deserves a detailed explanation. It points to the possibility of one-way trade flow being influenced by its inverse flow (lagged one year), due to market familiarity-related links that may reduce the trading costs between two countries and, subsequently, benefit each other. The reciprocal flow as an explanatory variable may be endogenous given that imports and exports depend closely on the same variables. However, using the lagged value will minor this problem given that the model refers to cross-sectional data. Additionally, RECI(-1) is a proxy for omitted variables in order to improve the fit to project the trade flow.
All the above variables are expected to promote bilateral trade flows with the exception of DIST, XPOP, MLOCK and XLOCK, which are expected to be negatively correlated with trade, and RDIST, whose sign is theoretically ambiguous for the reasons that have been explained.
The Appendix presents a detailed description of all the variables introduced in the gravity model, including their statistical sources.
3.2 Estimation Procedures
We are interested in estimating the unknown coefficients of equation (1) and, subsequently, in obtaining the fitted trade necessary to estimate the trade potential,E
[
Tij |xij]
. The usual procedure consists of applying OLS to the regression model,28
In order to solve this indeterminacy, Javorcik (2001) proposes a gravity model based on bilateral trade shares rather than on absolute bilateral flows.
ij ij k ij k ij Dk x u T log log log 8 1 0 + + ′ + =
∑
= β δ β , (4)However, Santos Silva and Tenreyro (2006) pointed out that this procedure is not totally adequate as it leads to several econometric inaccuracies. First, notice that, even if
[
loguij |xij]
=0,E by means of (4) we are able to estimateexp
(
E[
logTij |xij]
)
which, in general, is not the same asE[
Tij |xij]
. This observation has been referred in the literature as the Jensen’s inequality. Consequently, trade potential based on OLS predictions of trade is inaccurate29.In order to obtain a more accurate estimate of the desired expectation, Wooldridge (2003) advises the correction of the OLS fit of exp
(
E[
logTij |xij]
)
by using a scale factor that can be easily deduced when u is conditionally distributed as lognormal with constant ij variance. For other distributions, the author proposes a simple OLS regression to approximate this factor. Moreover, this procedure is only effective if the coefficients are consistently estimated. This is not the case when u is heteroskedastic, with variance ij depending on the regressors, as most likely E[
loguij |xij]
≠0 and will depend also on the regressors. For instance, if u ij is log-normal with variance σij2 then[
log |]
(1/2)log(1 2)ij ij
ij x u
E =− +σ . Simulations performed by Santos Silva and Tenreyro (2006) show a severe bias of the usual OLS estimator when that type of heteroskedasticity is present. Unfortunately, this is very likely to happen in practice.
The alternative procedure that avoids the above mentioned problems, which was proposed by Santos Silva and Tenreyro (2006), consistently estimates (1) directly with the PML estimator using the robust Eicker-White estimator for the covariance matrix. This is
29
the approach we follow in this paper though, for sake of comparison, we also use OLS to estimate equation (4).
3.3 Econometric Results
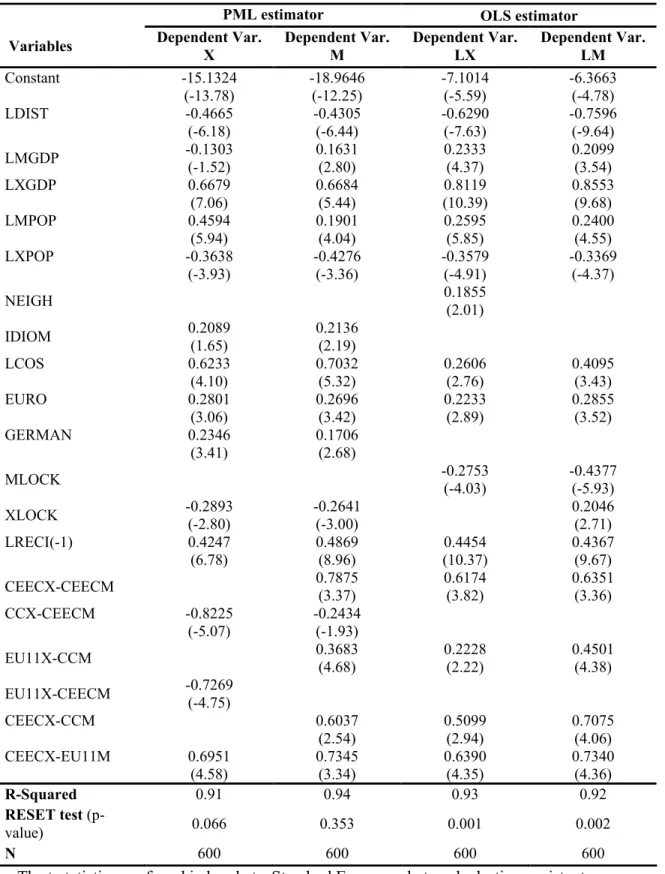
Table 3 reports the results obtained from making use both of the PML and the OLS estimators. TSP 4.5 was used for all the calculations. In the tables, the prefix L applied to the name of a variable refers to its natural logarithm. We estimated a general model including all the variables described in the previous section although, for sake of simplicity, Table 3 presents a restricted version of the model which only includes the variables that proved to be significant.
Table 3
As regards the PML results in Table 3, the RESET test detects no evidence of misspecification of the functional form of the model at the 5% level and the R-squared is slightly above 0.90. The estimates show that (both) foreign trade flows involving the EU25 members during the 2002 period were, on one hand, positively influenced by the exporter and importer’s GDP (except in that case in which we have exports as the dependent variable, where the latter is not statistically significant), importer’s population, language sharing, the commodity composition of trade, euro sharing, German bias and the lagged reciprocal flow. On the other hand, the above mentioned flows were negatively influenced by the absolute distance, the exporting country’s population and the exporter’s landlockedness.
Particularly relevant for the purpose of this paper are the results of the dummies for the group-specific bilateral relations, as they yield direct information on the trade potential
between the three groups of countries that we have considered. Having into consideration results in both the export and the import equation, we conclude that, in 2002, CEEC exports tend to be higher for all destinations (CC, EU11 and countries belonging to the CEEC itself) than the average of countries with similar characteristics. The same occurs with EU11 exports to the CC. On the contrary, CC and EU11 exports to the CEEC are smaller than that average. Consequently, CEEC exports do not indicate the existence of space to increase in a near period whereas it does appear that these countries have potential to absorb increasing imports from the remaining EU25 countries.
The inclusion of RECI(-1) affects the magnitude of the coefficients of the exporting and importing countries, being their value higher when this variable is not included in the regressors. We also observe that the magnitude of the elasticities of XGDP and MGDP depicts a tendency of trade to rise less than proportionately with economic size, a result also found in similar studies.
The relative distance variable is statistically non-significant. It is not therefore confirmed that two countries located away from the trade-center tend to rely more on trade with each other than a pair of countries located close to this center. This result may derive from the narrow geographical scope of our study, which reduces the possible effect of relative location on trade.
In addition, comparing the results in the equation for the export flows with those for the import flows, one verifies that they are not totally coincident. This is may be due to already referred possible inaccuracy in export data, but also to the fact that exports and imports are computed differently and the difference between cif (for imports) and fob (for exports) may vary according to each specific flow.
Turning our attention to the alternative OLS results shown in Table 3, the most striking feature is that the RESET test shows evidence of misspecification of the regression
model, implying that the OLS estimates are less reliable than the PML’s. This was the expected outcome given the econometric implications of the Jensen’s inequality, referred to in Section 3.2. Moreover, applying the test of Park to assess the validity of the log-linear OLS model, as suggested by Santos Silva and Tenreyro (2006), we obtain statistics with p-values equal to 0.00, with either imports or exports as the dependant variable, showing evidence of lack of consistency of the OLS estimator.
All OLS estimates are comparable to those resulting from the PML except for the intercept, given the need to scale the dependent variable when performing the PML estimation. As expected there are differences between both results that are worth pointing out. For instance, the significance of some variables according to the OLS estimator is not confirmed with the PML. This is the case, on one hand, of NEIGH, MLOCK and XLOCK, which present the opposite sign when comparing both estimation methods. On the other hand, the significance of IDIOM and GERMAN with PML is not confirmed with OLS.
Also notorious is the fact that some specific bilateral relations between groups of countries that were shown to be relevant with PML loose significance with OLS, namely the existence of a space for export growth in the cases of CC and EU11’s trade with the CEEC. In fact, if based on OLS estimates one would have wrongly concluded that no specific group of countries showed capacity to expand its trade in 2002.
4. Trade Potential
The usual approach to measure trade potential focuses on the ratio between potential and verified bilateral trade relations, considering that the potential (“normal”) trade volumes are equal to the fitted trade, obtained with the estimated coefficients of the gravity model. On one hand, a ratio higher than one represents a trade potential in the sense that the potential flow is higher than its respective verified flow and is usually interpreted
as a positive sign, as exports indicate the existence of space to grow in the future. One could conclude that the country’s exports have not been able to supply all the trading space available, if compared to the average behavior of the EU25 countries with the same characteristics. Of course, the existence of a trade potential is beneficial only if the country is able to perform adjustments to make a better use of its current capacities. On the other hand, a ratio smaller than one means that the country’s exports are higher than those expected from a country with the same characteristics implying that it has exhausted its current export capacities.
In this section we evaluate the trade potential in manufactured products of each individual EU25 countries with each one of the three groups of countries that we have considered, following that classical approach. Fitted exports were calculated from the PML estimator as, and according to section 3.2, the OLS estimator would be inadequate to obtain the predicted values due to the effect of the Jensen’s inequality. Given the RESET test results, the regression for imports was used. We will notwithstanding read the results in terms of the export capacities.
The identification of the countries with a trade potential, based on the value of the estimated ratio, should take into consideration the sample variation of the latter by considering confidence intervals or the test of hypothesis that its value is greater than one. However, that is not trivial to do given that potential trade is obtained by a nonlinear regression or, in the case of OLS, from a nonlinear transformation of the dependent variable of the linear regression. Therefore, we have chosen arbitrary a “safe margin” of 20% for the ratio and only ratios higher than 1.2 have been considered to represent a trade potential greater than the verified trade.
The values for the trade potential ratio for each one of the EU25 countries are displayed in Table 4, column (1). They can be interpreted as the country individual trade
potential corrected of the group effect. That is, if the bilateral trade of a country belongs to a “dynamic” relation - i.e. with a positive coefficient in the dummy variable that captures trade specificities between the group to which this country belongs and the importing group-, its expected or potential exports will be higher than those of another country with the same characteristics that does not belong to that “dynamic” between-groups’ trade relation. On the other hand, a country that belongs to a group with a “stagnant” trade relation with the group of its partner - i.e. with a negative coefficient in the respective inter-groups’ dummy - has a potential trade to the importing group that is lower than that of another country with the same characteristics that is not involved in that type of trade relation. This “correction” (caused by the fact that some of the dummies for the specific relations between pairs of groups are significant) seems reasonable as it gives increased trade possibilities to countries that are in a group that makes efficient use of its current capacities and penalizes those countries in a group that uses its current capacities inefficiently. We are aware of the limitation of this procedure to evaluate the trade potential, as emphasized by Egger (2002) and referred in the section 3.1. However, the purpose we have is only to identify at the individual country level those cases that have a more distinct behavior from the average.
Table 4
Focusing on figures on Table 4, column (1), it can be seen that the countries showing scope to increase their market share in the CEEC are Denmark, Luxembourg, Sweden, UK, Ireland and Portugal, whereas countries of the CEEC that display a trade potential are Estonia, Lithuania and Slovenia with both EU11 and CC, and Latvia and Slovakia with the CC only. Bulgaria, Hungary, Latvia, Lithuania, Romania and Slovakia show market opportunities in exports to countries of their own group.
Other situations of trade potential that do not involve the CEE countries are evident in the cases of Denmark, France, Luxembourg, UK, Greece and Spain when exporting to the EU11, whereas Greece, Portugal and Sweden show space to increase their exports to the CC.
For sake of comparison we also calculated the country trade potential non-corrected of the group effect. These results are displayed in Table 4, column 2. In comparison to the previous results, the only differences that are noteworthy is the evidence of a trade potential in the cases of Austria, Portugal and Sweden with the EU11, Greece and Spain with the CEEC and Romania with the CC, whereas Hungary and Denmark no longer show space to increase their exports to the CEEC and CC, respectively.
5. Conclusions
As regards the OLS estimator used in other papers to estimate the gravity model, we concluded in favor of the PML superiority, not only because of the Jensen’s inequality and inconsistency of OLS when heteroskedasticity is present, but also in particular, in our empirical study, in terms of the RESET test results. Additionally, some results obtained with the OLS estimator clearly differ from those displayed by the PML estimator. We have, consequently, shown that previous OLS results might be biased in terms of the variables’ individual coefficients and, consequently, of the potential trade evaluation.
Furthermore, the results have shown that the bilateral trade flows related to the EU25 members follow the normal rules of gravitation. It can also be concluded that trade liberalization between the EU members and the CEEC in the period that preceded 2002 has caused the subsequent trade adjustment to greatly progress. The trade potential figures indicate that CEEC exports may have progressively conquered the EU25 market during the liberalization process, displaying in 2002 an export performance above the average of the
countries with similar characteristics. Therefore, these countries have apparently exhausted their possibilities of export expansion in the EU25, unless, meanwhile, dynamic changes take place. However, the remaining EU25 countries have not yet reached their export potential with the CEEC markets. This asymmetry may be explained by the fact that the process of trade liberalization that preceded the free trade area of 2002 favored the CEEC, as markets’ openness was slower on their side.
As expected, not all-individual UE25 countries behaved according to the average of the group they belong to. For instance, in the case of the CEEC group, several countries were shown to be still below its “normal” trade when exporting either to the remaining groups or to countries of their own group.
While most studies that have used data on the early transition period of the CEEC generally point to an unused trade potential between the CEEC and the EU members (see Baldwin,1994, Gros and Gonciarz,1996, and Nilsson, 2000), studies with more recent data are basically in line with our conclusions. For instance, Egger (2002), Caetano and Galego (2005) and Bussiere et al (2005), based on a panel data approach, found that, at the end of the 1990s, trade between the EU and CEEC was close to its predicted level, while Caetano and Galego (2005) also concluded that CEEC exports to the EU appear to have converged more quickly than the reciprocal. The fact that our findings are broadly consistent with other studies that have used different estimating methodologies reinforces, therefore, their robustness.
Appendix Countries Included in the Data Set
Austria (AU), Belgium (BE), Bulgaria (BU), The Czech Republic (CZ), Denmark (DK), Estonia (EE), Finland (FI), France (FR), Germany (DE), Greece (GR), Hungary (HU), Ireland (IR), Italy (IT), Latvia (LV), Lithuania (LH), Luxembourg (LU), The Netherlands (NE), Poland (PL), Portugal (PT), Romania (RO), Slovakia (SK), Slovenia (SV), Spain (SP), Sweden (SW) and the United Kingdom (UK).
Variables
Dependent Variables
M - Nominal Import (cif) flows of manufactured products (covering Comext’s 2-digit Combined Nomenclature, codes 16 to 98), measured in thousands of euro, 2002. Source: European Commission’s Comext Database.
X - Nominal Export (fob) flows of manufactured products (covering Comext’s 2-digit Combined Nomenclature, codes 16 to 98), measured in thousands of euro. Source: European Commission’s Comext Database.
Independent Variables
DIST - Absolute Distance: the geodesic distance between capitals (in the case of The Netherlands, Amsterdam substitutes Den Haag), measured as the surface distance between two points of latitude and longitude (great circle distance), expressed in kilometers. Source:www.wcrl.ars.usda.gov/cec/java/lat-long.htm.
RDIST - Relative Distance: the geodesic (great circle) distance between the midpoint of each trading-country pair and the European Trade Center, expressed in kilometers. Source:www.wcrl.ars.usda.gov/cec/java/lat-long.htm.
MGDP/XGDP – Importer/Exporter country’s Nominal Gross Domestic Product at Market Prices, expressed in thousands of euro, 2002. Source: Eurostat’s New Cronos Database, Nov. 24th, 2003.
MPOP/XPOP – Importer/Exporter country’s Population, expressed in thousands of people at the end of 2002. Source: Eurostat’s New Cronos Database, November 24th, 2003. NEIGH - Neighboring Dummy Variable: equal to one if two trading partners share a land or sea border, zero otherwise. Source: CIA’s World Factbook 2003 on www.cia.gov/cia/publications/factbook/index.html.
IDIOM - Common Language Dummy Variable: equal to one if two trading partners share a same official language, zero otherwise. Source: CIA’s Factbook 2003 on www.cia.gov/cia/publications/factbook/index.html.
ETHN - Ethnic Dummy Variable: equal to one if there is in one of the countries an ethnic minority of the other country that represents more than 5% of total population of the latter, zero otherwise. Source: CIA’s The World Factbook 2003.
COS - COS Variable: complementarity measure of trading structures. See formula in the text. Covering 6-digit CN yearly data of manufactured products for 2002. Source: European Commission’s Comext Database.
EURO - Euro Dummy Variable: equal to one if both countries involved in the trade flow share the euro as a common currency, zero otherwise.
RECI(-1) – Reciprocity: the opposite trade flow of the dependant variable (2-digit of the Combined Nomenclature), measured in thousands of euro. Source: European Commission’s Comext Database, 2001 and 2002.
GERMAN - German Dummy Variable: equal to one if one of the countries involved in the trade flow is Germany, zero otherwise.
MLOCK/XLOCK - Landlockedness Dummy Variable for the Importer/Exporter country: is equal to one if the importing country has no direct connection to sea, zero otherwise. Specific group-pair dummies: CEECX-CEECM; CEECX-CCM; CEECX-EU11M; CCX-CEECM; CCX-CCM; CCX-EU11M; EU11X-CEECM; EU11X-CCM and EU11X–EU11. Equal to one if the exporting country belongs to the first group and the importing country to the second group, zero otherwise.
References
Abdalla, A. (1997), ‘The Impact of Euro-Mediterranean Partnerships on Trade Interests of the Organisation of the Islamic Conference Countries’, API Working Paper No. 9803, Arab Planning Institute, Kuwait, www.arab-api.org/wps9803.pdf.
Arnon, A., Spivak, A. and Weinblatt, J. (1996) ‘The Potential for Trade Between Israel, the Palestinians and Jordan’, The World Economy, 19 (1), pp. 113-134.
Baldwin, R.E. (1994).Towards an Integrated Europe, London: Centre for Economic Policy Research.
Bayoumi, T. and Eichengreen, B. (1995), ‘Is Regionalism Simply a Diversion? Evidence from the Evolution of the EC and EFTA’, NBER Working Paper No. 5283, National Bureau of Economic Research, Cambridge, MA, papers.nber.org/papers/w5283.
Beers, C.V. and Biessen, G. (1996). ‘Trade Possibilities and Structure of Foreign Trade: The Case of Hungary and Poland’, Comparative Economic Studies, 38, pp. 1-20.
Beers, C.V. and Linnemann, H. (1992). ‘Commodity Composition of Trade in Manufactures and South-South Trade Potential’, in Linnemann, H. (ed.), South-South Trade Preferences: The GSTP and Trade in Manufactures, Amsterdam: Indo-Dutch Studies on Development Alternatives No. 9, Sage Publications.
Boisso, D. and Ferrantino, M. (1997). ‘Economic Distance, Cultural Distance and Openness: Empirical Puzzles‘, Journal of Economic Integration, 12, pp. 456-484.
Brülhart, M. and Kelly, M. J. (1999). ‘Ireland’s Trading Potential with Central and Eastern European Countries: A Gravity Study’, Economic and Social Review, 20 (2), pp. 159-74. Bussière, M., Firdmuc, J. and Schnatz, B. (2005), ‘Trade Integration of Central and Eastern European Countries, Lessons from a Gravity Model?’, European Central Bank, Working Paper Series, nº 545, http://pappers.ssrn.com/sol3/papers.cfm.
Caetano, J. and Galego, A. (2005), ‘Trade Flows Among CEEC and EU Countries: What Future Perspectives’, Department of Economics, University of Évora, econwpa.wustl.edu/eps/it/papers/0504/0504002.pdf.
Cheng, I-H. and Wall, H. (2004), ‘Controlling for Heterogeneity in Gravity Models of Trade and Integration', The Federal Reserve Bank of St. Louis, Working Papers Series, 1999-010E, http://research.stlouisfed.org/wp/1999/1999-010.pdf.
Christie, E. (2002), ‘Potential Trade in Southeast Europe: A Gravity Model Approach’, WIIW Working Paper No. 21, The Vienna Institute for International Economic Studies, Vienna, www.wiiw.ac.at/balkan/files/Christie.pdf.
De Benedictis, L. and Vicarelli, C. (2005). ‘Trade Potentials in Gravity Panel Data Models’, Topics in Economic Analysis & Policy, Vol. 5: No. 1, Article 20, http://www.bepress.com/bejeap/topics/vol5/iss1/art20.
Dhar, S. and Panagariya, A. (1999), ‘Is East Asia Less Open than North America and the EEC? No’, in Piggott,J. and Woodland,A. (eds.), International Trade Policy and the Pacific Rim, London: Macmillan.
Egger, P. (2000). ‘A Note on the Proper Econometric Specification of the Gravity Equation’, Economics Letters, 66 (1), pp. 25-31.
Egger, P. (2002). ‘An Econometric View on the Estimation of Gravity Models and the Calculation of Trade Potentials’, The World Economy, 25 (2), pp. 297-312.
Egger, P. and Pfaffermayr (2003).’The Proper Panel Econometric Specification of the Gravity Equation: A Three-Way Model with Bilateral Interaction Effects’, Empirical Economics, 28, pp. 571-580.
Fidrmuc, J and Fidmurc, J. (2003). ‘Desintegration and Trade’, Review of International Economics, vol. 11, nº 5, pp. 811-29.
Finger, J.M. and Kreinin, M.E. (1979). ‘A Measure of Export-Similarity and Its Possible Uses’, The Economic Journal, 89, pp. 905-912.
Frankel, J.A. (1997).Regional Trading Blocs in the World Economic System, Washington D.C.: Institute for International Economics.
Gros, D. and Gonciarz, A. (1996). ‘A Note on the Trade Potential of Central and Eastern Europe’, European Journal of Political Economy, 12, pp. 709-721.
Hamilton, C.B. and Winters, L.A. (1992). ‘Opening Up International Trade with Eastern Europe’, Economic Policy, 14, pp. 77-116.
Javorcik, B.K.S. (2001). ‘Does Relative Location Matter for Bilateral Trade Flows? An Extension of the Gravity Model’, Journal of Economic Integration, 16 (3), September, pp. 379-398.
Kandogan,Y. (2004), ‘The Role of Blocs on Trade: A Comparison Across Gravity Models’, Working Papers 2004-1, University of Michigan-Flint, School of Management, http://som.umflint.edu/yener/2004-01.pdf.
Kösekahyaoğlu, L. (1994), ‘An Analysis of the Similarity between Exports of Turkey and the European Union-12’, Working Paper of the Department of Economics, Isparta
Lamotte, O. (2002), ‘Trade Potential between Yugoslavia and the European Union’, Proceedings of the June 6th-8th Conference on Globalisation and Economic Governance by the EACES, Bologna,
euroest.economia.unitn.it/Eaces/work/Papers/EACES%20Potential.pdf.
Linder, S.B. (1961). An Essay on Trade and Transformation, New York: John Wiley. Linnemann, H. (1966).An Econometric Study of International Trade Flows, Amsterdam: North Holland Publishing Company.
Linnemann, H. and Beers, C.V. (1988). ‘Measures of Export-Import Similarity and the Linder Hypothesis Once Again’, Weltwirtschaftliches Archiv, 124 (3), pp. 445-457.
Martínez-Zarzoso, I. and Nowak-Lehmann, F.D. (2001), ‘Augmented Gravity Model: An Empirical Application to Mercosur-European Union Trade Flows’, IAIER Discussion Paper No. 77, Ibero-American Institute for Economic Research of the University of Göttingen, Göttingen, econwpa.wustl.edu:8089/eps/it/papers/0309/0309019.pdf.
Mátyás, L. (1997). ‘Proper Econometric Specification of the Gravity Model’, The World Economy, 20 (3), pp. 363-68.
Nilsson, L. (2000). ‘Trade Integration and the EU Economic Membership Criteria’, European Journal of Political Economy, 16, pp. 807-827.
Paas, T. (2002), ‘Gravity Approach for Exploring Baltic Sea Regional Integration in the Field of International Trade’, HWWA Discussion Paper No. 180, Hamburg Institute of International Economics, Hamburg,
www.hwwa.de/Publikationen/Discussion_Paper/2002/180.pdf.
Packauskaite, J., Lazauskas, V. and Grigas, S. (2002). Potential Trade Flows Between Lithuania and Countries of the EU. The Application of the Gravity Model, EconWatch 2001-2002 Project, Vilnius: Vilnius University,
www.eurofakultetas.vu.lt/Programmes/Econwatch2002/gravpaper.pdf.
Polak, J.J. (1996). ‘Is APEC a Natural Regional Trading Bloc? A Critique of the Gravity Model of International Trade’, The World Economy, 19 (5), pp. 533-544.
Rosati, D.K. (1992). ‘Problems of Post-CMEA Trade and Payments’, in Flemming, J. and Rollo, J.M.C. (eds.), Trade, Payments and Adjustment in Central and Eastern Europe, London: Royal Institute of International Affairs.
Rose, A. (2000). ‘One Money, One Market, Estimating the Effect of a Common Currency on Trade’, Economic Policy, 30, pp.7-45.
Santos Silva, J.M.C. and Tenreyro, S. (2006). ‘The Log of Gravity”, Review of Economics and Statistics, forthcoming, http://ssrn.com/abstract=872865
Schumacher, D. (2001), ‘Market Size and Factor Endowment: Explaining Comparative Advantage in Bilateral Trade by Differences in Income and Per Capita Income’, DiW Discussion Paper No. 259, Deutsches Institut für Wirtschaftsforschung, Berlin,
www.diw.de/deutsch/dasinstitut/info/2005/eea_2005/Schumacher_Siliverstovs_EEA_2005 .pdf.
Wang, Z.K. and Winters, L.A. (1992).‘The Trading Potentialof Eastern Europe’,Journal of Economic Integration, 7 (2), pp. 113-136.
Winters, L.A. and Wang, Z.K.(1994). Eastern Europe’s International Trade, Manchester: Manchester University Press.
Wooldridge, J.M. (2003). Introductory Econometrics, a Modern Approach, Mason, OH: South-Western.
Yeyati, E. (2001), ‘On the Impact of a Common Currency on Bilateral Trade’,Universidad Tormato Di Tella, Mimeo, http://www.utdt.edu/~ely/commoncurrency.pdf.
Statistical Tables
Table 1 – Exports to the EU25, EU11, CEEC and CC (in € billions)
Evolution from 1999 to 2002 1999 2002
Share Increase Share Share
Exporting
country Increase (%) EU11
(pp) CEEC (pp) CC (pp) Total EU25
Trade EU11 (%) CEEC (%) (%) CC Total EU25
Trade EU11 (%) CEEC (%) (%) CC
EU25 24.3 -1.51 1.25 0.26 1 324 80.9 7.5 11.6 1 645 79.4 8.7 11.8 EU11 21.2 -1.51 1.16 0.34 1 111 80.5 7.4 12.2 1 346 78.9 8.5 12.5 CEEC 58.8 -1.01 0.58 0.43 86.4 81.0 15.5 3.5 137.2 80.0 16.1 3.9 CC 27.6 -2.16 1.13 1.03 127.0 84.9 3.1 11.9 161.9 82.8 4.3 13.0 Austria 30.9 0.15 -0.14 0.00 38.0 77.7 16.8 5.5 49.8 77.8 16.6 5.5 Belgium 32.4 0.09 0.19 -0.29 103.6 89.8 3.0 7.2 137.2 89.9 3.2 6.9 Denmark 31.4 -1.92 0.58 1.34 22.0 86.9 6.9 6.2 28.8 85.0 7.5 7.5 Finland 15.6 0.70 0.12 -0.83 23.5 80.1 11.7 8.2 27.2 80.8 11.9 7.3 France 16.9 -2.01 1.31 0.70 166.1 77.6 4.9 17.5 194.2 75.6 6.2 18.2 Germany 23.4 -2.03 1.52 0.51 312.6 78.2 11.4 10.3 385.8 76.2 13.0 10.8 Italy 16.8 -3.43 3.14 0.29 120.9 74.4 10.1 15.5 141.3 70.9 13.3 15.8 Luxemb. 72.0 -1.12 -0.29 1.40 5.0 91.9 3.4 4.7 8.6 90.8 3.1 6.1 Netherl. 22.3 -0.65 0.39 0.26 133.3 89.9 2.6 7.4 163.0 89.3 3.0 7.7 Sweden 9.7 0.39 1.17 -1.56 46.6 85.2 6.7 8.2 51.1 85.6 7.8 6.6 Utd. Kg. 14.4 -2.94 0.58 2.36 138.8 75.8 3.7 20.5 158.9 72.9 4.3 22.8 Bulgaria 57.9 5.46 0.55 -6.01 2.3 72.5 9.6 17.9 3.7 78.0 10.1 11.9 Czech R. 62.1 1.00 -1.34 0.34 20.5 76.7 20.1 3.2 33.3 77.7 18.8 3.5 Estonia 54.6 -0.79 -0.98 1.76 2.1 84.4 13.6 2.0 3.3 83.7 12.6 3.7 Hungary 48.1 -1.83 2.22 -0.39 18.4 86.5 9.7 3.8 27.3 84.7 12.0 3.4 Latvia 39.0 -1.02 1.16 -0.14 1.6 83.9 12.6 3.5 2.2 82.9 13.8 3.4 Lithuania 68.5 -5.18 0.66 4.52 2.0 74.7 22.8 2.5 3.4 69.5 23.5 7.0 Poland 66.7 -2.62 1.46 1.16 18.9 84.1 12.8 3.1 31.4 81.5 14.3 4.2 Romania 83.6 -1.34 0.67 0.67 6.0 87.4 7.8 4.7 11.1 86.1 8.5 5.4 Slovakia 59.6 1.13 -1.89 0.76 8.6 66.7 31.8 1.5 13.7 67.9 29.9 2.2 Slovenia 33.5 -3.36 3.00 0.36 5.9 86.5 11.4 2.0 7.9 83.2 14.4 2.4 Greece 28.7 -5.57 3.89 1.67 4.5 80.8 14.1 5.1 5.8 75.3 18.0 6.7 Ireland 31.5 -0.79 0.10 0.69 40.0 93.2 1.9 4.8 52.6 92.4 2.0 5.5 Portugal 27.3 -5.35 0.94 4.41 17.8 79.9 1.8 18.3 22.6 74.5 2.7 22.7 Spain 25.1 -2.14 1.68 0.46 64.7 81.5 3.5 15.0 80.9 79.3 5.2 15.5
Table 2 – COS averages by country group and partner countries with the maximum and the minimum COS values in intra-EU25 trade (2002)
Exporter EU25 Avg. EU11 Avg. CEEC Avg. CC Avg. Maximum Minimum Austria 0.463 0.473 0.473 0.413 DK (0.614) – DE 0.590) IR (0.328) – GR (0.292) Belgium 0.587 0.598 0.600 0.528 LV (0.741) – IT (0.708) HU (0.372) – IR (0.344) Denmark 0.440 0.447 0.462 0.372 AU (0.582) – LV(0.550) GR (0.351) – LH (0.348) Finland 0.341 0.359 0.355 0.260 DK (0.675) – AU(0.551) IR (0.208) – BE (0.153) France 0.527 0.581 0.479 0.513 DE (0.727) – IT (0.716) RO (0.397) – HU(0.350) Germany 0.594 0.642 0.563 0.553 UK (0.789) – IT (0.765) IR (0.421) – RO (0.414) Italy 0.558 0.566 0.564 0.524 PT (0.654) – PL (0.652) LU (0.399) – IR (0.361)
Luxembourg 0.201 0.229 0.181 0.178 DK (0.311) – AU(0.282) GR (0.125) –BE(0.0931)
Netherlands 0.570 0.580 0.573 0.540 LV (0.749) – CZ (0.701) GR (0.458) – LH (0.370) Sweden 0.577 0.593 0.598 0.483 FI (0.760) – DK (0.724) LU (0.393) – IR (0.327) Utd King. 0.633 0.676 0.615 0.573 DK (0.818) – SW(0.733) LU (0.514) – GR (0.481) Bulgaria 0.334 0.330 0.362 0.279 SV (0.570) – LV (0.567) IR (0.176) – LH (0.168) Czech Rep. 0.484 0.498 0.470 0.475 SK (0.642) – PT (0.635) IR (0.335) – BE (0.333) Estonia 0.234 0.259 0.236 0.160 DK (0.475) – FI (0.472) IR (0.128) – BE (0.086) Hungary 0.412 0.440 0.405 0.350 DK (0.639) – AU(0.543) GR (0.293) – BE (0.246) Latvia 0.122 0.128 0.121 0.111 DK (0.203) – BE (0.156) IR (0.066) – LU (0.054) Lithuania 0.427 0.416 0.462 0.379 LV (0.707) – SV (0.706) HU (0.244) – IR (0.232) Poland 0.306 0.288 0.324 0.313 PT (0.463) – SK (0.435) LU (0.183) – IR (0.142) Romania 0.340 0.334 0.367 0.295 SV (0.585) – EE (0.519) BE (0.201) – IR (0.168) Slovakia 0.514 0.532 0.512 0.468 UK (0.711) – SE (0.694) HU (0.294) – IR (0.275) Slovenia 0.344 0.333 0.364 0.329 SK (0.515) – PT (0.509) IR (0.173) – LU (0.140) Greece 0.372 0.369 0.395 0.306 SV (0.633) – LV (0.629) HU (0.234) – LH(0.164) Ireland 0.373 0.408 0.361 0.285 BE (0.663) – NE (0.593) GR (0.249) – LU (0.206) Portugal 0.439 0.482 0.404 0.396 IT (0.669) – SP (0.649) IR (0.270) – GR (0.270) Spain 0.589 0.619 0.561 0.573 PT (0.854) – IT (0.832) HU (0.397) – IR (0.341)
Table 3 – Poisson Pseudo-Maximum Likelihood (PML) and OLS estimates for intra-EU25 trade (2002)
PML estimator OLS estimator
Variables Dependent Var.
X Dependent Var. M Dependent Var. LX Dependent Var. LM Constant -15.1324 (-13.78) -18.9646 (-12.25) -7.1014 (-5.59) -6.3663 (-4.78) LDIST -0.4665 (-6.18) -0.4305 (-6.44) -0.6290 (-7.63) -0.7596 (-9.64) LMGDP -0.1303 (-1.52) 0.1631 (2.80) 0.2333 (4.37) 0.2099 (3.54) LXGDP 0.6679 (7.06) 0.6684 (5.44) 0.8119 (10.39) 0.8553 (9.68) LMPOP 0.4594 (5.94) 0.1901 (4.04) 0.2595 (5.85) 0.2400 (4.55) LXPOP -0.3638 (-3.93) -0.4276 (-3.36) -0.3579 (-4.91) -0.3369 (-4.37) NEIGH 0.1855 (2.01) IDIOM 0.2089 (1.65) 0.2136 (2.19) LCOS 0.6233 (4.10) 0.7032 (5.32) 0.2606 (2.76) 0.4095 (3.43) EURO 0.2801 (3.06) 0.2696 (3.42) 0.2233 (2.89) 0.2855 (3.52) GERMAN 0.2346 (3.41) 0.1706 (2.68) MLOCK -0.2753 (-4.03) -0.4377 (-5.93) XLOCK -0.2893 (-2.80) -0.2641 (-3.00) 0.2046 (2.71) LRECI(-1) 0.4247 (6.78) 0.4869 (8.96) 0.4454 (10.37) 0.4367 (9.67) CEECX-CEECM 0.7875 (3.37) 0.6174 (3.82) 0.6351 (3.36) CCX-CEECM -0.8225 (-5.07) -0.2434 (-1.93) EU11X-CCM 0.3683 (4.68) 0.2228 (2.22) 0.4501 (4.38) EU11X-CEECM -0.7269 (-4.75) CEECX-CCM 0.6037 (2.54) 0.5099 (2.94) 0.7075 (4.06) CEECX-EU11M 0.6951 (4.58) 0.7345 (3.34) 0.6390 (4.35) 0.7340 (4.36) R-Squared 0.91 0.94 0.93 0.92 RESET test (p-value) 0.066 0.353 0.001 0.002 N 600 600 600 600
Table 4 – Ratio of Potential to Verified Exports in terms of the PML estimator for intra-EU25 trade with the group effect (1) and without the group effect (2)-2002 Exporter EU11 as Importer CEEC as Importer CC as Importer
(1) (2) (1) (2) (1) (2) Austria 1.08 1.22 0.92 1.01 1.05 0.91 Belgium 0.88 0.87 1.11 1.12 1.04 0.77 Denmark 1.28 1.29 2.43 2.46 1.17 0.91 Finland 0.84 0.88 0.89 0.98 0.77 0.63 France 1.23 1.27 0.93 0.97 1.04 0.82 Germany 0.88 0.91 0.92 0.97 1.03 0.78 Italy 0.92 0.98 0.83 0.90 0.86 0.68 Luxembourg 1.40 1.53 1.28 1.44 0.95 0.80 Netherlands 0.81 0.79 1.18 1.17 1.11 0.81 Sweden 1.13 1.22 1.61 1.74 1.43 1.15 UK 1.24 1.22 1.92 1.91 0.93 0.70 Bulgaria 1.01 1.11 2.32 2.26 0.66 0.92 Czech R. 1.10 0.93 0.76 0.62 0.93 0.99 Estonia 1.30 1.17 1.07 0.97 1.54 1.86 Hungary 0.74 0.67 1.26 0.09 0.70 0.84 Latvia 1.00 0.98 1.31 1.24 1.32 1.64 Lithuania 1.63 1.45 1.76 1.50 2.59 2.84 Poland 0.96 0.83 0.89 0.70 0.96 1.03 Romania 0.59 0.82 1.29 1.69 0.82 1.42 Slovakia 1.03 0.98 0.66 0.61 1.51 1.84 Slovenia 1.95 1.37 2.28 1.46 3.70 3.33 Greece 3.17 4.28 1.11 1.94 3.37 4.95 Ireland 0.69 0.67 1.50 1.88 0.61 0.66 Portugal 1.07 1.34 1.65 2.88 1.56 2.02 Spain 1.22 1.38 0.79 1.22 0.60 0.76