www.adv-geosci.net/23/11/2010/
© Author(s) 2010. This work is distributed under the Creative Commons Attribution 3.0 License.
Geosciences
Prediction of lightning flash density with the WRF model
B. Lynn1,2and Y. Yair3
1The Hebrew University of Jerusalem, Jerusalem, Israel 2Weather-It-Is, Efrat, Israel
3The Open University of Israel, Ra’anana, Israel
Received: 30 March 2009 – Revised: 10 January 2010 – Accepted: 13 January 2010 – Published: 17 February 2010
Abstract. The Lightning Potential Index (LPI) is a mea-sure of the potential for charge generation and separation that leads to lightning flashes in convective thunderstorms. It is calculated from model simulated updraft and microphysical fields. It was designed to predict the potential of lightning occurrence in operational weather forecasting models, but could possibly be used to improve short-range forecasts of heavy rain. The index is modified here to be model grid-scale transparent between 1 and 4 km (the approximate upper limit of explicit microphysical weather forecasts). Two case stud-ies show that the modification appears to work quite well, and that LPI can be calculated on both an extremely high res-olution research-grid (i.e., 1.33 km) and high resres-olution (i.e., 4 km) operationally compatible forecast grid. Analytical ex-pressions are presented to use the LPI to predict the hourly lightning flash density.
1 Introduction
Lightning is a characteristic of severe weather and often ac-companies large hail and torrential rains, which under certain circumstances (terrain type, slope, drainage, soil saturation) can turn into flash floods. It is also a natural hazard by it-self, with potential lethal consequences to human life and considerable damages to electrical infrastructures and avia-tion. The need for lightning prediction is clear and indeed many real-time lightning detection systems are now able to accurately determine the impact location of cloud-to-ground lightning (see review in Sect. 6.10 in MacGorman and Rust,
Correspondence to:B. Lynn ([email protected])
1998). There has been, however, a much lower capability to forecast the potential for lightning occurrence in short-range forecasts. Although several indices are used by meteorolo-gists to forecast the probabilities of thunderstorms (such as LI, KI, CAPE and CPTP), they are not based on the mi-crophysics of charge separation in thunderstorms and rely on thermodynamic instability parameters, thus resulting in coarse scale outputs.
Recently Lynn and Yair (2008) and Yair et al. (2010) de-scribed the development and utilization of the Lightning Po-tential Index (LPI), a new index for evaluating the poten-tial for lightning activity from weather forecast model output data. Yair et al. (2010) showed that the LPI correlates pos-itively with observed lightning density and also heavy rain-fall. They suggested that the LPI could be used to predict the potential for the occurrence of lightning, and reasoned that it may be used as an intermediary to improve short-range fore-casts of heavy rain through comparing observed lightning to model calculated LPI intensity and location. The LPI is calculated within the charge separation region of clouds be-tween 0◦ and−20◦C, where the non-inductive mechanism by collisions of ice and graupel particles in the presence of super-cooled water is most effective (see extensive review of charge separation mechanisms operating in thunderstorms by Saunders, 2008). Although the LPI is an empirical equa-tion, it consists of cloud-physical parameters – so the LPI as a measure of the potential for electrical activity should be location independent.
grid resolution twice a day over the Continental US, while other operational forecast centers use 3 or 4 km grid resolu-tion. The present paper suggests how to modify the LPI from its current formulation so as to become grid-scale “transpar-ent” between 1 and 4 km grid resolution. It also uses obser-vations and model calculated LPI to derive equations that can be used to predict lightning density.
2 Model description
2.1 The Lightning Potential Index (LPI)
The LPI is defined as the volume integral of the total mass flux of ice and liquid water within the “charging zone” (0 to
−20◦C) in a developing thundercloud. It portrays the po-tential of the thundercloud to separate electrical charge in the relevant depth via the non-inductive ice-graupel mecha-nism, but it does not calculate the resultant electric field or its evolution. It is derived from the model simulated grid-scale updraft velocity and the mass mixing-ratios of liquid water, cloud ice, snow, and graupel. This approach is in line with many studies showing strong and consistent relationships be-tween lightning flash rates (that can be integrated in time to give total lightning) and the presence of small ice and high precipitation rates (Petersen and Rutledge, 1998; Sherwood et al., 2006). Deierling et al. (2008) and Deierling and Pe-tersen (2008) showed that the updraft volume in the charging zone (at temperatures below −5◦C) was highly correlated with total lightning activity. Recent modeling work by Mc-Gorman et al. (2008) showed that the relationships of total flash rates with rain mass, ice crystal mass flux, and graupel volume are significant (>0.65), while weak correlation (0.3) is found between maximum flash rate and maximum up-draft. Wiens (2008) summarized numerous studies during the STEPS campaigns, combining remote and in-situ mea-surements of cloud microphysical properties and the electri-cal behavior of the storm. Their main finding was that the total flash rate of the storm is strongly correlated with the graupel echo volume and also with the updraft volume.
These studies give strong experimental and observational support to the concept of the LPI, which in essence maps the fluxes of the main charging agents in thunderstorms. The LPI evolves with time since it is calculated from the microphysi-cal and dynamimicrophysi-cal model fields at each time step and in every domain grid point. It is non-zero only within the charging zone, and furthermore the LPI for a particular model grid is only non-zero when a majority of cells within a 5 grid-radius of that grid point have a vertical velocity>0.5 m s−1, indi-cating the growth phase of the thunderstorm. The LPI has the units of [J kg−1] and is defined by:
LPI=1/V ∫∫∫ε w2dx dy dz (1) whereV is the model unit volume, w is the vertical wind component in ms−1. The integral is computed within the
cloud volume from the freezing level (altitude in km above the surface) to the height of the−20◦C isotherm; the model computed mass mixing ratios for snow (qs), cloud ice (qi)
and graupel (qg) are in units (kg/kg), andεis a dimensionless
number which has value between 0 and 1 defined by: ε=2(QiQl)0.5/(Qi+Ql) (2)
where Ql is the total liquid water mass mixing ratio in
(kg/kg) andQi is the ice fractional mixing ratio in (kg/kg)
defined by
Qi=qg[((qsqg)0.5/(qs+qg))+((qiqg)0.5/(qi+qg))](3)
In essence,εis a scaling factor for the cloud updraft, and at-tains a maximal value when the mixing ratios of super-cooled liquid water (Ql) and of the combined ice species (Qi) are
equal (note, Qi is also obtains a maximal value when the
mass mixing ratio of ice, snow, and graupel are equal). It signifies the fact that charge separation requires all these in-gredients to operate synergistically within the charging zone, as shown by many laboratory experiments summarized by Saunders (2008).
One purpose of the study was to investigate the promise of using the LPI in operational forecast models. To this end the formulation used by Yair et al. (2009) was modified by multiplying it by the grid resolution in kilometers (divided by 1.33 km; the base resolution). This is based on the continuity equation, assuming that the gradient of the horizontal wind is proportional to the vertical velocity divided by the length of a grid box. Simulation results from different case studies (not described here) of LPI ranging from a 1.33 km grid to those averaged to a 4 km grid (hosting the 1.33 km grid in a two-way nesting configuration) were analyzed, and it was found that such a relationship is a good approximation. Another goal of this study is to use the LPI to calculate the predicted lightning flash density. The method is described in the results section, and is based on the analysis presented there.
3 Methodology
3.1 The Weather Research and Forecasting model (WRF)
90×90 elements at 36 km grid resolution. Domain 2 had 136×136 elements at 12 km grid resolution. Domain 3 had 181×181 elements at 4 km grid resolution, and Domain 4 had 232×232 elements at 1km grid resolution. There was two-way nesting between the grids. The model has run ei-ther using the first three grids (where the innermost grid was at 4 km) or all four grids (where the innermost grid was at 1.33 km grids). The WRF Single Moment Scheme (Dudhia et al., 2009) was used for calculating the required parameters for computing the LPI.
The investigation included two cases, both of which had significant lightning activity and heavy rainfall. Case A was taken from the FLASH project data base, and consti-tutes a 24 h simulation of an early-fall flash flood that oc-curred in the Emilia Romagna region in north-western Italy, on 8 September 2006. Lightning activity in this event was very widespread, but was highly concentrated near the site of the flash flood. Case B was a winter-type heavy rain event in northern Israel which occurred on 28 February 2009, with the heaviest rain falling in the Lake Kinneret basin (Sea of Galilee).
3.2 Lightning data
For the Israeli case study, cloud-to-ground (CG) lightning lo-cations obtained from the Israeli Electrical Company LPATS (Altaratz et al., 2003) were used, an array that includes 7 VLF antennas, dispersed over the country. The system detects cloud-to-ground lightning flashes that occur in Is-rael and up to 500 km from its borders, with a stated detec-tion efficiency of∼90%; the unique network configuration of the LPATS detectors in Israel is dictated by the geogra-phy and results in almost a straight north-south line, which leads to detection minima in regions which are further out of the network coverage along this line. Specifically, the ar-eas of southern Lebanon and the Gulf of Eilat in the Red Sea display a lower percentage of detection. Operationally, this system only detects cloud-to ground (CG) flashes and misses Intra-Cloud (IC) activity, and hence the total numbers of flashes reported in the various case studies in Israel is al-ways lower than the actual lightning number. Despite this limitation the LPATS data properly represents the spatial dis-tribution of lightning activity, as CG and IC flashes evolve together along the cloud life cycle (Altaratz et al., 2003).
For the Italian case study, data from the ZEUS European network were employed, which has good coverage of the central and western Mediterranean. This is a long-range lightning detection network with receivers located at 6 sites in Europe (Lagouvardos et al., 2009). The ZEUS receivers detect sferics discharges in the VLF frequency range (7– 15 kHz) emitted by CG lightning and are capable of captur-ing up to 70 sferics per second. The location accuracy of ZEUS is of the order of 6 km over the Mediterranean region, and it is also capable of detecting some fraction of the intr-acloud flashes (IC), though the exact value may be hard to
estimate. Further details on the ZEUS network can be found in Kotroni and Lagouvardos (2008).
4 Results from the two case studies
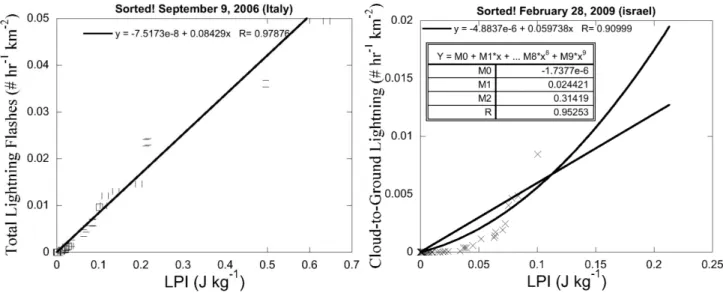
Figure 1 shows observed lightning and predicted LPI for each case study. A visual inspection shows that both the 1.33 km and 4 km grids predicted the size and locale of places where thunderstorms occurred in both events. Figure 2 shows the correlations between the values of LPI and the accumulated numbers of observed lightning flashes. Only data in the over-lapping areas of the 1.33 km grids were used to calculate the correlations in each case. To obtain the data for these figures, the observed lightning flashes (from 00:00 UTC on each start date to 00:00 UTC on the next day) and values of LPI were time averaged (over the 24 h simulation), and then each was summed within each 36km WRF outer grid and then area av-eraged. Thus there were 81 4 km2 and 729 1.33 km2WRF grid cells within the WRF 36km grid over which the averag-ing was done.
There is a linear correlation between the lightning density (in units of flashes per km2per hour) and the time-averaged values of computed LPI and in both case studies. The corre-lation values for the 1.33 km grid scale in case study A are slightly lower compared to the 4 km grid scale (0.39 vs. 0.46) while for case study B the opposite is true (0.71 vs. 0.65). The most likely reason for the fact that the correlations are relatively low in the Italy case-study is because the model simulated less accurately the location of the strongest con-vection compared to the Israel case study. This is apparent from Fig. 1, where a spatial offset is evident.
Fig. 1. Observed 24 h lightning is two case studies for Italy and Israel. The upper row is for case study(A)9 September 2008 (ZEUS network), and the lower row for case study(B)28 February 2009 (LPATS network), respectively. WRF model calculated, 24 h averaged, Lightning Potential Index (LPI) for both cases at 4 km (center) and 1.33 km (right) grid resolution for the same dates.
Fig. 3.Lightning versus LPI for the two case studies Italy (left) and Israel (right) averaged for 36 km grid points.
timing and location of predicted lightning producing clouds. For example, a visual inspection of Fig. 1 suggests that both the 1.33 km and 4 km simulations over-estimate the spatial extend of high LPI values compared to the coverage of high numbers of accumulated total lightning, which suggests that the linear relationship shown in Fig. 3 for Case A should probably be steeper than shown.
5 Concluding remarks
The Lightning Potential Index (LPI) is a measure of the potential for charge generation and separation that leads to lightning flashes in convective thunderstorms, calculated from the WRF model microphysical and dynamical fields. The WRF model was used to simulate two heavy-rain events which had significant lightning activity. The model repro-duced the general characteristics of convection and the spa-tial distribution of lightning activity. When averaged over a 36×36 km2area, the results show robust relationships be-tween the values of LPI and the observed lightning activity. It can be concluded that the usage of the Lightning Potential Index (LPI) in operational 4-km grid scale models can yield valuable information on major areas where convection is ex-pected and where the potential for thunderstorms is large.
Maps of LPI and predicted lighting density can be pro-duced in regular operational runs of short range forecasting models and to serve as a valuable early warning tool for rele-vant users. For instance, the observed lightning fields can be compared to the model predicted LPI (over shorter time peri-ods than used in this analysis). High correlations between the two would suggest that the model predicted evolution of LPI should be considered as a potential warning for the short-term future evolution of lightning. Moreover, such high correlations would indicate that the model predicted rainfall
should be treated with greater confidence than without the knowledge of predicted LPI. Spatial variations between the locations of model predicted LPI (and the associated heavy rain) would suggest that potential flash-flood watches for other locations should be upgraded to warnings and vice-versa.
Acknowledgements. This research was conducted in the
frame-work of the FLASH project, contract number 036852 of the EU 6th Framework Program.
Edited by: S. Michaelides, K. Nicolaides, and A. Orphanou Reviewed by: O. Altaratz and V. Kotroni
References
Altaratz, O., Levin, Z., Yair, Y., and Ziv, B.: Lightning Activity over Land and Sea on the Eastern Coast of the Mediterranean, Mon. Weather Rev., 131, 2060–2070, 2003.
Deierling, W., Petersen, W. A., Latham, J., Ellis, S., and Chris-tian, H. J.: The relationship between lightning activity and ice fluxes in thunderstorms, J. Geophys. Res., 113, D15210, doi:10.1029/2007JD009700, 2003.
Deierling, W. and Petersen, W. A.: Total lightning activity as an in-dicator of updraft characteristics, J. Geophys. Res., 113, D16210, doi:10.1029/2007JD009598, 2008.
Dudhia, J., Hong, S.-Y., and Lim, K.-S.: A new method for rep-resenting mixed-phase particle fall speeds in bulk microphysics parameterizations, J. Meteorol. Soc. Jpn., 86, 33–44, 2008. Kotroni, V. and Lagouvardos, K.: Lightning occurrence in
re-lation with elevation, terrain slope and vegetation cover over the Mediterranean, J. Geophys. Res.-Atmos., 113, D21118, doi:10.1029/2008JD010605, 2008.
1713–1717, 2009,
http://www.nat-hazards-earth-syst-sci.net/9/1713/2009/. Lynn, B. H. and Yair, Y.: Lightning Potential Index: A new tool
for predicting the lightning density and the potential for ex-treme rainfall. Geophysical Research Abstracts, EGU General Assembly, Vienna, Vol. 10, EGU2008-A-01571, SRef-ID: 1607-7962/gra/EGU2008-A-01571, 2008.
MacGorman, D. R. and Rust, W. D.: The Electrical Nature of Storms, Oxford Univ. Press, 422 pp., 1998.
MacGorman, D. R., Cohen, A., Mansell, T., and Ziegler, C.: Flash rate, electrical, microphysical, and dynamical relationships across a simulated storm spectrum, Eos Trans. AGU, 89(53), Fall Meet. Suppl., Abstract AE24A-06, 2008.
Petersen, W. A. and Rutledge, S. A.: On the relationship between cloud-to-ground lightning and convective rainfall, J. Geophys. Res., 103, 14025–14040, 1998.
Saunders C. P. R. : Charge separation mechnisms in clouds, Space Sci. Rev., 137(1–4), 335–354, doi:10.1007/s11214-008-09345-0, 2008.
Sherwood, S. C., Phillips, V. T. J., and Wettlhaufer, J. S.: Small ice crystals and the climatology of lightning, Geophys. Res. Lett., 33, L05804, doi:10.1029/2005GL025242, 2006.
Skamarock, W. C., Klemp, J. B., Dudhia, J., Gill, D. O., Barker, D. M., Wang, W., and Powers, J. G.: A description of the advanced research WRF version 2, NCAR Technical Note 468+STR, June 2005, revised, January, 2007.
Thompson, G., Rasmussen, R. M., and Manning, K.: Explicit forecasts of winter precipitation using an improved bulk mi-crophysics scheme, Part I: Description and sensitivity analysis, Mon. Weather Rev., 132, 519–542, 2004.
Wiens, K. C.: Summary of Colorado State University’s LMA-Related Observations from STEPS, Eos Trans. AGU, 89(53), Fall Meet. Suppl., Abstract AE24A-07, 2008.