Jerónimo Martins and
Soriana – The Northern
Expansion
Diogo Pimenta
Dissertation written under the supervision of António Luís Borges de
Assunção.
Dissertation submitted in partial fulfilment of requirements for the MSc in
Finance, at the Universidade Católica Portuguesa, February 2019.
i
Abstract
The main goal of this dissertation is to study the hypothesis of an acquisition in the retail sector, between Group Jerónimo Martins (acquirer) and Organización Soriana (target). Jerónimo Martins is an international group focused on the food distribution and specialized retail. To what the former is concerned, JMT operates in three countries – Portugal, Colombia and Poland – totaling two continents, Europe and America. The latter’s operation, on the other hand, focuses solely in the European continent through brands such as Hebe, Jeronymo and Hussel. Organización Soriana operates grocery and department retail stores representing the second largest retailer in Mexico. Yet, the firm is going through a rough period due to both its high level of debt and costs. Consequently, the operation poses as a great opportunity for any of the firms involved. By leveraging on its American’s retail market expertise obtained through its internationalization experience with Ara, Group Jerónimo Martins would be able to expand its operation to a new market strengthening its position in the American Continent. Organización Soriana could, likewise, take advantage of this operation to solidify its financial statements. The combined company would be able to, not only decrease its costs due to the reduction in the number of employees, but also through the increase in leverage over the other supply chain players resulting in an increase in bargaining power. Such synergies are valued at 1,408.90 million Euros.
Abstrato
O principal objetivo deste dissertação é estudar a viabilidade da aquisição por parte do Grupo Jerónimo Martins (adquirente) e da Organização Soriana (empresa alvo). Jerónimo Martins é um grupo internacional focado nos sectores da distribuição alimentar e do retalho especializado. No que toca ao sector da distribuição alimentar, o Grupo opera em três países – Portugal, Colombia e Polónia – totalizando dois continente, Europa e América. Por outro lado, no retalho especializado, a empresa foca-se somente no continente Europeu, através da operacionalização de marcas como Hebe, Jeronymo e Hussel.
A Organização Soriana desempenha a sua atividade através da gestão de mercearias e supermercados, representando o segundo maior retalhista no mercado Mexicano. Contudo, a empresa tem estado a ultrapassar um período adverso, resultado do seu elevado nível de endividamento e estrutura de custos desadequada. Consequentemente, a operação de fusão entre as firmas surge como uma excelente oportunidade para ambas. Ao utilizar o conhecimento do mercado americano ganho através da sua experiência com a marca Ara, o Grupo Jerónimo Martins seria capaz de expandir a sua operação para um novo mercado, reforçando a sua posição no mesmo. De forma similar, a Soriana poderia tirar proveito desta operação para solidificar a sua posição financeira. A empresa resultante desta operação seria capaz não só de diminuir os seus custos derivado da redução do número de empregados, mas também de tirar partido de alterações na cadeia de valor resultando num maior poder negocial com os seus fornecedores. Tais sinergias estão avaliadas em 1,408.90 milhões de Euros.
Keywords: acquisition, merger, synergies, valuation, retail Author: Diogo de Almeida Campos Pimenta
ii
Acknowledgments
First and foremost, I would like to express my gratitude to Professor António Borges de Assunção for his mentoring, motivation, enthusiasm and support through the completion of this thesis. Both his passion for teaching and his ability to guide one has left an impact on me that it will never wear out.
I would also like to take the opportunity to extend my gratitude to all Católica Lisbon School of Business & Economics’ staff for the amazing experience that they were able to provide me for the past two years.
Last but not least, I would like to extend my gratitude to my family and friends who supported me from day one. If it had not been for them, I would have never became aware of how much potential one holds – and, for that, I’m forever grateful.
iii
Table of Contents
LIST OF FIGURES ... VI LIST OF ABBREVIATIONS ... VII
INTRODUCTION ... 1
1 LITERATURE REVIEW ... 2
1.1 MERGERS AND ACQUISITIONS... 2
1.1.1 Drivers of an M&A ... 2
1.1.2 Are M&A worth it? ... 3
1.2 M&A VALUATION ... 4
1.3 CROSS BORDER DEALS ... 5
1.4 PAYMENT METHOD ... 5 2 INDUSTRY ANALYSIS ... 7 2.1 COMPANIES ANALYSIS ... 9 2.2 JERÓNIMO MARTINS ... 10 2.3 SORIANA ... 14 3 DEAL RATIONALE ... 17 4 VALUATION ... 18 4.1 JERÓNIMO MARTINS ... 18 4.1.1 Financial Projections ... 18
4.1.2 Weighted-Average Cost of Capital ... 22
4.1.3 Discounted Cash-Flow Model ... 23
4.1.4 Relative Valuation ... 24
4.1.5 Valuation Summary ... 25
4.2 SORIANA ... 26
4.2.1 Financial Projections ... 26
4.2.2 Weighted-Average Cost of Capital ... 30
4.2.3 Discounted Cash-Flow Model ... 31
4.2.4 Relative Valuation ... 33
4.2.5 Valuation Summary ... 34
5 SYNERGIES ... 35
5.1 COMBINED FIRM WITHOUT SYNERGIES ... 36
5.2 COMBINED FIRM WITH SYNERGIES ... 37
6 THE TRANSACTION ... 40
7 POST-MERGER INTEGRATION ... 42
8 CONCLUSION ... 43
9 APPENDICES ... 44
9.1 JERÓNIMO MARTINS’ HISTORICAL FINANCIAL RATIOS ... 44
iv
9.3 JERÓNIMO MARTINS’ FORECASTED NET SALES’ GROWTH ... 45
9.4 JERÓNIMO MARTINS’ FORECASTED COGS’ GROWTH ... 46
9.5 JERÓNIMO MARTINS FORECASTED SG&A EXPENSES GROWTH ... 46
9.6 JERÓNIMO MARTINS’ EBIT PROJECTIONS ... 46
9.7 JERÓNIMO MARTINS’ FORECASTED D&A’S GROWTH ... 46
9.8 JERÓNIMO MARTINS’ FORECASTED D&A’S GROWTH ... 47
9.9 JERÓNIMO MARTINS’ FORECASTED CAPITAL EXPENDITURES’ GROWTH ... 47
9.10 JERONIMO MARTIN’S WEIGHTED-AVERAGE COST OF CAPITAL ... 47
9.11 JERONIMO MARTINS’ DISCOUNTED CASH-FLOW MODEL ASSUMPTIONS ... 48
9.12 JERÓNIMO MARTINS’ HISTORICAL NET SALES’ GROWTH RATE ... 48
9.13 JERÓNIMO MARTINS’ HISTORICAL COST OF GOODS SOLD IN PROPORTION TO SALES 48 9.14 JERÓNIMO MARTINS HISTORICAL SG&A EXPENSES IN PROPORTION TO SALES 49 9.15 JERÓNIMO MARTINS’ HISTORICAL DEPRECIATION/AMORTIZATION’S GROWTH RATE 49 9.16 JERÓNIMO MARTINS’ FREE CASH FLOW TO THE FIRM’S FORECAST ... 49
9.17 JERÓNIMO MARTINS’ PRESENT VALUE FOR THE FREE CASH FLOWS TO THE FIRM 50 9.18 JERONIMO MARTINS’ TOTAL VALUE OF THE FIRM SUMMARY ... 50
9.19 JERÓNIMO MARTINS’ MULTIPLES ... 50
9.20 SORIANA’S FORECASTED NET SALES’ GROWTH ... 50
9.21 SORIANA’S FORECASTED COGS’ GROWTH ... 51
9.22 SORIANA’S EBIT PROJECTIONS ... 51
9.23 SORIANA’S FORECASTED D&A’S GROWTH ... 51
9.24 SORIANA’S FORECASTED CAPEX’S GROWTH ... 51
9.25 SORIANA’S FORECASTED CHANGES IN WORKING CAPITAL’S GROWTH ... 52
9.26 SORIANA’S HISTORICAL DEPRECIATION/AMORTIZATION’S GROWTH RATE .. 52
9.27 SORIANA’S WEIGHTED-AVERAGE COST OF CAPITAL ... 52
9.28 SORIANA’S DISCOUNTED CASH-FLOW MODEL’S ASSUMPTIONS... 53
9.29 SORIANA NET SALES’ HISTORICAL GROWTH RATE ... 53
9.30 SORIANA’S HISTORICAL COST OF GOODS SOLD IN PROPORTION TO SALES ... 53
9.31 SORIANA’S HISTORICAL SG&A EXPENSES IN PROPORTION TO SALES ... 54
9.32 SORIANA’S HISTORICAL DEPRECIATION/AMORTIZATION’S GROWTH RATE .. 54
9.33 SORIANA’S FREE CASH FLOW TO THE FIRM’S FORECAST ... 54
9.34 SORIANA’S PRESENT VALUE FOR THE FREE CASH FLOWS TO THE FIRM ... 55
v
9.36 SORIANA’S MULTIPLES ... 55
vi
List of Figures
FIGURE 1 - REVENUES OF JERÓNIMO MARTINS' PEER GROUP IN 2018 IN BILLION U.S.
DOLLARS (THOMSON REUTERS EIKON, 2019) ... 11
FIGURE 2 - JERÓNIMO MARTINS' STOCK PRICE EVOLUTION AND S&P 500 (THOMSON REUTERS EIKON, 2019) ... 12
FIGURE 3 - REVENUES OF SORIANA'S PEER GROUP IN 2018 (THOMSON REUTERS EIKON, 2019)... 14
FIGURE 4 - SORIANA'S STOCK PRICE EVOLUTION AND S&P 500 (THOMSON REUTERS EIKON, 2019) ... 15
FIGURE 5 - JERÓNIMO MARTINS' FREE CASH FLOW TO THE FIRM ... 21
FIGURE 6 - JERÓNIMO MARTINS' PEER GROUP - RELATIVE VALUATION ... 25
FIGURE 7- VALUATION RANGE OF JERÓNIMO MARTINS' ENTERPRISE VALUE ... 25
FIGURE 8 - VALUATION RANGE OF JERÓNIMO MARTINS' EQUITY VALUE ... 26
FIGURE 9 - SORIANA'S FREE CASH FLOW TO THE FIRM ... 29
FIGURE 10 - SORIANA'S PEER GROUP - RELATIVE VALUATION ... 33
FIGURE 11 - VALUATION RANGE OF SORIANA'S ENTERPRISE VALUE (IN MILLION MEXICAN NEW PESOS) ... 34
FIGURE 12 - VALUATION RANGE OF SORIANA'S EQUITY VALUE (IN MILLION MEXICAN NEW PESOS) ... 35
FIGURE 13 - COMBINED FIRM'S FREE CASH FLOW TO THE FIRM W/OUT SYNERGIES .... 39
vii
List of Abbreviations
APV Adjusted Present Value
COGS Cost of Goods Sold
CV Continuing Value
DCF Discounted Cash-Flow
EBIT Earnings Before Interest and Taxes
EBITDA Earnings Before Interest, Taxes, Depreciation, and Amortization
FCF Free Cash Flow
FCFF Free Cash Flow to the Firm
IMF International Monetary Fund
JMT Jerónimo Martins
M&A Mergers and Acquisitions
PMI Post-Merger Integration
ROE Return on Equity
ROIC Return on Invested Capital
SG&A Selling, General and Administrative
1
Introduction
This thesis presents the hypothesis of Jerónimo Martins acquiring Soriana, a Mexican Retailer, and analyses both companies involved and the synergies that could arise from the combination of the two firms.
In the subsequent chapter, the existing literature on Mergers and Acquisitions (M&A) is reviewed, where important topics such as drivers of M&A, valuation techniques, and synergies will be discussed.
Moving on into the 2nd chapter, one will study the industry in which both companies operate with a deep focus on the competitive analysis and its outlook.
On the next chapter, this thesis aims to explain why this deal would be beneficial for both players and why exactly it makes sense for the retailers to merge into a single entity.
It, then, follows the valuation of both companies involved in the deal in chapter 4. Starting with Jerónimo Martins followed by Soriana, one will develop a deep understanding on how each company is performing by having a look at each strategy, economic and financial analysis.
Before moving on to the transaction itself and how to perform the post-merger integration at chapters 0 and 7, respectively, one will first have a look at synergies which are expected to come out of the proposed deal and how much they are worth on chapter 5.
Lastly, chapter 8 presents the conclusions on whether Jerónimo Martins should or not invest in Soriana as a way to expand its operation to a new market and, if so, at which price should Soriana’s shares be priced.
2
1 Literature Review
The pursue for growth is something which has been intrinsically linked to the economy activity, in general. Such growth can typically be achieved either organically or inorganically. Organic growth occurs when a firm develops itself in a standalone basis. In other words, when a company increases its output or enhances its sales (i.e., pursues strategies which allow it to grow its customer base or invests in assets which enable an increase in productivity). Inorganic growth, on the other hand, derives from a merger, acquisition or takeover operation rather than an increase in the company's own business activity.
As this thesis presents the hypothesis of Jerónimo Martins acquiring Soriana, one will focus primarily on the second type of growth. Therefore, throughout this chapter, one will look at what motivates a firm to grow inorganically rather than organically, through which methods can an acquirer evaluate a potential target, how can such financial operation generate value for the acquiring shareholders, whether or not such strategies work and ultimately how can one guarantee the achievement of a successful merger.
1.1 Mergers and Acquisitions 1.1.1 Drivers of an M&A
Ultimately, the main driver of a Merger & Acquisition deal should be to increase value for shareholders of both firms. Cloodt, M., Hagedoorn, J. and Kranenburg, Hans V. (2006) mentioned that many companies carry on looking at M&A as a popular and well succeeded strategy of growth. How that growth is generated, however, may vary largely depending on which companies are in on the deal. One could argue that a good proxy for such would be increases in industry concentration, competitiveness, productivity growth, or technology transfer which, in turn, can be measured by valuing synergies, increases in diversification, use of excess cash or market power. Nonetheless, not all of these options have been created equal.
When looking for a reason to justify a deal, executives usually recur to synergies – i.e., the additional value that is generated by combining two firms that would not been available to these
3
firms operating independently. Consequently, the success of a deal will be largely dependent on the how well one values the synergies in a given investment and how well aligned with reality are the assumptions supporting the synergies’ forecast.
Synergies can be categorized either in operational (e.g., revenue enhancement and cost savings) or financial (e.g., tax benefits, diversification, a higher debt capacity and uses for excess cash). Put differently, operating synergies affect the operations of the combined firm whereas financial synergies, on the other hand, are more focused on potential higher cash flows or a lower cost of capital (discount rate) or both.
Previous research has shown that focusing on acquiring companies in a related field increases the likelihood that the acquiring firm will be able to exploit synergies. Particularly, some authors (Bruner, Where M&A Pays and Where It Strays: A Survey of the Research, 2004) have shown that focusing on related businesses works better than diversifying. Furthermore, studies also show evidence that an increase in market share done through horizontal M&A (i.e., mergers in which companies operate within the same sector) providea positive returns. Surprisingly, even in such case, the increase of market share is not the main driver for the increase in wealth, however. Interestingly, it is the exploitation of the synergies created by the combination of two companies that are very similar and use the same resources that potentiate increase in shareholder value.
As a consequence, one could argue that choosing a target is one of the most – if not the single most – important decision a firm should on.
1.1.2 Are M&A worth it?
As previously mentioned, the primary driving force that often justifies the interest in a merger or acquisition is the creation of synergies. Yet, in his paper The Value of Synergy, Damodaran, A. (2005) makes a case on how seldom are companies able to deliver the value they were expected to extract from synergies. Such happens, essentially, due to the fact that synergies are incorrectly valued, inadequately planned for and much more difficult to put into practice than to compute. Sirower, Mark L. (2006) has shown that there is historically a clear trend of drops
4
in the stock price of the acquiring firms after these announcements comes out, illustrating the market’s skepticism towards the announcement of a M&A deal – for knowing how hard it is to actually put synergies into practice.
According to the author, not only contributes to this skepticism the fact that companies face a hard time exploiting the synergies and integrating both cultures, but also the fact that acquisitions require full payment upfront and, therefore, any postponement in the promised synergies will massively affect the expected net present value of the investment
Therefore, one could be sceptic on whether or not to go ahead with such operation based exclusively on synergies.
1.2 M&A valuation
In order to conduct a successful M&A transaction both firms have to agree to a common price which, depending on the techniques employed, will require several variables. Depending on valuation method used and the assumptions made, one will come up with a final price. For that reason, it is crucial that one does not come up to a conclusion based solely on one technique.
This thesis focuses on a technique mostly known as discounted cash flow (DCF) model which is, later on, complemented by a relative valuation of both firms. Nonetheless, valuations can also be undertaken through other approaches such as the dividend discount model and the Adjusted Present Value.
Each technique has its own pros and cons and there is no such thing as a “one size fits all” to what valuation is concerned. Consequently, there is no single correct value for any given firm either.
The primary method considered on this thesis, the DFC model, derives the firm value from the present value of expected future cash flows of that firm which are then discounted by the Weighted Average Cost of Capital (WACC). This method uses discounted cash flows which are available for both equity and debt holders. The technique is known as the most accurate and
5
flexible method to value a company but the firm value is highly dependent on subjective forecasts.
1.3 Cross border deals
Cross-border deals have a bit more of complexity associated with it. Markets in developed countries are getting to a saturation point and, therefore, are fully mature. For that reason, companies start to look for alternatives to grow their business. Due to the efforts of several authors, it is by now well known that companies of leading developed markets are currently looking to emerging markets as an opportunity to grow – Zenner, M., Matthews, M. and Marks, J. (2008). This trend started being particularly noticeable after the most recent financial crisis which resulted in a reduction in domestic competition. Appropriately, emerging-market corporate acquirers today have valuations that are high relatively to both their developed-market peers and to their own historical valuations.
Consequently, acquirer must be well aware of how much the synergies from a prospect deal ought to be and how exactly will those be put in place to ensure that shareholders are able to get an increase in value. According to the same authors, it is, therefore, especially important to carry out an adjustment of the metrics of the standard valuation methods for tax, accounting, and risk differences among jurisdictions when performing a cross-border deal valuation.
1.4 Payment Method
It is also important to make a reflection on how will the acquiring company pay for the target’s acquisition. Historically, mergers have been typically paid by through common stock exchange whereas acquisition are usually paid in cash - Travlos, N. (1987). Yet, each method has its different signaling implications.
6
Some studies concluded that companies which acquire other through pure stock exchange acquisitions experienced significant losses whereas the ones which acquirers through cash offers experienced normal returns – Travlos, N. (1987)
Underlying any merger and acquisition deal there is the risk that by not being able to fully exploit the synergies’ values estimated, one will incur in an acquisition premium whose advantages will not be materialized. According to the literature – Rappaport, A., Sirower, M. (1999) –, in case the acquisition is done through cash, the acquiring firm’s shareholders are the ones who take on this risk. In transactions which involve stock transactions, however, that same risk is shared with selling shareholders.
Not only financials take play in how such deal is financed, however. Managers’ personality traits also have shown to influence such decision. According to some authors – Harris and Raviv (1988), Stulz (1988) and Amihud, Lev, and Travlos (1990) – managers who wish to preserve control over the firm (i.e., wish to avoid future ownership dilution) prefer to use cash as a payment method. Furthermore, there are also other factors influencing the chosen payment method such as target and acquiring dimensions and their investment opportunities – Martin (1996).
All of this has influence in the ways the market perceives the deal. In fact, certain authors – Hazelkorn, T., Zenner, M. and Shivdasani, A. (2004) – were able to empirically come up to the conclusion that cash transactions had a median shortterm excess return of 0.9% compared to -1.9% for stock transactions. Generally speaking, the market reaction was more favorable for cash-financed transactions than for stock-financed transactions. In the attempt to take this argument forward, some – Myers and Majluf (1984) – hypothesized that such phenomenon is a result of the asymmetry of information between the bidder and the target on the value of the bidder shares allows the bidder to offer shares if these are overvalued and to offer cash if they are undervalued.
7
2 Industry Analysis The Industry
The retail industry varies largely depending on the country one analyzes. Consequently, as JMT operates in three countries – Portugal, Poland and Colombia –, in order to fully understand the business, one must examine each of the markets separately.
Due to the outbreak of the global economic crisis in 2008 and subsequent constraints imposed by austerity measures, the industry started to pick up again in 2014. Although Portugal has witnessed a real income growth in the last few years mainly supported by the increase in the private consumption which lead to an increase in 5.7%, according to INE, from 2016 to 2017, the sub-prime crisis changed the way Portuguese families shopped with two clear trends emerging: (i) Portuguese citizens become more rational, waiting for promotions and discounts periods. As a consequence, families currently shop more often but buy less; (ii) consumers increase its connectiveness with brands and companies. Therefore, weighting more the pleasantry of the purchasing experience.
To what Poland is concerned, the retail market grew 6.0% in 2017, according to the Central Statistical Office. The specialized retail in health and beauty in Poland also showed a positive growth rate. Both sectors benefited from a basket of social measures whose primarily goal is to increase private consumption such as Family 500 Plus through which the government attributes 500 zlotys to each family for each child one has – first child excluded.
Conversely, in Colombia, the wholesale retail sector decreased by 4.7% in 2017, according to National Department Administrative of Statistics (DANE). Similarly, the gross sales in the Mexican retail sector decreased 2.0%, based on data from Instituto Nacional de Estadística y Geografía, although the country witness a stable economic performance on the overall economy. Such might be a consequence of the increase in global protectionism, increasing tensions between the United States of America and China and a reverse course to what energy and commodity prices are concerned. All factors hinder investment and trade enticing a decrease in trust by consumer.
8
Competitive Analysis
Outlook
In the following years, retail is expected to undergo constant disruptions as a new digital era is expected to outburst. Hence, a new wave of changes lies ahead. As a result, new smaller and tech-enabled competitors are appearing in the market. Therefore, it’s quite clear that what will separate winners from losers will be the retailers’ ability to focus their investments in empowering the consumer – which according to analysts it the only single certainty at the current moment – as these become increasingly aware of how much power they hold.
The challenge, therefore, will be how to drive true loyalty. To overcome such challenges, one must invest in consumers’ convenience, add value to the shopping experience, taking friction out of the journey and focusing on tearing down barriers. In order to do so, retailers will not only have to be able to adapt their current business model to target their campaigns for more personalized services but also to deploy advanced technologies to their business models in order to preserve their market share. This could be obtained by facial-recognition software, for instance.
In other words, in order to maintain their competitive advantage, traditional retailers will have to shift their competitive positioning. Growth will no longer be able to be obtained simply through expansion, but through big investments in all areas of the business.
As a consequence, the question that pose is: how can one differentiate itself in an era where digitally native vertical brands grew nearly three times faster by positioning themselves focused on consumer experience?
According to the Retail Industry Trends report produced by specialists at Deloitte, retailers must refine their value proposition and grow their customer base. To do so, mass customization must be abandoned and ultra-personalization through data aggregation and activation must be embraced generating more personalized experiences. Furthermore, tools such as machine
9
learning and automation will foster growth and increase revenue. Lastly, retailers must not forgo to look for adjacent sectors to increase value to customers.
2.1 Companies Analysis
Michael Porter’s Five Competitive Forces Model developed in 1998 helps companies to analyze the main existing risks within the industry they operate in. This strategic tool can be used for determining entry barriers, rivalry within the industry, pressure from substitutes and power of customers and suppliers.
Although most countries do not have entry barriers for the retail sector, the competition can be quite intense between the existing players This is particularly important due to the fact that it is extremely hard for a retailer to differentiate itself from other players – i.e., the pressure from substitutes is extremely high. Hence, consumers have a lot of bargaining power. Several factors contribute to this such as the availability of alternative options for buying like online shopping, different modes of payment, availability of home delivery service, and cost of the substitute products can intensify the threats from the substitutes.
In order to overcome these obstacles, a retailer might try to achieve a competitive edge over its counterparts by achieving economies of scale in production, stiff competitive rivalry amongst the other major industry players and/or offer a variety of products to maximize customer satisfaction and strengthening customer loyalty. Rivalry within the industry might be seen as both a weakness, if the competitive rivalry is high, or a opportunity, because is represents new avenues for maximizing profits for the firms.
Yet, if a new firm is able to stablish itself in the market, it might break the existing balance of the current players. In order to avoid that, companies operating in this sector usually try to strengthen their position by developing a lean distribution infrastructure and an efficient supply chain framework or gaining a cost advantage or low-cost leadership.
Retailers suppliers’ bargaining power, on the other hand, is usually low. Generally speaking, the suppliers bargaining power is expected to be high if the quality of the raw material or the
10
inputs are unique. Yet, in retail there is a high number of suppliers relative to retailers. Consequently, that proposition is not true. In other words, the former does not hold a lot of power over the latter.
2.2 Jerónimo Martins
Pedro Soares Dos Santos, the group’s Chairman of The Board of Directors and CEO strongly advocates that Jerónimo Martin’s vision is “to democratize the access to quality products and food solutions through a strategy geared towards value creation, defined by a philosophy of sustainable development.”. In order to make sure it’s able to achieve that, the Group focuses its food distribution and specialized retail operations on four pillars: (i) promoting good health through food; (ii) respecting the environment; (iii) sourcing responsibly; (iv) supporting surrounding communities. All of this contributes greatly to the ultimate objective, ensuring the continuity of the operations and autonomy in strategic decision-making, bearing in mind the various stakeholders. Consequently, the company has experienced an increasing growth, becoming one of the market leaders in the three countries it operates in – Portugal, Poland and Colombia.
What back in 1792 started as single mini market in the center of Lisbon, Portugal became one of most prestigious stores in the city shortly afterwards. Despite its initial success, it took Jerónimo Martins 146 years to undergo its first big transformation. It was not until 1938 that it started to invest in new areas of business, specifically in the manufacturing of margarines and cooking products. Nonetheless, what followed afterwards were years of good fortune and excellent crops resulting in the development of a joint venture with the english-dutch company Unilever in 1949.
Looking to expand its market reach, the firm changed its strategy completely in 1978 and invested in the food distribution industry (food retail and wholesale industries) with the establishment of the Pingo Doce supermarket chain. In order to solidify its market position, the firm acquired Recheio Cash & Carry (food wholesale chain) in 1988 followed by the acquisition of the Feira Nova hypermarket chain in 1993. It was not until 1997, however, that it turned
11
itself into an international player through the acquisition of Eurocash, a Polish food wholesale company.
Fast forwarding to 2019, Jerónimo Martins predicts very different outlooks for the several markets it operates in. In Portugal, although the scenario seems to be stable as no changes are foreseen in consumer’s consumption patterns there are still reason for concerns related primarily due to instability derived from Brexit and economic slowdown in Europe. Similarly, there are some reluctancies in Colombia due to the crisis that is ongoing in Venezuela. Conversely, Poland does not seem to conceal any problem as a maintenance of the good economic performance which the country has been benefiting is expected.
Regardless of the economic outlook, Jerónimo Martins focuses in promoting profitable and sustainable growth in the long-term. Therefore, the Group proactively conceptualizes ways to adjust to new challenges in the horizon – particularly the aging population which will have a hard time going shopping due to limited mobility. To tackle such challenges resulting of an uncertain future, the Group leverages on its strong financial position which allows it the flexibility to grow inorganically, if investing opportunities which fit the overall strategy present themselves. That is, investing on its expansion and growth, fortifying its market leader position and preserving its profitability profile.
Currently, Jerónimo Martins has a market capitalization of $8,90 billion (as of 04.08.2019). In a sector dominated by Walmart and Costco, the Portuguese retailer has been solidifying its position which has earned it the 55th position in the overall retailing industry and the 1st among its Portuguese peers from a revenue standpoint, according to Deloitte.
Figure 1 - Revenues of Jerónimo Martins' Peer Group in 2018 in billion U.S. Dollars (Thomson Reuters Eikon, 2019)
78 72 18 6 Carrefour SA Tesco PLC Jeronimo Martins SGPS SA Sonae SGPS SA
12
After becoming public in 1989, Jeronimo Martin’s stock price traced a trend of growth, with several picks along the way. The first big increase in the stock price occurred between 2008 and 2012. The second pick happened only two years later from 2014 to 2017 which is believed to have been caused by an ambitious expansion plan and program to convert over 1,700 stores to a new layout, focusing on valuing perishable items.
Figure 2 - Jerónimo Martins' Stock Price Evolution and S&P 500 (Thomson Reuters Eikon, 2019)
Regarding the capital structure of the company, the percentage of debt has been held somewhat constant for the past 5 years. From 75% in 2012 to 73% in 2018, debt has been representing, on average, 73% of total capital. This average debt-to-capital ratio of the historical period is higher than both the average ratio for the retail industry and food wholesalers, 65.17% and 63.00%, respectively (Damoradan, Debt to capital & debt to equity ratios).
Profitability
Industry Median 2012 2013 2014 2015 2016 2017 2018
Gross Margin 27.6% 20.6% 21.2% 22.1% 21.2% 22.2% 22.4% 22.4%
Operating Margin 9.4% 5.2% 5.3% 4.9% 4.9% 5.6% 6.0% 5.3%
Table 1 - Jeronimo Martins’ Profitability Ratios
DuPont/Earning Power Industry Median 2012 2013 2014 2015 2016 2017 2018 Asset Turnover 1.0% 1.41 1.37 1.28 1.20 1.30 1.19 1.17 Pretax ROA 5.60% 0.07 0.07 0.06 0.06 0.06 0.05 0.04 Pretax ROE 11.1% 0.13 0.13 0.10 0.11 0.13 0.12 0.09
Table 2 - Jerónimo Martins’ DuPont Ratios 0
100 200
13 Liquidity Industry Median 2012 2013 2014 2015 2016 2017 2018 Quick Ratio 0.9 0.31 0.37 0.38 1.26 0.29 0.3 0.28 Current Ratio 1.74 0.89 1.01 1.1 2.04 0.98 0.99 0.98
Times Interest Earned 5.8 18.2 - - - 4.4 3.7 3.5
Table 3 - Jerónimo Martins' Liquidity Ratios
Operating
Industry Median 2012 2013 2014 2015 2016 2017 2018
A/R Turnover 12.6 18.40 16.20 15.90 19.00 33.50 33.80 21.70
Inv Turnover 6.4 6.20 5.80 5.10 5.10 5.30 4.50 4.30
Table 4 - Jerónimo Martins' Operating Ratios
The FCF Statement has been quite irregular, registering values between $152 million and $514.6 million mainly due to investments in Capital Expenditures and changes regarding the long-term debt structure which might have been used to pay for dividends as these also increase within the historic period.
Jerónimo Martins seems to hold neither a competitive advantage in quality, perception or branding – which would allow it to charge more for its products – nor in product costs, considering that, compared to its peers, the Portuguese retailer gross margin’s figure has been historically lower than the industry median. However, it must manage its selling, general and administrative (SG&A) and interest expenses well, as it catches up on its peers at EBITDA margin – although this figure has been deterioration from 6.9% in 2012 to 5.6% in 2018.
Moreover, on what the firm’s ability to meet short-term obligations is concerned, both quick and current ratios are lower than the industry median. The current ratio has not been evolving much, rounding 0.46 within the historical period. The quick ratio, on the other hand, is particularly worrying as it is not only lower than the industry median but it also has decreased by 11%.
Nonetheless, the firm does seem to perform well on its ability to cover interest costs at 27.6x, well ahead of its peers, as on its capacity to turn inventory over, despite the fact that it has also been deteriorating from 19.8 in 2012 to 14.9 in 2018.
14
2.3 Soriana
Originally founded in 1968, Soriana came to existence as a dream of two brothers, Francisco and Armando Martín Borque, to become a market leader in the food retail sector by serving a continuously increasing number of communities, ultimately delivering the highest value to its shareholders. To do so, they focused on offering the best shopping experience for the client while, simultaneously, being the best place to work for their employees, derived from constant innovation. Therefore, it does not come as a surprise that Soriana focuses its Corporate Social Responsibility strategy in (i) being correct and polite, (ii) operating as a single team with a common goal, (iii) satisfying the Customer, (iv) doing as much as possible to anticipate and innovate and be committed to the Soriana insignia. Focusing on these 4 pillars, the company operates a total of 644 stores under various insignias such as “Soriana Hiper”, “Soriana Super”, “Soriana Mercado” and “Soriana Express”. Additionally, it offers online shopping and delivery services through Soriana e-commerce platform. Nonetheless, regardless of the insignia, it is common desire to build up a distinct and strong brand for their customers, suppliers, collaborators, shareholders and community. Such aspiration seems to be paying off. Although Soriana has fallen victim of a net income decrease of 21% to PS3.6B, partly offset by Share of profit (loss) of associates and increase in expense from PS28M to PS365.1M in 2018 due to market condition, it is currently the biggest retailer in Mexico and the fourth largest in Latin America.
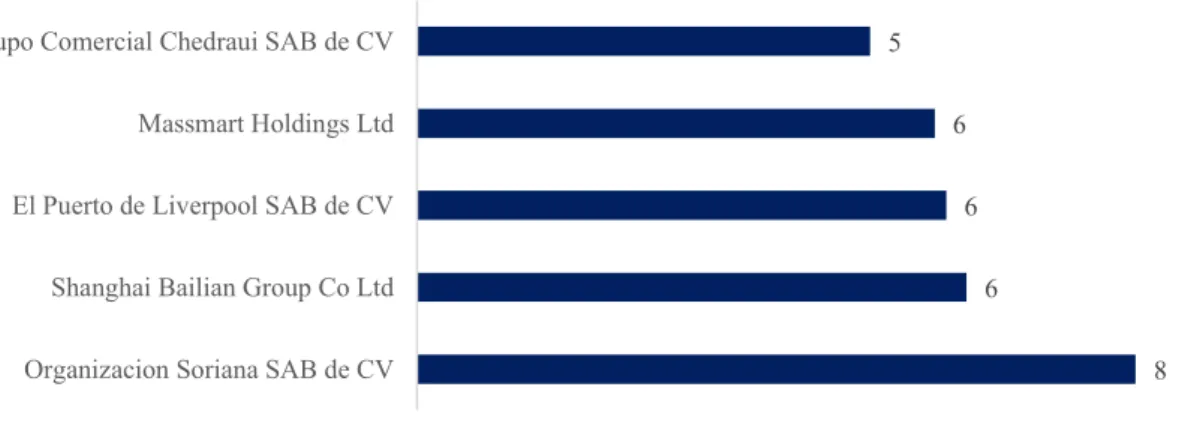
Figure 3 - Revenues of Soriana's Peer Group in 2018 (Thomson Reuters Eikon, 2019)
8 6
6 6 5
Organizacion Soriana SAB de CV Shanghai Bailian Group Co Ltd El Puerto de Liverpool SAB de CV Massmart Holdings Ltd Grupo Comercial Chedraui SAB de CV
15
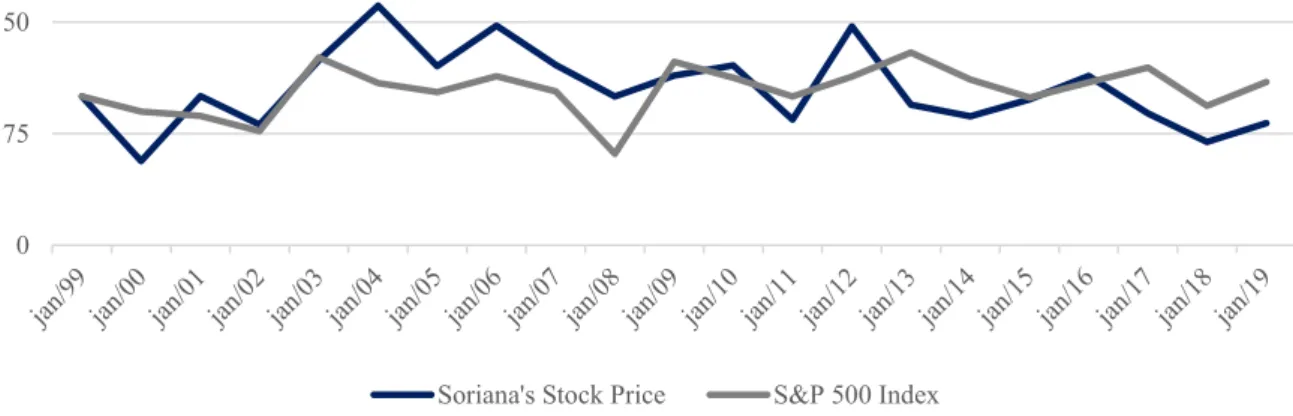
Figure 4 - Soriana's Stock Price Evolution and S&P 500 (Thomson Reuters Eikon, 2019)
Since 1987, Soriana has seen its stock price increase almost year after year. Nonetheless, the company encountered some problems in 2012 after hitting a peak at $49.3. Although it has experienced a slight improvement in 2016, it has yet to realize the full potential that once possessed. In fact, the company’s stock price has been decreasing for the past three years and has just recently matched 2006’s figure. This might be a consequence of Soriana being unable to keep up with its industry peers.
Financially, the company is, currently, at a weak standpoint. Although Gross Margin has been increasing steadily over the years, it is still under the industry mean. Similarly, the EBITDA Margin is also under the industry median with the aggravating circumstance that it is not performing any better right now than it was back in 2012. In fact, the net income generated from every $1 by the company’s assets has actually been decreasing. In this respect, ROA illustrates this quite clearly with a reduction from 7.0% to 4.3% in the historical period of 2012 to 2018. Here, what used to be a ratio in which the group performed better than its peers, is now just another one in which it is underperforming by those standards.
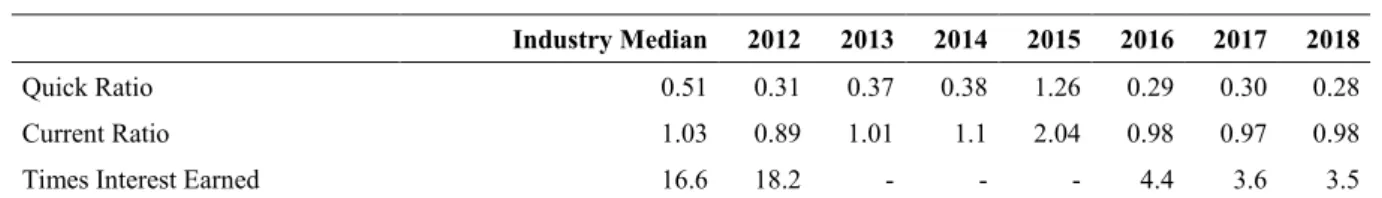
Moving on to liquidity the same scenario persists. Although the firm is doing better to what its current ratio is concerned compared to 2012, the quick ratio is deteriorating. Regardless of its development, both ratios paint a very dark picture on Soriana’s ability to pay short-term obligation through the liquidation of its current assets.
0 75 150 225
16
In summary, Soriana clearly appears to have a sub-optimal performance comparing it with its peers within the retail industry which could translate into the existence of room for improvement and further optimization of its operations.
Profitability
Industry Median 2012 2013 2014 2015 2016 2017 2018
Gross Margin 23.4% 20.6% 21.2% 22.1% 21.2% 22.2% 22.4% 22.4%
EBITDA Margin 7.7% 7.1% 7.2% 6.9% 6.8% 7.9% 7.1% 7.7%
Table 5 - Soriana's Profitability Ratios
DuPont/Earning Power
Industry Median 2012 2013 2014 2015 2016 2017 2018
Pretax ROA 5.60% 0.07 0.07 0.06 0.06 0.06 0.05 0.04
Table 6 – Soriana’s DuPont Ratios
Liquidity
Industry Median 2012 2013 2014 2015 2016 2017 2018
Quick Ratio 0.51 0.31 0.37 0.38 1.26 0.29 0.30 0.28
Current Ratio 1.03 0.89 1.01 1.1 2.04 0.98 0.97 0.98
Times Interest Earned 16.6 18.2 - - - 4.4 3.6 3.5
Table 7 – Soriana’s Liquidity Ratios
Operating
Industry Median 2012 2013 2014 2015 2016 2017 2018
Inv Turnover 7.8 6.20 5.80 5.10 5.10 5.30 4.60 4.30
Table 8 – Soriana’s Operating Ratios
Focusing on the capital structure, Soriana has decrease slightly its debt-to-capital ratio from 2012 to 2014. At that point in time, we assisted a turning point in which the firm started to gradually increase the amount of debt held in proportion to its total capital. In result, in 2018 debt represented 55% to the company’s total capital.
The FCF Statement has witnessed a huge variation within the historical period in a very short period of time. From 2015 to 2016, the FCF grew by 76% particularly due the acquisition of Controladora Comercial Mexicana. The merger was justified as an opportunity to focus on
17
business formats and market segments which provide a greater opportunity for growth and profitability. Additionally, according to Soriana’s management, the operation would also add to the growth of the country, trigger innovation, offer new business opportunities for suppliers, raise consumption and investment, create more buying options nationally and generate more jobs. Furthermore, according to the Cash Flow of Financing Activities, it appears to have taken place some sort of debt renewal through the issuance of new debt to pay old one, probably due to lower interest rates which have been around lately. In other words, it looks like Soriana issued new debt and used that same debt to pay for old outstanding debt, which would only occur if the company had been able to negotiate a better (i.e., lower) interest rate on the new loan.
3 Deal Rationale
Strong management and effective planning from Jerónimo Martins have resulted in strong performance across the three continents in which the firm operates in. Nonetheless, one can grow so much through organic growth until it reaches its limit point. Therefore, as a means to improve its financial performance and increase shareholder value expanding its assets, income and market presence, the company could take its internationalization in the food distribution sector one step further. Gathering all the insight it has based on past successful transitions such as Biedronka and ARA, Jerónimo Martins could try to replicate the same approach and target another company, exploring the inorganic growth path once more.
Soriana poses as the perfect option to do so. On one hand, this group operates in a market in which Jerónimo Martins already has operations – Latin America; more specifically, Mexico. Consequently, the acquirer would be able to apply its know-how and market insight while, simultaneously, increasing its market share with a somehow controlled risk through the exploitation of a new market. Furthermore, by focusing on a horizontal merger, JMT would have access to cheaper raw materials (or increase cost efficiency). Lastly, there could be some tax considerations worth taking into consideration. If one argues that the new entity would not be so profitably right away, Jerónimo Martins could benefit from a tax-loss carried forward from the target entity, in order to decrease the tax to be paid on future income.
18
On the other hand, as one had already the opportunity to grasp from tables Table 5, Table 6, Table 7 and Table 8, Soriana it’s somehow under-performing comparing to its peers. Therefore, it has room for improvement to what operation’s optimization is concerned. In such a scenario, Sociedade Francisco Manuel dos Santos, SGPS SA should bid for a majority stake in the company with the ultimate goal to operate the new firm at will, taking the best use of prospective synergies.
4 Valuation
The enterprise value of a company at any given moment is nothing more than the sum of its future cash flows. Therefore, in order to accurately estimate the value of the firm, one needs to forecast its financial performance for the upcoming years. To do so, there are a few key assumptions guiding such exercise that must be made crystal clear, particularly to what the growth rate, the WACC and the tax rate is concerned.
4.1 Jerónimo Martins 4.1.1 Financial Projections
In order to compute the Free Cash Flow for each of the years, one would need nine components: Net Sales, Cost of Goods Sold, Selling, General and Administrative Expenses, EBIT, Tax Rate, EBI, Depreciation and Amortization, Changes in Working Capital and Capital Expenditure.
Starting by Net Sales, to forecast how much it will be for each of the years within the explicit period, one started out by taking into consideration the level of activity which the firm has been performing. In other words, by averaging out the net sales growth rate over the last six years one came up with an average growth rate of 8.09%.
This annual growth rate constituted the basis for calculating the Net Sales for the consequent years:
19
Net Sales Explicit Period’s Growth (in million EUR)
2018 2019 2020 2021 2022 2023
Net Sales 17,337.00 18,740.27 20,257.11 21,896.74 23,669.07 25,584.86
Table 9 - Jerónimo Martin's Net Sales Projections
To what Cost of Goods Sold is concerned, one computed the average of its historical proportion to Net Sales, resulting in 78.48%. This value was then multiplied by each year’s net sales according to Table 9, resulting in an annual figure for Cost of Goods Sold presented on Table 10:
COGS Explicit Period’s Growth (in million EUR)
2018 2019 2020 2021 2022 2023
COGS 13,606.42 14,707.73 15,898.19 17,184.99 18,575.96 20,079.50
Table 10 - Jerónimo Martins' Cost of Goods Sold Projections
The same logic was applied to the Selling, General and Administrative Expenses. In this case the historical proportion of it relative to Net Sales averaged 16.34% which represented the following figures:
SG&A Expenses Explicit Period’s Growth (in million EUR)
2018 2019 2020 2021 2022 2023
SG&A 2,833.08 3,062.39 3,310.27 3,578.20 3,867.82 4,180.89
Table 11 - Jerónimo Martins' SG&A Projections
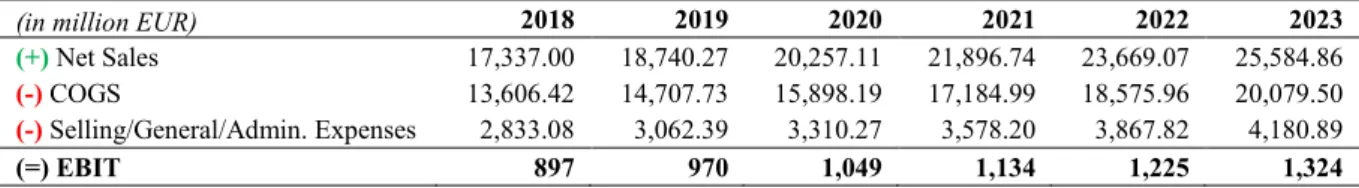
Based on the figures forecasted above, one can calculate the EBIT as shown in Table 12:
(in million EUR) 2018 2019 2020 2021 2022 2023
(+) Net Sales 17,337.00 18,740.27 20,257.11 21,896.74 23,669.07 25,584.86 (-) COGS 13,606.42 14,707.73 15,898.19 17,184.99 18,575.96 20,079.50 (-) Selling/General/Admin. Expenses 2,833.08 3,062.39 3,310.27 3,578.20 3,867.82 4,180.89
(=) EBIT 897 970 1,049 1,134 1,225 1,324
Table 12 - Jerónimo Martins' EBIT Projections
Moving one step closer to the FCFF, the EBI was calculated assuming that the income tax rate would keep stable at 23.50%, the same rate which JMT was subject to in 2018.
20
For the Depreciation and Amortization, the forecasted figures were computed in two phases. First, one computed the proportion of each year’s Depreciation/Amortization on the Property, Plant and Equipment’s total net value. Afterwards, the average from 2013 to 2018 was calculated – 6.67%. Table 13 presents the Depreciation and Amortization projections’ results for 2019 to 2023.
D&A Explicit Period’s Growth (in million EUR)
2018 2019 2020 2021 2022 2023
D&A 350.00 373.35 398.25 424.81 453.15 483.38
Table 13 - Jerónimo Martin's D&A Projections
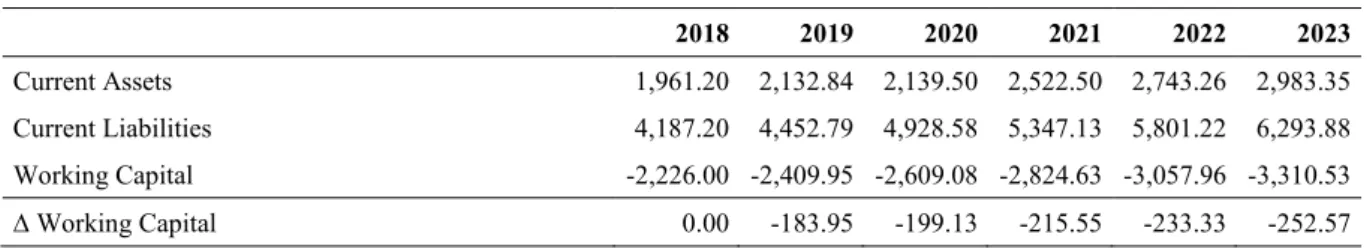
To what the Net Working Capital is concerned, one forecasted the figures for both Current Assets and Current Liabilities based on the last five years average growth rate – 8.75% and 8.49%, respectively – and from there derived the Working Capital and, subsequently, the Changes in Working Capital:
∆ Working Capital Explicit Period’s Growth (in million EUR)
2018 2019 2020 2021 2022 2023
Current Assets 1,961.20 2,132.84 2,139.50 2,522.50 2,743.26 2,983.35
Current Liabilities 4,187.20 4,452.79 4,928.58 5,347.13 5,801.22 6,293.88
Working Capital -2,226.00 -2,409.95 -2,609.08 -2,824.63 -3,057.96 -3,310.53
∆ Working Capital 0.00 -183.95 -199.13 -215.55 -233.33 -252.57
Table 14 - Jerónimo Martin's Working Capital Projections
Regarding the Capital Expenditure, for the purpose of this thesis, it was assumed to grow proportionally to the past five years’ operating income’s average growth rate. Therefore, the growth rate considered the same as the EBIT’s growth rate, 4.72%.
Capital Expenditures Explicit Period’s Growth (in million EUR)
2018 2019 2020 2021 2022 2023
CapEx -719.80 -753.80 -789.40 -826.68 -865.72 -906.61
21
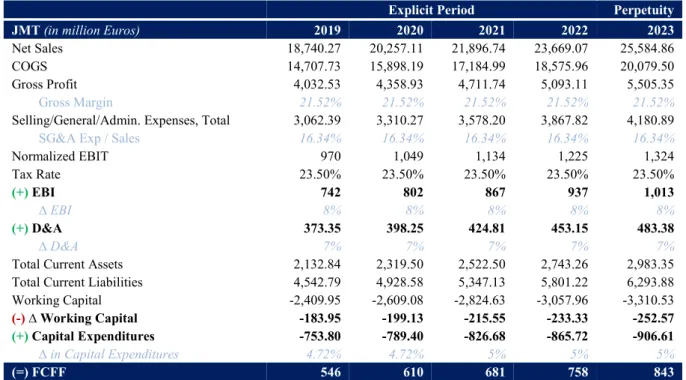
The aforementioned projections resulted in the Free Cash Flow to the Firm presented on Table 16 and Figure 5 - Jerónimo Martins' Free Cash Flow to the FirmFigure 5:
Explicit Period Perpetuity JMT (in million Euros) 2019 2020 2021 2022 2023
Net Sales 18,740.27 20,257.11 21,896.74 23,669.07 25,584.86
COGS 14,707.73 15,898.19 17,184.99 18,575.96 20,079.50
Gross Profit 4,032.53 4,358.93 4,711.74 5,093.11 5,505.35
Gross Margin 21.52% 21.52% 21.52% 21.52% 21.52% Selling/General/Admin. Expenses, Total 3,062.39 3,310.27 3,578.20 3,867.82 4,180.89
SG&A Exp / Sales 16.34% 16.34% 16.34% 16.34% 16.34%
Normalized EBIT 970 1,049 1,134 1,225 1,324 Tax Rate 23.50% 23.50% 23.50% 23.50% 23.50% (+) EBI 742 802 867 937 1,013 ∆ EBI 8% 8% 8% 8% 8% (+) D&A 373.35 398.25 424.81 453.15 483.38 ∆ D&A 7% 7% 7% 7% 7%
Total Current Assets 2,132.84 2,319.50 2,522.50 2,743.26 2,983.35
Total Current Liabilities 4,542.79 4,928.58 5,347.13 5,801.22 6,293.88
Working Capital -2,409.95 -2,609.08 -2,824.63 -3,057.96 -3,310.53
(-) ∆ Working Capital -183.95 -199.13 -215.55 -233.33 -252.57
(+) Capital Expenditures -753.80 -789.40 -826.68 -865.72 -906.61
∆ in Capital Expenditures 4.72% 4.72% 5% 5% 5%
(=) FCFF 546 610 681 758 843
Table 16 - Jerónimo Martins' Discounted Cash Flow Valuation Method
Figure 5 - Jerónimo Martins' Free Cash Flow to the Firm
546 610 681 758 843 2019 2020 2021 2022 2023 M il li on Eu r
22
4.1.2 Weighted-Average Cost of Capital
In order to compute the present value of the FCF, one must first calculate the rate of return that the investors will demand for investing in a given firm. Coming up with such figure required the use of the formula above:
𝑊𝐴𝐶𝐶 = 𝐷𝑒𝑏𝑡
𝐶𝑎𝑝𝑖𝑡𝑎𝑙∗ 𝑘𝑑∗ (1 − 𝑇𝑚) +
𝐸𝑞𝑢𝑖𝑡𝑦 𝐶𝑎𝑝𝑖𝑡𝑎𝑙∗ 𝑘𝑒
Tables Table 17, Table 18 and Table 19 show the assumptions that were in place while calculating Jerónimo Martins’ weighted-average cost of capital.
WACC Cost of Debt
Total Debt 639,200,000
Capital 2,417,100,000
D/C 3.86%
Annual interest payment 26,400,000.00
Net proceeds from issue of debenture or bond 288,400,000.00
Kd 4.13%
Table 17 - Jerónimo Martin's Cost of Debt
WACC Cost of Equity
Risk-free Rate 2.68%
β 1.02
Market Risk Premium 7.71%
Ke 10.54%
Table 18 - Jerónimo Martin's Cost of Capital
Weighted Average Cost of Capital
% Ke 10.54% E/V 96.14% Kd 4.13% 1-t 76.50 D/C 3.86% WACC 10.26%
23
4.1.3 Discounted Cash-Flow Model
The first method of valuation used in this thesis will be the Discounted Cash-Flow Model through which the company is valued by discounting the Free Cash Flow of the explicit period at the WACC rate (i.e., the rate of return required by the firms’ investors).
Taken that into consideration – and revisiting the projections we based our model on –, the following table can guide us through JMT’s valuation.
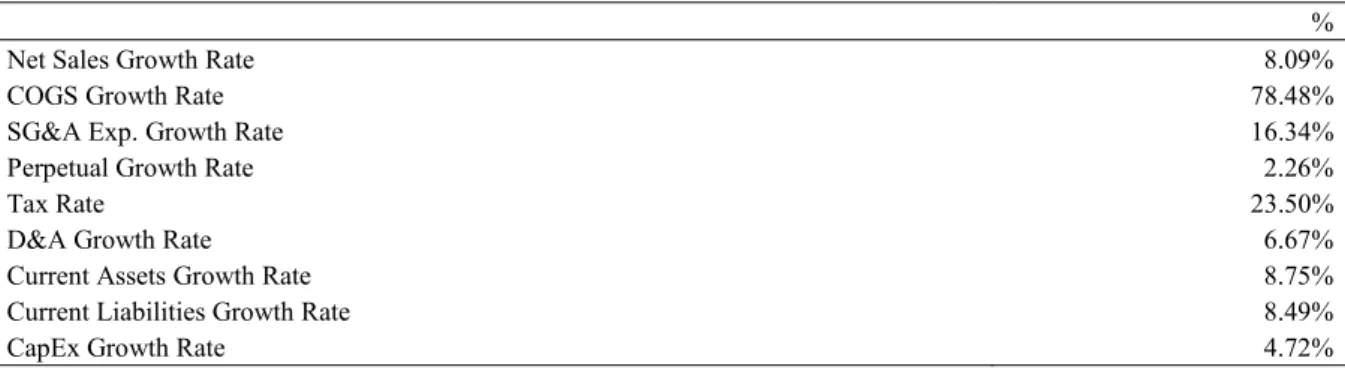
DCF Model Assumptions
%
Net Sales Growth Rate 8.09%
COGS Growth Rate 78.48%
SG&A Exp. Growth Rate 16.34%
Perpetual Growth Rate 2.26%
Tax Rate 23.50%
D&A Growth Rate 6.67%
Current Assets Growth Rate 8.75%
Current Liabilities Growth Rate 8.49%
CapEx Growth Rate 4.72%
Table 20 - Jerónimo Martin's DCF Assumptions
The perpetual growth rate for Jerónimo Martins was assumed to be a weighted-average of each countries’ 2023 forecasted growth rate by the IMF and the company’s net sales by country in 2018.
By discounting the figures presented on Figure 5 at the weighted-average cost of capital presented in the previous section, we get to the following present value of the free cash flow to the firm:
PV FCFF (in million EUR)
2019 2020 2021 2022 2023
Present Value of the FCFF 494.89 501.95 507.95 512.98 517.08
Table 21 - Jerónimo Martin's Present Value of Free Cash Flows to the Firm
From there, the Terminal Value (TV) has been considered by dividing the 2023’s FCFF by the difference between the WACC and the perpetual growth rate which adds up to, around, 10,540.08M €. Discounted, the present value of the TV corresponds to, approximately, 6,468.44€. Adding the PV of the FCFF of 2,534.85M euros, the total enterprise value of the firm is, then, 9,003.29 €.
24
4.1.3.1 Equity Value
In order to achieve one’s goal to determine the value of the firm one must add both the PV of the FCFF and the TV. Doing so results in a Total Value of the Firm of 9,003.29 million Euros. Afterward, one subtracts the firm’s net debt – 93.20M € – reaching an equity value of 8,910.09M €. Enterprise Value # Shares Outstanding 629,293,220 Enterprise Value 9,003.29€ Net Debt 93.20M€ Equity Value 8,910.09M €
Table 22 - Jerónimo Martin's Equity Value
4.1.4 Relative Valuation
In order to complement the valuation aforementioned, the value of JMT was also computed based on what is known as multiples or relative valuation. To do so, it was taken into consideration the peer group retrieved from Thomson Eikon Reuters, 2019, and the multiples EV/EBITDA and EV/Sales.
Based on these values and applying to the acquirer’s data, the results obtained are presented on Table 23.
The multiple Price-to-Sales evaluates the company at its lowest, compared to the remaining multiples. Furthermore, both the EV/EBITDA and EV/Sales multiples return very close figures both to each other and to the value computed on the previous section – Discounted Cash-Flow Model – increasing the firm’s valuation in almost 62% compared to the PS ratio.
Taken into consideration that the firms chosen to form the peer group have different levels of leveraging, for the purpose of this thesis, one will disregard the PS ratio.
25 Valuation (FY+1) EV/EBITDA EV/Sales P-S Company Name x x x Jeronimo Martins SGPS SA 12.56 0.68 0.53 Carrefour SA 7.11 0.32 0.17 Sonae SGPS SA 18.14 0.94 0.30 Tesco PLC 7.18 0.41 0.35 Average 11.25 0.59 0.34 Median 9.87 0.54 0.32
Figure 6 - Jerónimo Martins' Peer Group - Relative Valuation
Jerónimo Martins Price Target (in million Euros)
Normalized EBITDA 2018 964.00 EV/ EBITDA 10,843.01 M€ Net Sales 2018 17,758.61 EV/Sales 10,425.39 M€ Net Sales 2018 19,883.37 Price-to-Sales 6,683.90 M€
Table 23 - Jerónimo Martin's Relative Valuation
4.1.5 Valuation Summary
After computing the firm’s value, one can conclude that both the EV/Sales and EV/EBITDA ratios return very close figures.
Figure 7- Valuation range of Jerónimo Martins' Enterprise Value
When compared to the current market capitalization of Jerónimo Martins (04.08.2019), the DCF Model is actually the closest one to the firm’s current market value of 8,900€ million.
Price-to-Sales 6,683.90€ M EV/EBITDA 10,843.01€ M EV/Sales 10,425.39€ M DCF Model 9,003.29€ M
26
Figure 8 - Valuation range of Jerónimo Martins' Equity Value
4.2 Soriana
4.2.1 Financial Projections
In the same way one estimated the several components that make up the Free Cash Flow to the Firm for Jerónimo Martin, one will also project the financial performance of the Mexican retailer, Soriana.
Being said that, for 2019, the growth rate considered for the Net Sales was simply the growth rate of the net sales from 2012 to 2018, which comes up at 7.35% resulting in the figures presented at Table 24:
Net Sales Explicit Period’s Growth (in million MXN)
2018 2019 2020 2021 2022 2023
Net Sales 153,475.00 164,759.09 176,872.83 189,877.22 203,837.75 218,824.71
Table 24 - Soriana's Net Sales Projections
The ratio of Cost of Goods Sold has been decreasing consistently for the last five years. Therefore, its proportion to sales was forecasted based on the average of the past three. To what the Selling, General and Administrative Expenses is concerned, it’s proportion to Sales were expected to remain similar to what has been observed in the past five years. Consequently, for the purpose of this thesis, one assumed that COGS and SG&A Expenses would grow in proportion to sales by 77.69% and 16.42%, respectively. Tables Table 25 and Table 26 summarize the projections for both expenses:
DCF Model 8,910.09€ M Price-to-Sales 6,590,70€ M Market Cap 8,900.00€ M EV/EBITDA 10,749.81€ M EV/Sales 10,332.19€ M
27
COGS Explicit Period’s Growth (in million MXN)
2018 2019 2020 2021 2022 2023
COGS 119,125.00 128,006.11 137,147.63 147,521.12 158,367.46 170,011.26
Table 25 – Soriana’s Cost of Goods Sold Projections
SG&A Expenses Explicit Period’s Growth (in million MXN)
2018 2019 2020 2021 2022 2023
SG&A 26,282.00 27,050.65 29,039.52 31,174.62 33,466.71 35,927.31
Table 26 – Soriana’s SG&A Projections
Based on the tables previously presented on this section, one was able to compute the projected EBIT as shown at Table 27:
(in million MXN) 2018 2019 2020 2021 2022 2023
(+) Net Sales 153,475.00 164,759.09 176,872.83 189,877.22 203,837.75 218,824.71 (-) COGS 119,125.00 128,006.11 137,147.63 147,521.12 158,367.46 170,011.26 (-) Selling/General/Admin. Expenses 26,282.00 27,050.65 29,039.52 31,174.62 33,466.71 35,927.31
(=) EBIT 8,068 9,702 10,416 11,181 12,004 12,886
Table 27 - Soriana's EBIT Projections
To what the Depreciation and Amortization and Capital Expenditure is concerned, one used the same principles applied to Jerónimo Martins. In other words, to come up with a growth rate for D&A, one calculated the average of the yearly ratio between the net value of Property, Plant and Equipment and depreciations whereas for Capital Expenditure the growth rate was assumed to be based on historical average growth rate of Operating Income. Practically speaking, D&A were forecasted to grow by 4.48% each year whereas Capital Expenditures for 2019 to 2023 were projected based on a 9.03% annual growth rate.
D&A Explicit Period’s Growth (in million MXN)
2018 2019 2020 2021 2022 2023
D&A 2,815.00 2,940.99 3,072.62 3,210.14 3,353.81 3,503.92
28
Capital Expenditures Explicit Period’s Growth (in million MXN)
2018 2019 2020 2021 2022 2023
CapEx -2,651.00 -2,890.33 -3,151.26 -3,435.76 -3,745.93 -4,084.11
Table 29 - Soriana's Capital Expenditures Projections
Contrarily to what one considered on Section 4.1.1 for Jerónimo Martins, the current asset growth rate for the Mexican retailer throughout the last five years was quite volatile. For that reason, a growth rate of 4% was assumed as an alternative. Nonetheless, the same proposition does not hold true for current liabilities – which appear to be somewhat constant through the historical period. Therefore, for that component of Working Capital, one assumed its historical average growth rate as the growth rate for the future, 7.35%.
∆ Working Capital Explicit Period’s Growth (in million MXN)
2018 2019 2020 2021 2022 2023
Current Assets 41,372.00 44,535.51 47,940.91 51,606.71 55,552.81 59,800.65
Current Liabilities 42,062.00 45,154.56 48,474.51 52,038.55 55,864.63 59,972.01
Working Capital -690.00 -619.06 -533.60 -431.84 -311.81 -171.36
∆ Working Capital 0.00 70.94 85.46 101.76 120.02 140.45
29
Combining all the aforementioned figures of each of the elements needed to compute the Free Cash Flow to the Firm, one can compute the Free Cash Flow to the Firm as shown on Table 31 and Figure 9:
Explicit Period Perpetuity Soriana (in million MXN) 2019 2020 2021 2022 2023
Net Sales 164,759 176,873 189,877 203,838 218,825
COGS 128,006 137,418 147,521 158,367 170,011
Gross Profit 36,753 39,455 42,356 47,499 48,813
Gross Margin 22.31% 22.31% 22.31% 22.31% 22.31%
Selling/General/Admin. Expenses, Total 27,051 29,040 31,175 33,467 35,927
SG&A Exp / Sales 16.42% 16.42% 16.42% 16.42% 16.42%
Normalized EBIT 9,702 10,416 11,181 12,004 12,886 Tax Rate 33.70% 33.70% 33.70% 33.70% 33.70% (+) EBI 6,433 6,906 7,413 9,958 8,544 ∆ EBI 20.26% 7.35% 7.35% 7.35% 7.35% (+) D&A 2,941 3,073 3,210 3,354 3,504 ∆ D&A 4.48% 4.48% 4.48% 4.48% 4.48% Current Assets 44,536 47,941 51,607 55,553 59,801 Current Liabilities 45,155 48,475 52,039 55,865 59,972 Working Capital -619 -534 -432 -312 -171 (-) ∆ Working Capital 71 85 102 120 140 (+) Capital Expenditures -2,890 -3,151 -3,436 -3,746 -4,084 ∆ in Capital Expenditures 9.03% 9.03% 9.03% 9.03% 9.03% (=) FCF 6,412 6,741 7,086 7,446 7,823
Table 31 - Soriana's Discounted Cash Flow Valuation Method
Figure 9 - Soriana's Free Cash Flow to the Firm
6 412 6 741 7 086 7 446 7 823 2019 2020 2021 2022 2023 M il li on M X N
30
4.2.2 Weighted-Average Cost of Capital
In order to calculate the weighted-average cost of capital of Soriana, the method previously mentioned at section 4.1.2 was used.
Therefore, one started by computing the Mexican retailer’s cost of debt. To do so, the figures and cost of both short-term and long-term debt were retrieved from Thomson Reuters Eikon, 2019. Through the performance of the calculation, Soriana’s cost of debt was estimated at around 10.27%.
WACC Cost of Debt
Total Debt 22,663,000,000
Capital 132,632,000,000
D/C 15.41%
Annual interest payment 2,328,000,000.00
Net proceeds from issue of debenture or bond 14,229,000,000.00
Kd 10.27%
Table 32 - Soriana's Cost of Debt
Moving forward to deriving the cost of equity, it was necessary to form a peer group. Based on Thomson Reuters Eikon’s peer group suggestion, one reduced the group to the following firms: Grupo Comercial Chedraui SAB de CV, El Puerto De Liverpool SAB De CV, Shanghai Bailian Group Co Ltd and Massmart Holdings Ltd. The original peer group also included Walmart Inc, El Puerto de Liverpool SAB de CV and Wal Mart de Mexico SAB de CV. However, due to the significant difference between Soriana’s EBITDA and Net Sales and each of the aforementioned players, they were disconsidered for the purpose of this thesis on the basis that they were too big and did not quite reflect Soriana’s operation.
The levered betas of the companies which compose the peer group are 0.97, 0.97, 1.20, 1.18 and 1.04, respectively, whereas Soriana’s levered beta comes up at around 0.92.
Considering a risk-free rate of 7.05% and a market risk premium of 7.63%, the cost of equity was determined to be 14.07%.
31
WACC Cost of Equity
Risk-free Rate 7.05%
β 0.92
Market Risk Premium 7.63%
Ke 14.07%
Table 33 - Soriana's Cost of Equity
By applying the ratios of (Gross) Debt-to-Capital (15.41%) and Equity-to-Capital (84.59%), based on 2018’s values and using the same marginal tax rate as for Soriana (33.70%) the WACC was determined to be 12.95%.
Weighted Average Cost of Capital
% Ke 14.07% E/C 84.59% Kd 10.27% 1-t 66.30 D/C 15.41% Wacc 12.95%
Table 34 - Soriana's Weighted Average Cost of Capital Inputs
4.2.3 Discounted Cash-Flow Model
According to what has been exposed on the previous section, Table 35 summarizes all the assumptions made.
DCF Model Assumptions
%
Net Sales Growth Rate 7.35%
COGS Growth Rate 77.69%
SG&A Exp. Growth Rate 16.42%
Perpetual Growth Rate 2.30%
Tax Rate 33.70%
D&A Growth Rate 4.48%
Current Assets Growth Rate 7.65%
Current Liabilities Growth Rate 7.35%
CapEx Growth Rate 9.03%
Table 35- Soriana's DCF Assumptions
The perpetual growth rate assumed was based on IMF’s forecasted growth rate for the Mexican Economy in 2023, 2.30%.
32
By discounting these figures at the WACC rate presented previously, we get to the following present value of the free cash flow to the firm:
PV FCFF (in million MXN)
2019 2020 2021 2022 2023
Present Value of the FCFF 5,677.11 5,284.13 4,917.28 4,574.81 4,255.11
Table 36 - Soriana's Present Value of Free Cash Flows to the Firm
In order to finish the valuation of the firm, one must only calculate the Terminal Value (TV). Applying the same rationale used to compute JMT’s TV, Soriana’s TV adds up to 73,445.67M MXN which discounted to the present moment equals 39,949.51M MXN. Adding that to Soriana’s present value of the FCFF, 24,708.44 million Mexican New Pesos, one gets to a final enterprise value of around 64,657.95M MXN.
4.2.3.1 Equity Value
Ultimately, the equity value will equal the sum of present value of each year’s FCFF and the TV discounted of the firm’s net debt – i.e., 24,708.44, 39,949.51 and 20,434 million Mexico New Pesos, respectively.
Accordingly, one values Soriana’s Equity Value at 44,223.95M MXN.
Equity Value # Shares Outstanding 1,799,880,000 Enterprise Value 64,657.95M MXN Net Debt 20,434M MXN Equity Value 44,223.95M MXN MXN/Share 24.57