Offer price: a contribution to the explanation of the IPO
underpricing puzzle
Rui Soares Calvo
Abstract
The IPO underpricing phenomenon has inspired a significant number of explanatory theories over the last decades. Fascinatingly, one of the variables that would allow an interesting revision of the past literature is, at the same, one of the least studied in this field: the offer price. Thus, this study explores the relation between the offer price and the level of underpricing, its dynamics throughout the IPO cycle and the implication of these findings to prior studies. Based in a univariate, bivariate and multivariate analysis, our conclusions are threefold: (i) there is a positive relation between the offer price and the first day return; (ii) this relation gets stronger in hot IPO markets; (iii) our findings shed certain doubts on the premises and conclusions of some asymmetry of information theories and corroborate the view that IPO underpricing can be seen as an illiquidity premium.
Professor Diana Bonfim Supervisor
Dissertation submitted in partial fulfillment of requirements for the degree of MSc in Business Administration, at Universidade Católica Portuguesa, January 2015.
Acknowledgments
Foremost, I would like to thank Professor Diana Bonfim for her valuable guidance and critical thinking that always pushed me forward. I could not be more grateful to her.
I also like to thank my brother for his unceasing backing and interest during all this process. I am grateful to my father, family and all my friends for the absolute support.
Moreover, I would like to thank my mother for being such an inspiration, for allowing me to study what I love and giving me the opportunity to grow. She always taught me that accomplishment is a consequence of passion, commitment and hard work. This dissertation is, indeed, a result of that.
Finally, I am very grateful to Inês, for all her unconditional affection and support in the countless frustrating moments, which I always overcame with her by my side.
Content
II. Prior Literature ... 3
II.1.Why do companies go public? ... 3
II.2.Underpricing ... 5
II.2.1.Asymmetry of information ... 6
II.2.2.After-market liquidity ... 8
II.2.3.Ownership ... 8
II.2.4.Litigation ... 9
II.2.5.Type of contract and mechanism ... 9
II.2.6.Other theories ... 10
II.3.IPO cycles ... 11
II.4.Offer price ... 12
III. An initial conceptual approach ... 13
IV. Data ... 15
IV.1.Data selection ... 15
IV.2.Measuring hot vs. cold IPO markets ... 17
V. Methodology ... 21
VI. Results and discussion ... 24
VI.1.Univariate analysis ... 24
VI.2.Bivariate analysis ... 26
VI.3.Multivariate analysis ... 26
VI.4.Discussion... 31
VII. Discussion of some issues and robustness analysis ... 36
VIII. Conclusion ... 41
Index of Tables
Table 1- Filtering summary for the dataset ... 16
Table 2- Descriptive statistics ... 20
Table 3- Independent variables ... 23
Table 4- Jarque-Bera statistics ... 25
Table 5- Spearman and Pearson’s correlation coefficients... 27
Table 6- Correlation matrix ... 28
Table 6- Correlation matrix (cont.) ... 29
Table 7- Regression results ... 33
Table 7- Regression results (cont.) ... 34
Table 8- Pearson's correlation coefficient across different sectors and stages of the IPO cycle ... 37
Table 9- Robustness regressions results ... 39
Table 9- Robustness regressions results (cont.) ... 40
Index of Figures
Figure 1- IPO underpricing and offer price through time Figure 2- Offer price relative frequency
I. Introduction
The performance of Initial Public Offerings (IPOs) is, more than ever, at the core of the research agenda in corporate finance: on one hand, in a recent paper Ritter (2014) reflects about the state-of-the-art in this field; on the other hand, the dimension of the recent Alibaba IPO attracted the media attention all around the world. When we analyze IPO dynamics, we encounter one of the most puzzling phenomena in finance: the underpricing. This anomaly was first identified more than 40 years ago by Stoll and Curley (1970) and, since then, enticed a significant number of studies. The existence of a consistent and positive first day return clearly shows that simple misevaluation errors cannot be at the core of its explanation [Ritter and Welch (2002)]. Some authors argue that the binomial risk/return might indicate that ex-ante uncertainty can generate higher first day returns [Loughran and McDonald (2013)]. Additionally, various hypotheses were put forward in the last decades concerning the causes of underpricing. Those can be summarized in four simple categories: asymmetry of information, ownership structure, liquidity and litigation. Nevertheless, the inferences of these prior studies are far from consensus. On top of this, the fact that markets seem to react positively to the existence of underpricing [Nanda and Yun (1997)] while some researchers claim that this anomaly is a result of an efficient process [Lowry and Schwert (2004)] makes this puzzling fact even more intriguing.
Furthermore, Yung et al. (2008) also showed that this first day return follows a cyclical evolution: hot markets are characterized by high levels of underpricing, while in cold markets the opposite applies1. Some find the solution for this second anomaly in the rational behavior of the market agents [Bachmann (2004)], while others give some credit to the “irrational exuberance” hypothesis [Ljungqvist et al. (2006)].
1 Hot IPO markets are described as having unusually high number of offerings, significant underpricing and oversubscription. The opposite applies for cold IPO markets [Helwege and Liang (2004)].
But, after all, one of the most important topics in order to fully understand the IPO underpricing dynamics is, at the same time, at the best of our knowledge, the least studied one: the offer price. Undeniably, this variable plays a major role in the phenomenon: the majority of the theories can be seen on the perspective of the offer price, since, ceteris paribus, different prices imply different levels of liquidity, or even, different types of target investors and informational power [Engle and Lange (1997)], for instance. Therefore, the conclusions of this dissertation will allow a different examination of the theories already provided by the preceding literature. Having all this in mind, this study aims at answering three questions: (i) Is there any relation between the offer price and the underpricing level? (ii) Does this relation still hold in different stages of the IPO/underpricing cycle? (iii) What are the implications of these findings vis a vis prior studies’ premises and its conclusions? In order to tackle these problems, a comprehensive set of data [with some similarities with prior studies, like Bhattacharya et al. (2009)] was collected. Through a univariate, bivariate and multivariate analysis, extensively supported by the work of others [Aggarwal et al. (2002), Booth and Chua (1996), Kennedy et al. (2006), Lowry et al. (2010)], we were able to extract comprehensive and noteworthy conclusions:
(i) The relation between the offer price and the first day return is positive and significant;
(ii) This empirical relation is stronger in hot IPO markets;
(iii) The results allow us to shed certain doubts about some asymmetry of information and liquidity related theories, presented in prior papers.
The remainder of this dissertation is organized as follows. Section II presents a review of prior studies. Section III exposes an initial approach to the research questions. Section IV presents the data. Section V describes the methodology. Section VI presents the main results and respective discussion. Section VII provides a robustness analysis, and Section VIII concludes.
II. Prior Literature
II.1.Why do companies go public?
Ritter (2014) states that, during 2001-2012, only 99 US operating companies went public. This “drought” in the IPO market has its roots in the true nature of the decision of doing an IPO. Ritter and Welch (2002) identify two major groups of theories in this extent: life-cycle and timing theories. The former argues that the decision of being listed comes from the normal course of a company’s life cycle. One of the reasons for this rationale is the fact that, as a company matures, entrepreneurs facilitate the acquisition of their company for higher values when it is publicly traded. The latter debates that the decision of doing an IPO depends on the market conditions. Therefore, entrepreneurs are more disposed to trade their firms in a stock exchange after valuations in the public markets have soared [Ritter and Welch (2002)]. However, research in this field has advanced some interesting hybrid hypothesis [Benninga et al. (2005) is an example of it] showing that theories cannot be subsumed under these two simple categories. Some models agree with the notion of market timing and the hypothesis of growth financing while others find evidence of the role of non-price related strategic decisions.
Companies may go public in a “window of opportunity” [Ritter and Welch (2002, p. 1799)], taking advantage of the over optimism of bull markets and delaying new issues, waiting for more favorable conditions, if the market places a low value to the company. This idea is followed by Yung et al. (2008) that pose that the IPO activity depends on the productivity of capital. Therefore, when positive shocks occur, the higher productivity of capital will generate an increase of the capital demand boosting the new issue’s market. To corroborate this view, Pagano et al. (1998) found evidence that the probability of going public is positively impacted by the market valuations of comparable in the same industry. In addition, the decision of doing an IPO is not strictly an individual decision, but rather a strategic one: at each moment, companies and entrepreneurs will look at the advantages of going public vis a vis the “private benefits” [Benninga et al. (2005, p. 117)]. This decision is not only dynamic, but also reversible (as companies can be reprivatized in the future): there is no
optimal point in time to start being listed. Instead, a continuous and dynamic analysis of the pros and cons will lead to the best solution (at each moment) [Benninga et al. (2005)].
The conventional wisdom presents, as one of the most powerful advantages of going public, the idea that companies need to raise equity to finance new growth opportunities. Interestingly, some studies have showed that the evidence does not support such premise. Pagano et al. (1998) found that companies tend to go public not to finance growth opportunities but, instead, to rebalance their accounts after periods with high investment and growth. Actually, Stoll and Curley (1970) have already presented the theoretical framework that supports this conventional wisdom argument: the “equity gap” [Stoll and Curley (1970, p. 309)]. These authors say that there is an equity gap when small firms cannot take advantage of growth opportunities until the point in which the return on investment equals the marginal costs of the funds used to invest. Even though the existence of this “equity gap” seems to be a good reason to opt to list a company’s stock, Stoll and Curley (1970) showed, more than 40 years ago, that they found no evidence of such explanation. The option of going public can also be a strategic decision non-related with prices or valuation, as Ritter and Welch (2002) claim. They pose that it can be a decision focused on bringing more confidence and faith in the company from other investors, adding value to the firm. Rock (1986) agrees with this strategic view, avowing that it can also be a decision that occurs as a consequence of the risk aversion of the founders, who want to diversify their holdings. To contradict this view, Pagano et al. (1998) presented evidence that portfolio diversification is not a real cause behind the decision of going public by showing that initial owners divest only a small part of their stakes at (and immediately after) the IPO.
The rationale behind the decision of going public is far from consensus. Some theories share common premises but there is no joint ground for a universal defense. However, the evidence, mainly on the IPO cycles, may bring to the center of the research the theories that focus on the notion of “window of opportunity” [Ritter and Welch (2002, p. 1799)].
The literature focuses not only on the reasons to IPO, but also on the mechanism to achieve that goal. And, in this extent, the theory presents an undisputable consensus: the bookbuilding approach is the one commonly used in today’s IPOs and there is a trend for it to increase its relative importance [Nimalendran et al. (2007), Benveniste and Busaba (1997)] at the cost of the fixed price and auction mechanisms. This conclusion is even stronger in the US compared to the UK reality [Chambers and Dimson (2009)]. The three mechanisms (bookbuilding, fixed price and auction ) differ particularly on the offer price definition, and some argue that they have some explanatory power when it comes to IPO underpricing [Benveniste and Busaba (1997)], as it will be exposed further in the text.
II.2.Underpricing
In order to go public companies usually contract external parties (i.e., underwriters) to help them through the process. One of the main responsibilities of the underwriters is to value the company and make sure that they can market the new shares. Roosenboom (2012) argues that investment banks valuate companies based on three models: multiples, discounted cash-flow and dividend discount models. But after this, they impose a discount in the new share’s price generating significant first day returns (i.e., underpricing). The empirical studies to validate the hypothesis of underpricing were first introduced and confirmed, in the US, by Stoll and Curley (1970). More recently Chambers and Dimson (2009) proved that this is a not only a phenomenon of contemporary markets: even before 1970 there is evidence of a soaring underpricing.
This consistent evidence appealed a significant number of researchers on this field. The major concern was to understand the reasons behind this apparent market 2 The main difference between these three methods relies on the price definition and allocation strategy. In the bookbuilding mechanism, the underwriter, or bookrunner, screens the market (through road shows) in order to understand the demand for a specific issue and adjusts the price accordingly. While, in the fixed price mechanism the price is defined and there is no book created. Regarding discretionary allocation, this is a characteristic of the bookbuilding approach. More recently, some authors argue that bookbuilding and fixed price mechanisms are a special case of auctions [Benveniste and Busaba (1997) wrote extensively on this].
anomaly when simple risk premium or fundamentals misevaluation cannot explain such stylized fact [Ritter and Welch (2002)]. Next, it will be presented the most meaningful theories in this extent.
II.2.1.Asymmetry of information
Theories of asymmetry of information are at the core of the reasons for underpricing. Several authors studied the asymmetry of information hypothesis between different type of investors [Rock (1986), Welch (1992)], the issuer and the investors [Benveniste and Busaba (1997), Bachmann (2004), Chemmanur (1993)] or even between the issuer and the underwriter [Baron (1982)].
Rock (1986) avows that there are two types of investors: informed investors and uninformed investors. The asymmetry of information between these types of investors leads the company to issue shares at a lower price than the fair value in order to attract non-informed investors. Otherwise, the informed investors would only take part in high quality operations and the uninformed would face a “lemon problem”. This option has gathered some consensus as Chambers and Dimson (2009) provided evidences that Rock’s “winner’s curse” was intensified after the World War II and Levis (1990) corroborated and complemented Rock’s theory by introducing the notion of opportunity costs. However, some authors contradict the findings of Rock (1986). For instance, Hanley and Wilhelm Jr (1995) state that informed (identified as institutional) investors’ favorable position in underpriced operation has an underlying expectation. There is the quid pro quo expectation that they will also take part in less attractive (i.e., overpriced) operations [Rock (1986) has not addressed this opportunity cost]. Some others agree with Rock’s argument but disagree with the conflict between informed and uninformed investors. For example, Welch (1992) argues that the asymmetry of information is between early and late stage investors: issuers and banks have the incentive to signal early investors with lower prices in order to attract late investors (that due to the “herd behavior” [Welch (1992, p. 724)] effect are willing to forget their private information). This “cascade effect” [Welch (1992, p. 696)] will ultimately generate underpricing.
Moreover, the asymmetry of information between bank/issuer and investors can also have a role in underpricing, even though some authors disagree in the relative level of information of the agents: some believe that issuers/banks have superiority [Benveniste et al. (1996), Bachmann (2004), Chemmanur (1993)], others argue that investors have better information since they form the market [Ritter and Welch (2002)]. Sometimes, the issuer/underwriters’ information is more valuable: Benveniste et al. (1996) claim that underwriters have incentives to overstate investors interest in order to convince other investors to buy the shares at the offer price (this incentive can only be destroyed with the existence of price stabilization mechanisms in the after-market); Bachmann (2004) says that higher value companies signal their quality by underpricing their offers and marketing them with prestigious underwriters [Carter and Manaster (1990)]; while Chemmanur (1993) argues that underpricing is a question of information asymmetry between the issuer and external investors - high value companies have the incentive, through underpricing, to induce external investors to produce information about the company (as they will benefit from high value shares in the after-market). Ritter and Welch (2002) argue that underpricing is also a result of the private information investors have: they show evidence that banks have to underprice the new issues in order to incentivize investors to tell the truth about their willingness to purchase the shares at a certain price. This view is known as the “bookbuilding theory” [Ritter and Welch (2002, p. 1811)].
Last but not least, banks also take advantage of their informational superiority vis a
vis the issuers [Baron (1982)]. This informational advantage lies on the reasons why
issuers do not mind leaving money on the table: by underpricing the shares, issuers give incentives to underwriters to allocate future hot IPOs [Loughran and Ritter (2002) and later corroborated by Nimalendran et al. (2007)]. Besides this, Baron (1982) also argues that the underpricing may be an indirect remuneration for the use of the underwriters private information in the definition of the offer price, mainly when the issuer has a significant amount of uncertainty.
II.2.2.After-market liquidity
Regarding the after-market dynamics and its contribution to the first day return, there are two main views. Boehmer and Fishe (2001) pose that banks have an incentive to increase after-market trading (collecting trading commission revenues) when defining the offer price for an IPO. Therefore, banks are willing to leave more money left on the table when they are able to generate more after-market liquidity. This conclusion was, later, corroborated by Nimalendran et al. (2007) and agrees with the one presented by Booth and Chua (1996) .
Ellul and Pagano (2006) have a rather opposite view, arguing that the IPO underpricing should be larger when there is less liquidity in the after-market.
II.2.3.Ownership
The way shareholders manage their ownership in companies that go through an IPO can also help to explain the underpricing phenomenon. After analyzing the role of after-market liquidity in the underpricing, Booth and Chua (1996) also studied the connection between after-market liquidity and ownership. They argue that one reason for the high first day return is the existence of oversubscription. This oversubscription would generate higher ownership dispersion that would increase after-market liquidity and information costs. The result would be higher levels of underpricing. Besides Booth and Chua (1996), Habib and Ljungqvist (2001) explained that entrepreneurs do mind leaving money on the table when they are selling a major bulk of shares. When there is no divestment [and this follows the evidence of Pagano et al. (1998)] the level of underpricing that could be borne by the entrepreneurs increase. Indeed, Kennedy et al. (2006) found evidence that supported this theory of “entrepreneurial wealth loss”. They also showed support for a similar theory presented by Aggarwal et al. (2002) which claim that managers have incentives to underprice the shares because they cannot divest immediately after the IPO. Instead, managers tend to only sell their shares after the lock up expiration period. Therefore, they have enticement to underprice their shares and benefit from
a momentum reaction that could allow them to sell the shares at a higher value at the end of the lock up period.
II.2.4.Litigation
Tinic (1988) presented a breaking through explanation for underpricing: it is a result of the willingness of the bankers to reduce the risk of litigation. This theory does not oppose to some of the other views on the subject, being complementary with Rock's (1986) opinion on information production or the rent seeking behavior of Boehmer and Fishe (2001). Tinic (1988) states that the supposed advantages of issuing an overpriced IPO would be wiped out by the legal liabilities and risk premium investors would require in future operations. Indeed, the process of due diligence in the case of an unseasoned new issue is characterized by a significant level of information opacity. The litigation theory also assumes that insurance against this risk would not solve the underpricing phenomenon since the moral hazard would give incentives to underwriters (and issuers) to shirk in their valuation responsibilities.
II.2.5.Type of contract and mechanism
As it was already mentioned, the bookbuilding approach to market an IPO is the most common mechanism, followed by the fixed price instrument [Nimalendran et al. (2007)]. Benveniste and Busaba (1997) conclude that different mechanisms have impact on the overall level of underpricing. According to these authors, the fixed price method can generate a “cascading demand” [in the sense of Ritter and Welch (2002)]. On the contrary, the bookbuilding approach does not generate a “cascading demand” but underwriters tend to underprice the issues in order to persuade investors to reveal their true intentions regarding the offer price [this argument has its basis on Ritter and Welch (2002)]. Although the two methods imply costs, the authors found evidence that the underpricing for the fixed price mechanism is higher than the one that is generally verified in bookbuilding approaches.
IPOs can also be issued in two different ways: best effort and firm commitment contracts3. In the literature, several authors have found consistent evidence that underpricing is higher in the best effort contracts [Booth and Chua (1996)]. The main reason for this evidence is that the reaction of the market to the underwriters reputation, the costs of dispersion and after-market liquidity depend on the type of contract [Booth and Chua (1996)].
II.2.6.Other theories
The theories presented so far are the main arguments used to understand the underpricing phenomenon. In any case, there are other two theories that made strong developments in this field and that cannot be easily allocated to any of the previous sub-sections.
Stoll and Curley (1970), besides identifying the first day return evidence, advanced with an explanation for it. According to these authors, intelligent investors would expect this “unwarranted” [Stoll and Curley (1970, p. 321)] rise in the prices to happen and would, most likely, short sell those shares, preventing the prices to increase. However, investors may not be able to do short selling operations, mainly due to the “fear of short squeeze” [Stoll and Curley (1970, p. 321)] and the difficulty in borrowing shares. This argument has its fundamentals in the market mechanisms and shows how an anomaly like underpricing can persist during time.
More recently, Liu and Ritter (2011) also put forward a theory of underpricing linking it to competition. Indeed, the underwriters markets is not a perfect competition market but, instead, a series of “local oligopolies” [Liu and Ritter (2011, p. 580)]. According to them, banks do not compete among themselves (if they did, as issuers would screen the market for the best proposal, the amount of money left on the table would have incentive to decrease) because they do not offer an homogeneous service: it is normal to guarantee some local specialization. On top of this, Liu and Ritter (2011) also argue that companies that are backed by Venture
3 The distinction between the two mechanisms is not at the core of the present thesis discussion. In any case, Rock (1986) wrote extensively on that.
Capital firms (VCs) are more likely to underprice: VCs want to have higher prices when the shares are distributed to limited partners (short to medium term). This means that VCs will want to have their IPO firms covered by “all-star analysts” [Liu and Ritter (2011, p. 580)] which, according to the authors, would boost the stock prices. This theory found empirical evidence to support its main conclusions.
II.3.IPO cycles
Related to the underpricing anomaly is the existence of IPO and underpricing cycles. Loughran and Ritter (2002) found evidence that the first order autocorrelation of the first day return was positive and significant. They also put forward the idea that underpricing cycles will occur as long as bookbuilding mechanism is used: mainly because the adjustment of the price is just partial and consequentially the autocorrelation of issues whose preselling periods overlap will be positive.
Ritter and Welch (2002) and Yung et al. (2008) worried about the classification of the cycles. Their studies have a common conclusion: in hot IPO markets the quality of the companies going public deteriorates (and this is followed by a greater dispersion of the quality of the firms). Indeed, Yung et al. (2008) argue that this evidence is one of the reasons why IPOs and underpricing follow similar cycles: as the dispersion of the quality of the firms is higher, the asymmetry of information will increase and this would have a positive impact on the level of underpricing.
But a puzzling fact remains: why, in hot IPO markets, companies do not get more aggressive when setting the price (thus reducing the underpricing)? For Ljungqvist et al. (2006) the answer lies on the “irrational exuberance” [Ljungqvist et al. (2006, p. 1669)] of the investors. They argue that underwriters allocate shares to “regular investors” (i.e. institutional investors) [Ljungqvist et al. (2006, p. 1669)] that afterwards will sell the shares to sentiment investors. This is a way of maximizing the value to the issuer and there has to be a compensation for the risk borne by the institutional investors: that compensation is the underpricing. However, not everyone agrees on this irrational approach to the problem. Bachmann (2004), for instance, states that some investors only learn about the IPO market by observing
past IPOs. When these investors enter the market, the rational equilibrium becomes dynamic, generating cycles. This follows the idea of Aggarwal et al. (2002) that relates the existence of cycles to the information momentum: when the information momentum is high enough, the demand curve of a new issue tends to shift upwards. Alti (2005) goes even further suggesting that the market timing is an equilibrium outcome. He argues that there are “information spillovers” [Alti (2005, p. 1105)] that make some private information be revealed when the first IPOs are made. Afterwards, this externality would generate lower levels of uncertainty and increase the companies’ willingness to go public. They all agree that underpricing cycles can be a rational equilibrium outcome.
Benninga et al. (2005) presented a possible explanation for this cyclical activity: it could happen that hot markets coincide with higher investment opportunities or higher cash flows. The first hypothesis was already discussed in the work of Pagano et al. (1998). Nevertheless, Benninga et al. (2005) found evidence that companies tend to do IPOs in times with relatively higher cash flows (that coincide with hot markets).
II.4.Offer price
The relation between the offer price and the underpricing has generated little interest in previous studies. At the best of our knowledge, Tinic (1988) was the only author who directly mentioned the expected connection between these two variables. He states that shares with lower values will have higher spread in the after-market, which will imply higher post-offering returns. Therefore, one would expect a negative correlation between underpricing and the offer price, even though his conclusion was not statistically significant.
Besides this contribution, there are also some authors that indirectly studied the relation between these two variables. Analyzing the after-market theories [Ellul and Pagano (2006), Booth and Chua (1996)] and assuming that, ceteris paribus, high
value shares are relatively more illiquid in the after-market4, some conclusions can be drawn out.
Ellul and Pagano (2006) argue that higher price shares would require higher underpricing. This theory sees underpricing as an illiquidity premium: more illiquid shares will tend to have higher underpricing.
Booth and Chua (1996) claim the opposite result. They consider that if the information costs and the number of shares are fixed, then the offer price should be a good proxy of the after-market liquidity cost. They also found evidence that the more liquid the share is (and therefore, the lower the offer price) the higher the underpricing. On the opposite, when share prices increase, underpricing tends to decrease (and this evidence is stronger in best effort contracts).
“The solution to the underpricing puzzle has to lie in focusing on the setting of the offer price” [Ritter and Welch (2002, p. 1803)]. In any case, the analysis of the offer price continues to be an understudied topic in the literature.
III. An initial conceptual approach
An initial approach to understand the relation between the underpricing and the offer price consists in modeling the first day return in a demand/supply approach [in a similar way to the work of Aggarwal et al. (2002)]. For that, it will be analyzed the evolution of the market equilibrium in two stages: stage 0, at the issue, and stage 1, at the end of the first trading day.
At stage 0, investors have a demand curve that can be modeled by equation (1). A and B are parameters that define the interception and the slope of the demand curve, respectively. Assuming that, in the bookbuilding approach , the underwriters can capture and record the demand curve, they are able to define the offer price P0 simultaneously to the quantity, Q0.
4 Excluding the microcap stocks that present lower values but high bid-ask spread in the after-market [Liu et al. (2012)].
(1) 𝑃 = 𝐴0− 𝐵0∗ 𝑄 ⇔ 𝑃0 = 𝐴0− 𝐵0∗ 𝑄0
At the end of the first trading day, a new supply curve emerges, modeled in equation (2). At the same time, the demand curve might change its parameters (A and β) vis a
vis stage 0, as equations (3) expresses. (2) 𝑃 = 𝐴1+ 𝐵1∗ 𝑄
(3) 𝑃 = 𝐴2− 𝐵2∗ 𝑄
The market will reach an equilibrium price at each stage. From the interception of the previous function we can define the offer price, P0, and the final price of the first day trade, P1. If we measure the underpricing, U, as a first day return, the level of underpricing can be collected under equation (4).
(4) 𝑈 =𝑃1−𝑃0
𝑃0 =
𝐴2∗𝐵1+𝐴1∗𝐵2
𝐵1+𝐵2 −(𝐴0−𝐵0∗𝑄0)
𝐴0−𝐵0∗𝑄0
In order to understand the impact of the offer price, P0, on the level of underpricing, U, we can derive U in order to P0. However, as underwriters define the price simultaneously with the quantity (meaning that firstly they are able to identify the demand curve at stage 0), the result can also be obtained by analyzing the impact of the quantity, Q0 , on the level of underpricing, U [equation (5)].
(5) 𝜕𝑈
𝜕𝑄0=
𝐴2∗𝐵1∗𝐵0+𝐴1∗𝐵2∗𝐵0 [𝐴0−𝐵0∗𝑄0]2
Analyzing equation (5), we can take two major conclusions. On one hand, we cannot conclude about the impact of the offer price on the level of underpricing. The impact can be positive, negative or even inexistent: it all depends on the numerator (as the denominator is always non negative). Therefore, an empirical analysis on the underpricing dynamics will be required to tackle the main research questions
6 Assuming that the price elasticity (ε) of the demand curve in stage 0 is not equal to 0 (perfectly inelastic) nor equal to ∞ (perfectly elastic), by understanding the signal of the relation between 𝑄0
and 𝑈, we will be able to infer the signal of the relation between 𝑃0 and 𝑈. This inference can only
be made in terms of signals and not in terms of the absolute values of the derivative (with the exception of the demand curve with a unitary slope).
presented earlier. On the other hand, equation (5) allows us to understand the significant role that the offer price plays in the first day return puzzle. As showed previously, prior studies have focused on the dynamics that change the demand and the supply curve in stage 0 to stage 1 [after-market liquidity theories of Booth and Chua (1996) and Ellul and Pagano (2006) are examples of it]; the reasons that underlie the demand curve framework in stage 0 [namely the asymmetry of information theories]; and the reasons to define the price P0 and the quantity Q0 [Tinic (1988) litigation argument, for instance]. Indeed, in here lie the most important implications of this dissertation: understanding the connection between the offer price and the underpricing level will allow a critical analysis of all theories that can be summarized in equation (5). Against this background, the empirical analysis will be exposed in the next sections.
IV. Data
IV.1.Data selection
The IPO data was retrieved from Thomson ONE Banker and matches the one in Thomson Security Data Company (SDC)7 used by several authors [like Bhattacharya et al. (2009), Habib and Ljungqvist (2001), Kennedy et al. (2006), Loughran and Ritter (2002), and Yung et al. (2008)].
We included every equity deal flagged as IPO from 1970 to 2014. Following the approach of prior studies [for example, Loughran and Ritter (2002)], we excluded from the sample Real Estate Investment Trusts; Closed-end Funds; Unit Investment; Depositary Issues and Limited Partnerships. All in all, the sample included 11,976 IPOs with information about the offer price, shares offered, final first trading day price, underwriters, inside trading, operation date, VC backed indicator, mid-filling price range and issuer SIC code (even though not every deal had a complete set of variables available).
7 Thomson ONE Banker’s data was formerly collected by Securities Data Corporation and accessed through SDC.
The underwriters’ prestige rank and the Internet IPO indicator8 were collected from Ritter’s Website9 and matched with the extracted list of IPO data. Moreover, the market return was retrieved from Bloomberg, using a North American [as presented in Kennedy et al. (2006)] and Equity [as advised by Chambers and Dimson (2009)] index: S&P 500.
Due to the deficient data in some observations, adjustments had to be made in order to reach a comprehensive set of data. These adjustments are identified in Table 1.
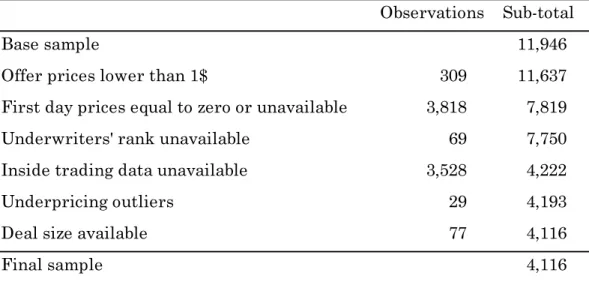
Table 1- Filtering summary for the dataset
Identifies the number of observations excluded from the initial dataset and the sub-total for each criteria. It is presented in a sequential way: each criterion (line) is tested against the sub-total that resulted from the previous criteria.
Regarding the offer price, we also omitted micro-cap issues with an offer price per share lower than 1$ [following Booth and Chua (1996), but being more permissive than Loughran and Ritter (2002)10]. On top of this, the lack of records for some data implied the exclusion of the observations: a significant number of observations (mainly the least recent and the ones with higher offer prices) had no record in what
8 Internet IPO indicator (i.e., a dummy variable to indicate if the IPO concerns an internet company) was matched by SIC code.
9 Available at http://bear.warrington.ufl.edu/ritter/ipodata.htm
10 Kennedy et al. (2006) exclude all the issues with an offer price lower than 5$, and Loughran and Ritter (2002) set the price at 8$. As the purpose of the present thesis is to understand the impact of the offer price in underpricing, setting a minimum value too high would generate biased results, by limiting the lower value of the offer price spectrum.
Observations Sub-total
Base sample 11,946
Offer prices lower than 1$ 309 11,637
First day prices equal to zero or unavailable 3,818 7,819 Underwriters' rank unavailable 69 7,750 Inside trading data unavailable 3,528 4,222
Underpricing outliers 29 4,193
Deal size available 77 4,116
first day return and stake of inside ownership are concerned, and for this reason they were left out of our study. We similarly excluded from the initial sample the observations identified as outliers, which could have emerged from misevaluations or currency translation errors. This includes all operations with underpricing lower than -88% or higher than 363%11.
IV.2.Measuring hot vs. cold IPO Markets
To identify the existence of hot or cold IPO markets we used a similar approach to Yung et al. (2008). Therefore, we divided the years12 in three categories: “hot”, “cold” and “normal”. If the average of the underpricing in a year is at least 25% greater than the total historical average, then it is identified as a “hot” IPO year. On the opposite, if the year’s average underpricing is at least 25% lower than the historical average, then, it is identified as a “cold” IPO year. All the years in which the average underpricing relative to the historical average is between 75% and 125% are identified as “normal” markets.
This approach will allow us to understand the impact of the IPO cycles in the underpricing dynamics. It diverges from the measurement advocated by Aggarwal et al. (2002) that identified an IPO as hot or cold due to its specific underpricing (not taking into consideration the role of the underpricing of other IPOs in the same moment of time).
Figure 1 presents the evolution of the underpricing over time and the thresholds used to identify cold or hot IPO markets. One can easily identify the “dot com” bubble and its impact on the IPO underpricing and the low level of the first day return that has characterized the last decade [and that follows the evidence presented in Ritter (2014)]. However, the relationship between the offer price and
11 This follows the underpricing range of Booth and Chua (1996) for the 1977-1988 period. More recent papers indicate a lower range for the first day return in the last decades [Bhattacharya et al. (2009)].
12 Differs slightly from Yung et al. (2008) as they divide issuance quarters, not years, into the three categories. The lack of information for some quarters, and the need to have a broader view of IPO cycles, justify our approach to use a less detailed time span to split IPO markets.
the IPO cycle dynamics is not perfectly identifiable. Therefore, a more thorough analysis of the data is required.
Figure 1- IPO underpricing and offer price through time
This figure presents the average underpricing level (right axis) and the average offer price, in USD, (left axis), for each year. The inexistence of observations in 2009 is associated with an offer price of 0 and underpricing of 0%. The full lines indicate the threshold to define each year as hot, cold or normal in terms of new issues underpricing as defined in the subsection IV.2.
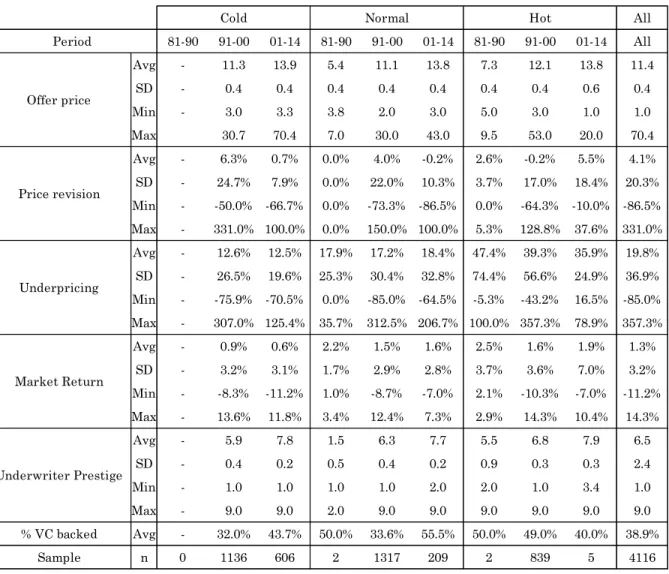
IV.3.Descriptive statistics
Descriptive statistics are summarized in Table 2. Regarding the sample, one can highlight the fact that the big bulk of IPOs collected in this study concerns the 1991-2000 period. Besides this, the majority of the IPOs took place in cold and normal markets, being the hot IPO markets an exception, particularly since the beginning of the new millennium [follows Ritter (2014)]. Moreover, the very few observations for IPOs before 1991, make conclusions about the 80’s dynamics in terms of new issues frail in significance13.
The least studied topic and the main purpose of this thesis regards the dynamics of the offer price. With a similar dispersion over the several sub-samples, once the underpricing increases, there seems to be a slight upturn in the offer price. This conclusion is, however, limited when comparing cold to hot IPO markets. On top of 13 This lack of data in the 80’s period comes as a result of (i) a lower number of deals available and (ii) some deficient data reported that implied more exclusion on the filtering criteria of Table 1.
this, the evolution of the underpricing over time has not presented a very significant change in cold and normal markets. Nonetheless, as stated by Loughran and Ritter (2004), after the 1999-2000 bubble, the level of underpricing decreased. This evolution is particularly plain in hot markets. Moreover, the variability of the underpricing tends also to increase as the underpricing increases: the high variability of this variable in hot IPO markets corroborates the empirical evidence found in Lowry et al. (2010). Interestingly, the highest range of underpricing values occurs in cold markets (mainly before the IPO bubble). On the opposite, the positive relation between price revision and underpricing, advocated by Loughran and McDonald (2013), seems to find no empirical support in our data. Indeed, the average price revision in the hot IPO years from 1991 to 2000 is not significantly different than zero14. Additionally, even in strong hot IPO years, the price revision can be extremely negative (e.g. minimum price revision value in hot issue in 1991-2000). Once again, cold markets present a high range of price revision presenting higher dispersion of the observations.
Carter and Manaster (1990) argue that there is a negative connection between the underwriter’s prestige and the level of underpricing (since it is a way of diminishing the ex-ante uncertainty about the issue). However, the data presented in Table 2 seems not to support significantly this conclusion: analyzing the period 1990-2001, the average ranking of the main bookrunner slightly increases as the underpricing growths. The data corroborates the fact that issuers tend to hire prestigious investment banks but the connection between this and the underpricing seems to be, surprisingly, not very notorious. It is also noteworthy the fact that the ranking range tends to persist over time. Regarding VC backed IPOs, the evidence seems to support the idea of market timing [Alti (2005)] and the strategy of VC funds to use the market momentum to increase the value of their possible asset sale [Liu and Ritter (2011)]: as the underpricing grows, VC backed IPOs tend to increase its relative weight.
All in all, the simple analysis of descriptive statistics will not be enough to shed light on this study’s main purpose.
Table 2- Descriptive statistics
The data was divided in terms of cycles (hot, cold or normal markets) but also in terms of periods (1981-1990; 1991-2000; 2001-2014). Even though the initial sample contained data from 1970-1980, the existence of filters presented in Table 1 excluded such observations from the analysis. Offer price is the offer price, in USD, at the IPO. Price revision is the variation of the offer price vis a vis the initial mid-price filling range. Underpricing is measured as the first day return. Market return is the lagged 30 days S&P500 return. Underwriter’s prestige was collected from Ritter’s website and ranges from 1 to 9 (higher ranking). It is presented the average (“Avg”), standard deviation (“SD”), minimum (“Min”) and maximum (“Max”) for each category. In the case of the offer price and underwriter’s prestige, the standard deviation is presented as a variation coefficient (SD/Avg).
All 81-90 91-00 01-14 81-90 91-00 01-14 81-90 91-00 01-14 All Avg - 11.3 13.9 5.4 11.1 13.8 7.3 12.1 13.8 11.4 SD - 0.4 0.4 0.4 0.4 0.4 0.4 0.4 0.6 0.4 Min - 3.0 3.3 3.8 2.0 3.0 5.0 3.0 1.0 1.0 Max 30.7 70.4 7.0 30.0 43.0 9.5 53.0 20.0 70.4 Avg - 6.3% 0.7% 0.0% 4.0% -0.2% 2.6% -0.2% 5.5% 4.1% SD - 24.7% 7.9% 0.0% 22.0% 10.3% 3.7% 17.0% 18.4% 20.3% Min - -50.0% -66.7% 0.0% -73.3% -86.5% 0.0% -64.3% -10.0% -86.5% Max - 331.0% 100.0% 0.0% 150.0% 100.0% 5.3% 128.8% 37.6% 331.0% Avg - 12.6% 12.5% 17.9% 17.2% 18.4% 47.4% 39.3% 35.9% 19.8% SD - 26.5% 19.6% 25.3% 30.4% 32.8% 74.4% 56.6% 24.9% 36.9% Min - -75.9% -70.5% 0.0% -85.0% -64.5% -5.3% -43.2% 16.5% -85.0% Max - 307.0% 125.4% 35.7% 312.5% 206.7% 100.0% 357.3% 78.9% 357.3% Avg - 0.9% 0.6% 2.2% 1.5% 1.6% 2.5% 1.6% 1.9% 1.3% SD - 3.2% 3.1% 1.7% 2.9% 2.8% 3.7% 3.6% 7.0% 3.2% Min - -8.3% -11.2% 1.0% -8.7% -7.0% 2.1% -10.3% -7.0% -11.2% Max - 13.6% 11.8% 3.4% 12.4% 7.3% 2.9% 14.3% 10.4% 14.3% Avg - 5.9 7.8 1.5 6.3 7.7 5.5 6.8 7.9 6.5 SD - 0.4 0.2 0.5 0.4 0.2 0.9 0.3 0.3 2.4 Min - 1.0 1.0 1.0 1.0 2.0 2.0 1.0 3.4 1.0 Max - 9.0 9.0 2.0 9.0 9.0 9.0 9.0 9.0 9.0 % VC backed Avg - 32.0% 43.7% 50.0% 33.6% 55.5% 50.0% 49.0% 40.0% 38.9% Sample n 0 1136 606 2 1317 209 2 839 5 4116 Period Offer price Price revision Underpricing Market Return Underwriter Prestige
V. Methodology
The methodology of this thesis will comprise three layers of approach: univariate, bivariate and multivariate analysis on the offer price issue.
Firstly, for each offer price it will be computed its relative frequency and, afterwards, understand if it follows a specific distribution (namely, a normal distribution, using Jarque-Bera test). A similar approach will be done for hot and cold years, allowing comparisons about the offer price spectrum and frequency within the dynamics of IPO cycles. After this univariate response to the main research questions, there is the need to tackle this thesis foremost problem by understanding the relation between two core variables: offer price and level of underpricing [following similar approaches, for example Loughran and Ritter (2004), the underpricing will be assumed as the first day return15]. This correlation can be computed through the
Pearson’s correlation coefficient (if there is bivariate normality) or through a more robust coefficient that does not require a specific distribution (for instance, Spearman’s correlation coefficient16). These correlation coefficients will be computed
and its significance tested, throughout the IPO cycle.
Afterwards, a regression analysis will try to corroborate the results presented from the previous approaches. Regarding this multivariate method, there will be no test of a new regression or variable to explain underpricing (as it is not the purpose of this study). Instead, the contribution of former papers will give a valuable input to the analysis. In this extent, Aggarwal et al. (2002), Booth and Chua (1996), Kennedy et al. (2006), Lowry et al. (2010) explicative regressions of the underpricing phenomenon will be used as benchmark, as they include, at the best of our knowledge, the most comprehensive set of explanatory variables. Some of these
15 It is measured as the relative variation of the closing price of the first day of trading and the offer price at the day of the IPO.
16 If the test for normality for the offer price in the univariate analysis of our methodological approach rejects the null hypothesis, then there is the violation of one of Pearson’s assumptions, and a more robust method (like Spearman) would yield more meaningful conclusions. The Spearman’s coefficient, ρ, will be computed as 𝜌 = 1 −6 ∑ 𝑑𝑖2
(𝑛3−𝑛) , where di is the difference between ranks (in ascending order) and n is the number of
regressions, however, are designed to present a very detailed test to specific theories or hypothesis, thus relying on very particular datasets over a precise topic. Therefore, in this study, an adaptation of the original regressions will need to take place since not every variable is available in the dataset presented in Section IV (meaning that some variables were excluded from the original models). Table 3 presents a summary of all the variables used on this analysis and the paper in which they were based.
The variables presented can be encapsulated in 5 groups: price related variables (price revision measures and offer price value); offer size indicators (both proceeds and number of shares sold at the IPO); impact of inside agents (inside trading) and external agents (prestige and number of underwriters) on the IPO event; variables that aim at identifying market intensity and returns; and some dummy variables (as the case of VC and Internet dummies).
The adjustments relatively to the original papers deserve some careful analysis. Booth and Chua (1996) study the offer size as an independent variable in their regression. However, in their study, this offer size is expressed in terms of 1994 purchase power. In order to ensure some comparability between the results of the several regressions, this variable is measured in current prices. Moreover, the way to measure the underwriter’s prestige is also heterogeneous among the different papers: Aggarwal et al. (2002) and Booth and Chua (1996) develop their own regressions17 to estimate the ranking of each investment bank, while Lowry et al.
(2010) rely on the work of previous studies. In this thesis, the methodology used to expressed the underwriter’s ranking follows the one on Kennedy et al. (2006): as explained in Section IV, the ranking was retrieved from Ritter’s website and matched with the existing dataset. Once again, at the expense of changing the studies premise, we will be able to safeguard comparability between the results, while preserving the conceptual purpose of each independent variable.
Table 3- Independent variables
Identifies the independent variables used in the regressions, its description and the original study in which they were stated.
Variable Description Authors
LN(SIZE) Natural log of the total offer size, measured as the number of shares offered at the IPO multiplied by the respective offer price, in Million USD.
Booth and Chua Aggarwall et al Kennedy et al PREST Prestige ranking of the main underwriter/bookrunner as
defined in Ritter's website, accroding to the "Data" section. It is assigned the top ranking of 9 in a scale of 0-9. The ranking corresponds to an average of the sub-periods rankings as provided by Ritter.
Booth and Chua Aggarwall et al Lowry et al Kennedy et al INT IPO intensity measured as the number of IPOs in the three
months preceding the IPO. Booth and Chua
IND.INT IPO industry intensity measured as the number of IPOs in the same industry and in the year preceding the IPO.
Booth and Chua INTERNET Internet IPO indicator, that takes the value of 1 in the
affirmative case and 0 otherwise. Aggarwal et al VC Venture Capital backed indicator, that takes the value of 1 in
the affirmative case and 0 otherwise.
Aggarwal et al Lowry et al CO-MANA. Numberof lead, co-lead and co-managers at the IPO. Aggarwal et al
Kennedy et al INSIDE Percentage of inside holdings measured as the number of
voting shares after the IPO operation in the possession of managers, relative to the over all number of shares.
Kennedy et al
IN_SALE Percentage of the manager's stake on the companies equity
sold at the IPO date. Kennedy et al
RET_15 Return on the S&P 500 for the 15 days preceding the IPO,
expressed as percent. Kennedy et al
PRICE_REV Variation of the offer price in relation to the midpoint of the
initial price filling range, expressed as percent. Kennedy et al POS_REV Indicator variable that takes the value of 1 if the offer price
revision constitutes a positive variation to the midpoint of the inital price filling range and 0 otherwise.
Kennedy et al
LN(SHARES) Natural log of the total number of shares offered at the IPO
(includes primary and secondary shares). Lowry et al |PRICE_REV| Absolute value of the variation of the offer price in relation to
the midpoint of the initial price filling range, expressed as percent.
Lowry et al
-Nevertheless, these regressions try to explain the level of underpricing with a diversified set of variables that do not include any offer price related measure18. The
next step in this multivariate approach will, hence, be the inclusion of the offer price variable (identified as “OPRICE”) in the several regressions. This will allow two interesting inquiries: (i) understand the significance of the offer price coefficient in the various models; (ii) test if there is an improvement on the overall explanatory power of the regression19.
By replicating this methodology for hot vis a vis cold IPO markets, one will be able to take conclusions about the loss or gain of explanatory power of the offer price variable on the overall level of underpricing throughout the IPO cycle.
VI. Results and discussion
VI.1.Univariate analysis
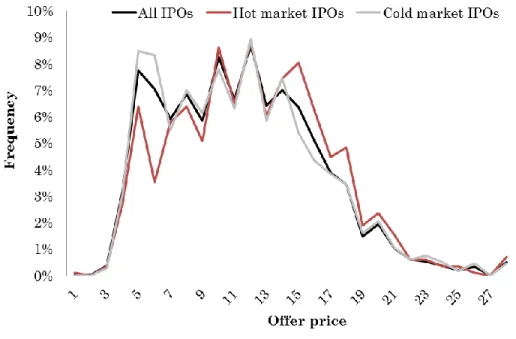
Figure 2 presents the offer price relative frequency of the entire IPO sample and some sub-samples. In general terms, the value of the offer price tends to be small (as around 80% of the entire offer price sample present values lower than 15$ and there is a minor number of maximum outliers, higher than 27$, for both sample and sub-sample). Regarding this univariate approach, one can take major conclusions about two issues: (i) offer price distribution; and (ii) IPO cycles dynamics.
Testing the normality of the distribution of the offer price, using Jarque-Bera test, for the entire sample and sub-samples, we can reject the null hypothesis with a p-value of 0.00 (Table 4). Therefore, as we cannot ensure normality, further analysis must assume that the assumption of offer price normality is not being fulfilled.
18 Booth and Chua (1996) are an exception as they include the logarithm of the offer price as an independent variable on their original regression, even though it was not the main purpose of their study. They have found a significant and negative coefficient.
19 This will be done by analyzing the value of the (i) adjusted R squared and (ii) Akaike information criterion. As we are trying to improve the regression by introducing more variables, the adjusted R squared will give a non-biased and more accurate measure of the performance of the regression. The Akaike information criterion (AIC) will be computed as 𝐴𝐼𝐶 = 𝑛 ∗ ln (𝑆𝑆 𝑅𝑒𝑠𝑖𝑑𝑢𝑎𝑙𝑠
𝑛 ) + 2 ∗ (𝑘 + 1), where n is the number of observations, SS Residuals is the residuals sum of squares, and k is the number of parameters.
Figure 2- Offer price relative frequency
This figure presents the relative frequency of the offer price variable, in USD, for three sections: (i) the entire dataset sample, identified as “All IPOs”; (ii) sub-sample that includes the hot market IPOs, identified as “Hot market IPOs”; (ii) sub-sample that includes the cold market IPOs, identified as “Cold market IPOs”.
Table 4- Jarque-Bera statistics
Shows the Jarque-Bera statistics and the p-value for the sample and two sub-samples.
The rejection of the null hypothesis of the normality test comes with no surprise. Indeed, the graph shows that the distribution tends to be skewed to the right and this feature seems to be impacted by the market cycle (as showed in Figure 2). Hot markets, while presenting a similar distribution, have a tendency to assume higher offer price values when compared with the overall sample. The symmetric conclusion can be taken for cold IPO markets: the relative frequency of lower values is higher than the one verified in the entire sample (and particularly in the hot IPO sub-sample).
All in all, this first approach allows us to put forward the hypothesis that there might be a positive correlation between the offer price and underpricing (since in hot
All Cold Hot
Jarque-Bera 19,756 22,528 1,065
markets the average first day return tends to be higher, as the descriptive statistics in Table 2 showed).
VI.2.Bivariate analysis
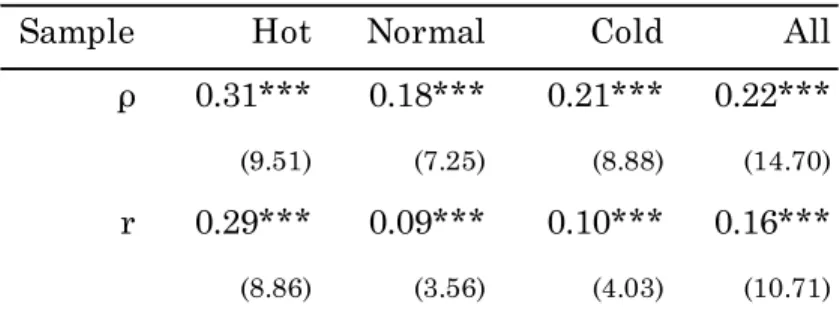
In order to understand the relation between the offer price and the underpricing we need to analyze the correlation coefficients. In this extent, and as explained previously, the Pearson’s correlation coefficient results might not be comprehensive as its assumption regarding normality is not ensured. On top of this, the relation between the variables might not be linear, making the Pearson’s coefficient incapable of yielding valuable conclusions. Taking all this into account, Table 5 presents not only Pearson’s coefficient but also Spearman’s coefficient, which yield similar conclusions.
As expected, the level of underpricing is positively, and significantly, correlated with the offer price. Moreover, this bivariate analysis seems to validate the hypothesis presented earlier: the correlation tends to be stronger in the case of hot market20.
Interestingly, the correlation coefficient seems to increase slightly in cold markets when compared to normal markets, even though this difference is not as notorious as in the case of hot IPO markets.
VI.3.Multivariate analysis
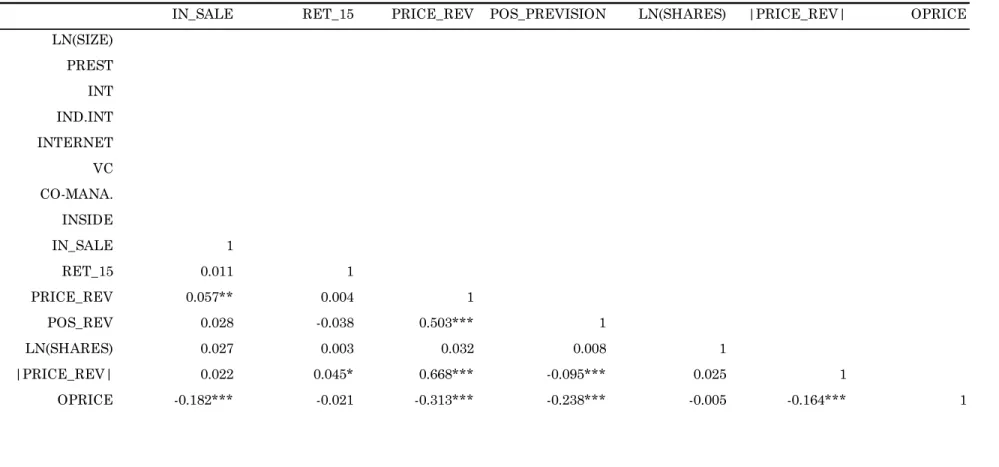
Before analyzing the results of the regressions, it is fundamental to understand the risks and dynamics of multicollinearity among the variables. Examining the correlation matrix (Table 6) one can see that the link between the variables is, in general terms, considerably high and significant.
20 One should bear in mind that that the Spearman’s correlation coefficient is less sensitive than other methods (e.g., Pearson’s coefficient).
Table 5- Spearman and Pearson’s correlation coefficients
Presents the Spearman’s ranking coefficient, ρ, and Pearson’s coefficient, r, between the offer price and the underpricing level (for different samples of data). The significance test for the coefficients is identified by the t-stat, t = corel√(n−2)
(1−ρ2), where corel is the correlation coefficient, and n, the number of observations of the
sample (sub-sample). The significance level of the coefficients is identified by the asterisks (*=10%; **=5%; ***=1%).
In particular, the highest correlation occurs between the LN(SHARES) and the level of LN(SIZE). This comes with no surprise since the level of the offer size is a combination of the number of shares and the respective offer price [for this reason, the correlation between LN(SIZE) and OPRICE is also significantly positive]. Actually, the offer price is significantly connected to a substantial number of variables, but mostly with the level of the underwriter’s prestige: prestigious banks have the structure to market higher value shares. The industry intensity and the internet and VC indicator present only substantial correlation with a limited (or inexistent) number of other variables. Nevertheless, in the case of VC indicator there seems to be a positive connection with the level of underwriter’s prestige (signaling that VC investors might be able to contract better bookrunners to assess their offers).
All in all, and even taking into account the risk of multicollinearity, the variables will be included in the regression analysis for two main reasons: (i) not all the variables will be included in the same regression (as different regressions present complementary and/or substitute approaches to the underpricing explanation); (ii) we will try to keep the original regressions as intact as possible, as the theoretical defense for the inclusion of the respective variables found solid support in the several papers that were benchmarked in this analysis.
Sample Hot Normal Cold All
ρ 0.31*** 0.18*** 0.21*** 0.22***
(9.51) (7.25) (8.88) (14.70)
r 0.29*** 0.09*** 0.10*** 0.16***
Table 6- Correlation matrix
LN(SIZE) is the natural log of the total offer size, measured as the number of shares offered at the IPO multiplied by the respective offer price, in Million USD; PREST measures prestige ranking of the main underwriter according to the "Data” Section; INT and IND.INT identify IPO intensity measured as the number of IPOs in the three months preceding the IPO and IPO industry intensity measured as the number of IPOs in the same industry and in the year preceding the IPO, respectively; INTERNET and VC are dummy variables to indicate if it is an Internet or VC backed IPO; CO_MANA. represents the number of co-managers at the IPO; INSIDE identifies the inside holdings after the IPO; IN_SALE measures the stake sold by insiders at the IPO; RET_15 is the return on the S&P 500 for the 15 days preceding the IPO; PRICE_REV expresses the variation of the offer price in relation to the midpoint of the initial price filling range; POS_PREV is and indicator variable that takes the value of 1 if the offer price revision constitutes a positive variation to the midpoint of the initial price filling range and 0 otherwise; LN(SHARES) is the natural log of the total number of shares offered at the IPO; |PRICE_REV| is the absolute value of the variation of the offer price in relation to the midpoint of the initial price filling range; and OPRICE is the offer price of the issue. The significance level of the coefficients is identified by the asterisks (*=10%; **=5%; ***=1%).
LN(SIZE) PREST INT IND.INT INTERNET VC CO-MANA. INSIDE LN(SIZE) 1 PREST 0.33*** 1 INT -0.089*** -0.218*** 1 IND.INT 0.089*** 0.006 -0.015 1 INTERNET -0.007 0.007 0.013 0.008 1 VC 0.037 0.295*** -0.063** 0.040 0.038 1 CO-MANA. 0.17*** 0.402*** -0.322*** -0.004 0.036 0.066** 1 INSIDE -0.004 0.000 0.035 0.000 0.011 -0.078*** -0.052* 1 IN_SALE -0.065** -0.22*** 0.075*** 0.007 -0.025 -0.173*** -0.13*** -0.233*** RET_15 -0.009 -0.041 0.019 0.023 0.018 -0.035 -0.038 0.001 PRICE_REV -0.114*** -0.079*** 0.121*** -0.010 0.025 -0.029 -0.056** -0.032 POS_REV -0.107*** -0.087*** -0.163*** -0.010 0.025 -0.035 0.1*** -0.041 LN(SHARES) 0.892*** -0.002 0.001 0.104*** -0.016 -0.039 -0.004 -0.014 |PRICE_REV| -0.054** -0.015 0.237*** 0.017 0.031 0.033 -0.127*** 0.014 OPRICE 0.424*** 0.641*** -0.215*** -0.12*** 0.019 0.112*** 0.398*** 0.007
Table 6- Correlation matrix (cont.)
The description matches the one on the previous page.
IN_SALE RET_15 PRICE_REV POS_PREVISION LN(SHARES) |PRICE_REV| OPRICE LN(SIZE) PREST INT IND.INT INTERNET VC CO-MANA. INSIDE IN_SALE 1 RET_15 0.011 1 PRICE_REV 0.057** 0.004 1 POS_REV 0.028 -0.038 0.503*** 1 LN(SHARES) 0.027 0.003 0.032 0.008 1 |PRICE_REV| 0.022 0.045* 0.668*** -0.095*** 0.025 1 OPRICE -0.182*** -0.021 -0.313*** -0.238*** -0.005 -0.164*** 1
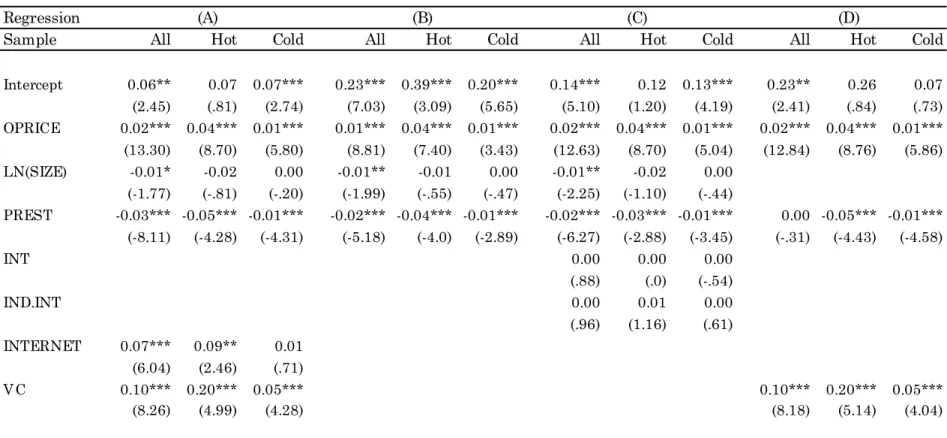
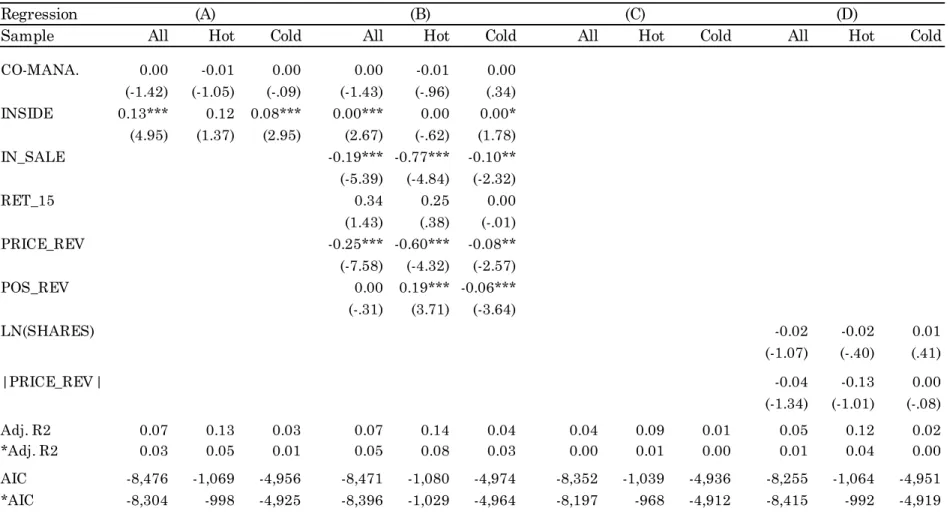
The analysis of the regression results allows us to understand the importance of some variables in explaining underpricing. Table 7 summarizes the several regressions results in accordance to the multivariate approach identified in Section V: for each regression (A, B, C or D) and for three different samples (all IPOs, only hot year’s IPOs, only cold year’s IPOs), it was computed the coefficient estimates and respective statistics as well as some figures that allow comparability between different models (R squared and Akaike information criterion).
The level of gross proceeds seems to have a negative impact on the level of first day return, even though this conclusion only holds when analyzing the entire sample. Interestingly, the signal of the relation matches the hypotheses presented by some authors [Aggarwal et al. (2002), Kennedy et al. (2006)], albeit they found no statistical significance for these conclusions. The prestige of the investment banks has a negative impact on the first day return. This conclusion is significant throughout the sample and sub-samples and follows the results of Carter and Manaster (1990). On the opposite, IPO intensity measures presented by Booth and Chua (1996) have no significant impact on the dependent variable. The role of internet and VC indicators appears to corroborate previous findings: internet IPOs tend to have higher underpricing due to the ex-ante uncertainty [Booth and Chua (1996)], and the theory of Liu and Ritter (2011) concerning the importance of the VC investors in the first day return is apparently validated by the empirical results. The implications of Habib and Ljungqvist (2001) view on the inside sale at the IPO are also corroborated by the findings: as managers sell more shares at the IPO, they will tend to bear lower levels of underpricing. However, results also seem to reject some arguments as it is the case of Kennedy et al. (2006): when the price is revised upwards, the level of underpricing tends to diminish. Besides this, some coefficients were not found statistically significant as it is the case of the market return, positive price revision indicator or the number of shares.
Last but not least, the offer price coefficient is undoubtedly positive and significant in all sub-samples and regressions. This supports the hypothesis presented earlier: higher first day returns, are systematically related with higher values of offer price.
This idea is also corroborated by analyzing the adjusted R squared coefficients and AIC21. By introducing the OPRICE variable, the explanatory power of the regression increases in all the scenarios studied. Moreover, this improvement seems to be more robust in the case of hot markets: as the coefficients are more significant, the improvement of R squared is higher and AIC is lower22.
VI.4.Discussion
Bearing in mind the previous findings, we can conclude that there is a positive correlation between the offer price and the first day return (being this relation stronger in hot markets). However, there are several implications of this conclusion that deserve a careful scrutiny.
Indeed, the existence of empirical correlation between the variables does not justify the existence of a causal relation. Thus, it is fundamental to understand if the impact of the offer price on the return is a direct causal relation or if the offer price triggers other dynamics. To test if the offer price, per se, is able to explain the underpricing we should go back to the model presented in Section III, which argues that the underpricing has two drivers: stage 0 and stage 1 supply and demand dynamics. The level of the offer price, by definition, determines the equilibrium at stage 0. However, regarding stage 1, there is nothing that allows us to predict the demand/supply dynamics based on stage 0 offer prices23. This might mean that the offer price, just per se, is not capable of explaining such a stylized fact, as the one presented in this dissertation.
Even though the offer price cannot be directly responsible for the underpricing, it can change some dynamics (for instance, after-market liquidity) that will impact the level of first day return. Therefore, the indirect effects of our results might shed some light on asymmetry of information, ownership, liquidity or litigation explanations of
21 Higher adjusted R squared and lower values for AIC indicate better models. 22 With a minor exception of regression (C) in cold markets.
23 There are, however, some indirect implications: if the offer price is high, the lower liquidity, for instance, will shape the equilibrium in stage 1. But, in this case, the causal relation is between the underpricing level