M
ASTERS IN
A
CCOUNTING
,
T
AX AND CORPORATE FINANCES
M
ASTERS
’
F
INAL
W
ORK
D
ISSERTATION
W
ORKING
C
APITAL
M
ANAGEMENT AND FINANCIAL CONSTRAINTS IN
E
UROPE WITHIN DIFFERENT
E
CONOMIC CYCLES
V
ITOR
H
UGO
C
RESPO DA
S
ILVA
A
CCOUNTING
,
T
AX AND CORPORATE FINANCES
M
ASTERS
’
F
INAL
W
ORK
D
ISSERTATION
W
ORKING
C
APITAL
M
ANAGEMENT AND FINANCIAL CONSTRAINTS IN
E
UROPE WITHIN DIFFERENT
E
CONOMIC CYCLES
V
ITOR
H
UGO
C
RESPO DA
S
ILVA
S
UPERVISION:
P
ROFESSORD
OUTORA
LCINOT
IAGOC
RUZG
ONÇALVESAbstract
Working Capital Management (WCM) elevated its importance throughout the years in the companies strategies focus. Specially, when considering the recent financial crisis and its main consequence: the reduction of liquidity provided by financing sources.
In this sense, this paper examines the relation between WCM and unlisted firms corporate performance, measured by Return on Equity, while considering the presence of financial constraints and the channeling of investment between alternative assets. Using a sample of 135.005 unlisted firm-year observations, approximately 19.814 firms from 25 countries of the European Union over the period of 2008-2017.
We show that firms with greater amounts of financing reserved to Working Capital (WC) affect negatively their performance. Importantly, when considering firms which are more distressed in the availability of internal finance, will suffer more the impact on their profitability derived by smaller changes in the investment in WC. We also exhibit that, in periods of crisis, firms with lower resources to use as collateral have more risk of harming their performance by increasing the amount of financing dedicated to WC. Finally, in periods of crisis, the negative effect on performance of investing in WC while having cash tied in other assets is diminished due to the tightening of investment opportunities in the latter assets.
Keywords: Working Capital Management; Corporate performance; financial
Resumo
O Fundo de Maneio Necessário (WCM) tem vindo a ganhar uma crescente importância ao longo dos anos, nos pontos de foco das estratégias das empresas. Especialmente, quando se considera a mais recente crise financeira e a sua principal consequência, a redução de liquidez providenciada pelas fontes de financiamento.
Neste sentido, procuramos entender a relação entre o WCM e a performance das empresas não cotadas, medido através da Rendibilidade dos Capitais Próprios, considerando também a presença de constrangimentos de financiamento e a canalização de investimento entre activos alternativos. Usando uma amostra de 135.005 observações empresa-ano, aproximadamente 19.814 empresas de 25 países da União Europeia cobrindo o período de 2008-2017.
Os nossos resultados mostram que empresas com maiores montantes de financiamento dedicados a Working Capital (WC) afectam negativamente a sua performance. De salientar que, as empresas que sintam maior pressão em obter liquidez internamente sofrem mais com pequenas alterações no investimento de WC. Concluímos também que, em períodos de crise, empresas com menores recursos que sejam possíveis ser usados como colateral apresentam maior risco de prejudicar a sua rendibilidade ao aumentarem os montantes dedicados a WC. Finalmente, em períodos de crise, o efeito negativo na performance proveniente de investir em WC, enquanto financiam também outros activos, é atenuado devido à diminuição de oportunidades de investimento nestes últimos.
Keywords: Fundo de Maneio Necessário; Performance empresarial; constrangimentos de financiamento; crise financeira.
Acknowledgments
I am very grateful for all the support and guidance provided by my supervisor, Prof. Doutor Tiago Gonçalves. The aid and the feedback given helped me pursue the best course of action in this paper along with pushing me to develop a more rational and acute thinking. I would like to dedicate this work and my success so far to the ones whom without I would never had reached this far, my grandmother, my mother, my father and, specially, my girlfriend for the immense support, love and encouragement in my life so far.
Table of contents
Abstract ... i Resumo... ii Acknowledgments ... iii Table of contents ... iv List of Tables ... v List of Abreviations ... vi I. Introduction ... 1II. Literature Review... 3
2.1. Investment and financing between economic cycles ... 3
2.2. Investment profile ... 4
2.3. WCM and its relevance ... 6
2.4. Sensitivity of investment within firms... 8
2.5. Financial Constraints and its effects ... 9
2.6. Trade Credit and alternative sources of financing ... 12
2.7. Hypothesis ... 15
III. Data and Summary Statistics ... 17
3.1. Data ... 17
3.2. Variables Description ... 17
3.3. Summary Statistics ... 20
IV. Empirical Methodology and Results ... 23
4.1. Impact of WC in firms performance... 23
4.2. The relationship between WC and firm’s performance under financial constraints . 25 4.3. Investment trade-off and corporate performance ... 29
V. Conclusions... 33
List of Tables
Table I – Summary Statistics ... 19
Table II - Correlation matrix between dependent and independent variables ... 20
Table III - Linear regression model ... 22
Table IV - Linear regression model for different periods ... 23
Table V - Linear regression model for financial constraints ... 24
Table VI - Linear regression for constrained firms in Non-Crisis period…….………….….…26
Table VII - Linear regression for constrained firms in Crisis period………...…27
Table VIII - Comparison of means………..….…28
Table IX - Linear regression model for investment………..….…29
List of Abbreviations
WC – Working Capital
WCM – Working Capital Management
I. Introduction
Investment is firms’ natural provider of sustainability, provide better performance and consequently offers more possibilities for growth. Therefore, finding the equilibrium in current and long term investment is a struggle companies’ face constantly, considering the fact that the resources which finance and support those investments are finite.
There are a considerable amount of papers which sought to understand how to maximize profitability and firm value by determining the point of equilibrium in Net Working Capital (NWC). Some have considered the presence of financial constraints and the impact of using the available funds on alternative options of investment besides WC, such as the case of Chan (2008), Bãnos-Caballero et al (2013), Ding et al (2013) and Aktas et al (2015), in order to define a conceptual guideline that helps companies to consolidate these results in the framework of their structures.
However, few addressed these questions in a context of transition between economic cycles. Gonçalves et al (2018) provide empirical evidence on this matter, for each NWC component and observed that there are different outcomes in each NWC component for each particular period of the economic cycle.
Thus, this paper pursues to extend the work done by these authors, in so far as it applies the studied concepts in a different environment, in the EU region. We test the observations of Bãnos-Caballero et al (2013) and Aktas et al (2015), to understand firm’s WCM regarding the effect of financial constraints and considering the other available options firms have to invest, namely long term assets. As in the study of Ding et al (2013) and Gonçalves et al (2018), our sample contains explicitly unlisted firms, making more evident the difficulties of accessing debt markets. Additionally, our timeline covers the period of the last financial crisis and, thus, following Gonçalves et al (2018), we seek to understand its individual effects by testing the previous cases in different periods, period of crisis and non-crisis.
This study is the first to provide a multiple analysis over the WCM and corporate performance relationship. We start from a point of general overview and then proceed to introduce additional robustness by examining the relation strictly with constrained companies. Finally we’ve concluded our tests by analyzing the existence of a trade-off between the two kinds of investment, in WC and long term assets, and its impact on firms’ performance.
Our main results show a significant negative relation between WCM and corporate performance and, importantly, we provide additional robustness by presenting also significant evidence in firms which are financially distressed. Alongside, we conclude that there are diverse impacts when considering different economic cycles, specifically, the trade-off between investing in long run assets and WC has a more significant effect in firms’ performance in periods of non-crisis.
This paper is organized as following: Section II presents the literature review on firms’ investment profile, WCM, financial constraints and consequent effects of corporate performance. It also shows the defined hypotheses. Section III describes our sample, the variables construction and the first analysis on the data, specifically the summary statistics. In section V is set the description of our test results. Lastly the conclusions are in section V.
II. Literature Review
2.1. Investment and financing between economic cycles
In stages of stability and relative constant growth firms feel the urge of continuously seeking new opportunities to invest, by developing new products or services. Depending on their objective firms may be looking to maintain or increase the market-share or even focusing on pursuing means for survival. In periods of economic booms and/or downturns the necessity not to stagnate becomes clearer, because these are periods, according to Eckestein & Allen (1986), of an unsustainable growth or fall of economic activity at rates which are temporary.
Thereby, firms cannot assume a passive behavior, since the market will constantly cause fluctuations in demand. There are no boundaries in the effects of these economic cycles. According to Demirguc-Kunt et al (2015), with the most recent financial crisis, even firms from countries that do not experienced the effects of the crisis itself deleveraged their long-term debts. Consequently firms must exploit market opportunities, so the sensitivity to deviations in cash flow from external shocks is minimized.
In this sense, firms need to find the best way of exploring their resources to be able to create new opportunities that promote growth. To keep these resources up and running firms will require financing. This can be done through internal finance, or by external finance (Fazzari et al, 1988). In the former, it is being considered the funds the company may get from its operations, more specifically retained earnings, if available. In the latter, it is included the appealing to the capital markets, the firms which have access to, or otherwise, using the most common way, debt of short or long-term.
In order to leverage the potential of the resources, firms will need to secure equilibrium within the investment assets and their respective financing sources. If well managed, then firms will withstand a lower pressure comparatively to those which have a higher dependency on a determined source (Enqvist et al, 2014).
According to Bernanke (1983) and Bernanke & Gertler (1989), constraints to firms are more evident during recessions. Where shocks to financial markets, specially bank failures, and agency costs, are seen as the main causes for investment fluctuations.
However, Chan (2008) raises a contradictory opinion saying constraints bind more significantly when firms experience positive price shocks. Considering the scenario in which firms lack the necessary resources to pursue an opportunity of investment during periods of higher demand. In this sense, an efficient management over WC is highly valuable in periods of expanding investment opportunities (Aktas et al, 2015).
2.2. Investment profile
According to Khan et al (2016), in order to achieve an optimal point of investment, management may decide whether to adjust long-term assets or current assets.
Regarding direct investment, it’s being taken into account the purchase of properties, vehicles for transportation of inventory and machinery to alter the quantity of production. In essence, assets that will require more funds to be purchased or leased and have costs of maintenance, taxes and licenses required to put those instruments to operate.
The alternative option is to affect inventories, as it is the most linear choice as production leveler. However, firms may choose to invest in receivable accounts in order to cause a shift in production’s level. Since it is not a firm’s physical asset, providing a willingly control over it, this will undertake the manager to seek an indirect way to develop an impact. A practical situation is the firms’ position towards the given credit to clients, for example, by being more restrictive will anticipate the waiting time to receive the liquidity from sales.
In current assets, we can also agglomerate the current liabilities. If we consider that firms manage their time credit, provided by suppliers, this will be a period of time avoiding diminishing the liquidity of the firm. This way, despite being a liability it confers the company a certain control over the obligations of current operations. Hence, WC is defined as the difference between current assets (including accounts receivable, inventories, and
cash) and current liabilities (composed of obligations that fund the current assets, such as accounts payable and short-term debt) (Fazzari & Petersen, 1993). Ding et al (2013) adds to the definition that WC is the clear representation of a firm’s operational liquidity. These inflows of tangible gains are the precondition to ensure that firms are able to meet their short-term obligations, namely paying taxes due.
Mota (2013) proposes another alternative to measure WC, suggesting recourse to the origin of capitals. This being done as the difference between permanent capitals (equity and non-current liabilities) and non-current assets. In this sense, the manager has the view over its capitals allocation by controlling funds destined to support current operations while simultaneously financing non-current assets, which can enhance bankruptcy risk.
WC and fixed investment have limited financing to share, that’s why firms cannot make shifts in the amount of funding on one side without causing any sort of deviation on the other. Hence, the argument of Fazzari & Petersen (1993), suggesting that there is a negative correlation between both alternatives of investment. This approach states the urge of firms seeking to maintain a stable investment path, although financial constraints may impede this objective to be fulfilled. Each time a firm attempts to neutralize cash-flow shocks with external funds should be prepared to withstand the costs to do it (Fazzari & Petersen, 1993). Eisner & Strotz (1963) and Lucas (1967) emphasize investment smoothing, since acquiring more funds may be a more expensive and extended alternative. Whereas the marginal adjustment costs of obtaining and installing capital rises as the rate of investment increases.
Fazzari & Petersen (1993) stated that firms also have more incentives to smoothing the investment in case of cash-flow fluctuations when need to undertake projects, to avoid carrying forward projects of lower value just because they are affordable.
2.3. WCM and its relevance
Firms have advantages associated with balancing their cash flow, by setting their investment, instead of appealing to new funds. A very useful tool of management over liquidity is WC, since it is highly reversible, according to Fazzari & Petersen (1993) and Ding et al (2013). Is possible for firms to maintain their operations running with negative WC. If the usage of inventories is higher than the replacement, or by tightening up the credit conceived to clients and/or delaying payments to suppliers. Through the alteration of these variables, for instance purchasing more inventories to increase production, may revert WC’s status avoiding liquidity pressuring costs.
When doing a fixed investment decision to initiate a new project it is necessary to consider it can be costly to reverse. The main reason that supports this argument is the difference between purchase price and resale price or the existing fixed costs that occur when divesting. In this sense, WC has a dominant role over the cash flow that is needed to run a business rather than the one is used to buy fixed assets (Nwankwo & Osho, 2010).
WC has a direct influence over the cash-flow generated, decisive over the availability of the company’s internal finance, revealing to be essential when financial credit is scarce. A variation in the amount of cash flow that remains is, therefore, determined by the investment extent in WC and the Retention Rate that the firm establishes. When considered a higher rate this will provide more liquidity to support the investments. According to Dunn & Cheatham (1993), a rise in liquidity ensure firms meet their short-term obligations, diminishing the probability of bankruptcy. Constrained firms which pay out dividends will face more difficulties obtaining enough cash flow to support their investments (Moyen, 2004). This way, firms need to manage WC efficiently, in order to reduce their dependence on external funding and consequent financing costs. In doing so, enables the cash surplus application in further potential investment opportunities, improving financial flexibility (Almeida & Eid Jr, 2014).
Long et al (1993), Bãnos-Caballero et al (2013) and Deloof (2003) argued about the existence of an “optimal level of WC”. They sought a relation between this adjusted level of
investment and the best profitability ratio and growth value it could provide within the resources companies possess. To determine this optimum level, for each firm, it is necessary to consider: i) the type of business, if it is industry or retail, because the latter has a shorter time period for receiving the cash from its clients, reducing WC in contrast with firms from other businesses, due to the need of having to invest more to produce more (Nwankwo & Osho, 2010); ii) company’s size. The bigger the firm is the larger is the clients portfolio and higher will be the volume of inventory required, therefore will result in a rise of WC (Mathuva, 2013); iii) suppliers relation. It will affect the management of inventories according to deliveries time; iv) market where company acts. The higher the competitiveness of the sector the greater the need of innovation and creation of opportunities for making new sales, higher WC and need for financing (Nwankwo & Osho, 2010); v) the growth opportunities that the company could have and vi) operations seasonality (Bãnos-Caballero et al, 2010).
This equilibrium can also be seen as a point in which firms do not have to sustain the consequences for neglecting the potential or operating with excessive funds invested on WC. Kieschinick et al (2013) and Aktas et al (2015) emphasized very well this second point, by presenting the evidence that firms that show excess of investment in WC would benefit more by holding the earnings in cash instead of appealing to new investments in WC.
In the presence of these studies, firms can adopt one of two strategies, according to Gomes (2013) and Gonçalves et al (2018). Following a more conservative way, firms will require a higher amount of investment in inventory, pursuing the idea of paying suppliers the earliest time possible and giving more time of credit to clients. In this way, the opportunities to explore new projects will diminish although it may reduce supplier costs, prices fluctuations risk and are less exposed to potential losses of stock-out (Blinder & Maccini, 1991). According to Bãnos-Caballero et al (2013) the relations with the suppliers and clients may be strengthened in spite of increasing the firm’s risk of becoming financial distressed. The other strategy is the opposite of the previous one, thus, being more aggressive, having smaller amounts invested in inventories, restricting credit to clients, and having more cash flow free to invest in other projects (Gomes, 2013). Both strategies have their strengths and
risks therefore none has predominance over the other, since it will depend on the numerous factors stated above. However it is important to avoid being on an extreme point since it will carry more risk to firms.
Aktas et al (2015) emphasizes very well the importance of preventing shortness and surplus of investment in WC and, therefore, seek the equilibrium. He suggests that unnecessary over-investment can diminish a firm’s performance, along with the problem of having additional cash-flow invested that could serve other purposes. In the long-run this remaining cash flow could reduce the percentage of liquidity destined to pay debt and liberate more cash flow to fund day-to-day operating activities.
On the other hand, underinvestment will restrict company’s sales options, since it will not have sufficient capacity to keep increasing the number of orders, therefore limiting cash-flow and firm’s profit. Thus, the pursuit over this equilibrium is crucial, since the improper management of WC will result in inefficient asset utilization and consequent under optimal performance (Kasiran et al, 2016). In contrast, well settled and carefully considered investment in WC may alleviate financial constraints (Kwenda, 2015).
2.4. Sensitivity of investment within firms
Following equilibrium arguments firms may pursue upon weighing each variable, there is still the need to constantly balance the investment. It is inevitable for firms to face challenges over time, such as industry-specific demand shifts, price shocks in raw materials, in financial markets, along with other factors that will unbalance financial health. These alterations may come, as Fazzari & Petersen (1993) noted, in the form of changes in fixed cost which will cause shocks to cash flow. This being the case, then investment in unconstrained firms will not be affected while constrained firms will adjust their investment in both fixed and WC. However, in case of a demand shock, a negative shock will reduce the marginal revenue in turn will decrease both fixed and WC investment for constrained and unconstrained alike.
Amendments to WC are also caused by, as Eckstein & Allen (1986) noted, changes in target inventories. To achieve determined stock amount it is necessary to do adjustments, which may vary and become cyclical in accordance to business cycle. The same relation occurs with demand, since more investment in inventory will quench the market’s need, reducing it. In opposition, an increase in market’s demand will make firms invest more in inventory to match the orders, considering absence of financial constrains that do not limit firms actions. In sum, WC investment should have a positive coefficient in a fixed investment regression, in the absence of financial constraints (Fazzari & Petersen, 1993).
Another factor that needs to be taken into account is the type of firm. Hill et al (2010) outlined the size as directly related with variations in both investment capitals. Fazzari & Petersen (1993) and Aktas et al (2015) have a complementary thought to the previous one, by saying that older, larger, and slow-growing firms generally set fixed capital investment, while smaller, younger, with volatile sales and higher growth opportunities firms tend to do it with WC instead. In which the latter can operate with negative NWC. Ding et al (2013) reinforces both statements suggesting that firms that possess lower cash flow, likely due to significant internal credit constraints, adjust both their fixed investment capital and WC. However highly leveraged firms, firms with internal and external constraints, have a higher tendency to adjust merely WC.
Fazzari et al (1988) included financial sources firms have as an element that investment may depend on, such as availability of internal finance, access to capital markets and cost of funding. Hill et al (2010) added that firms with greater internal financing capacity and capital market access hold a higher WC level. Therefore financing conditions should have a substantial focus when evaluating WC behavior.
2.5. Financial Constraints and its effects
Financial constraints can be defined as limitations in the application of the available sources of capital, entailing firms to trade off future planned production with present production (Chan, 2008).
Financial constraints are an important determinant of firms’ behavior. According to Demirguc-Kunt et al (2015) financial constrained firms and without access to equity markets deleveraged and reduced the maturity of their debt in the last period of crisis.
These obstacles can come in the form of asymmetric information, financial distress costs, difficulty of availability and access to credit or excessive indebtedness.
Asymmetric information is harmful in a way which a less-informed buyer will be unwilling to accept the terms offered by sellers with inside information regarding the quality of an asset or security. Since capital markets are not perfect, not everyone has the same access to the same information. According to Fazzari et al (1988) this can become very costly for lenders considering they will need to incur into expenditures to gather necessary information. On the borrower’s side, if the external creditor considers there is a higher risk of default on the counterpart, then the borrower will be subjected to face higher financing costs than expected or perhaps it cannot obtain credit at all. The external creditor may support his decision for having difficulties evaluating the borrower’s balance sheet variables or investment opportunities. This increase in external costs derived from asymmetric information can be seen as the effect of agency costs (Bernanke & Gertler, 1989; Love, 2003). Firms that have access to equity markets need to subject their financial information more to scrutiny than the others, in this sense they are less affected by informational asymmetries.
When a firm has difficulties to comply with its obligations of settling the debt and interests payments it means the firm is suffering from financial distress costs. This situation may lead, in extreme cases, to bankruptcy (Fazzari et al, 1988). Fazzari & Petersen (1993) suggested this is observable in firms with frail structures, which pay almost no dividends and retain earnings as much as possible. These firms have external finance as exclusive way of obtaining funds to invest and the generated cash flow is very sensitive to unbalances. Whited (1992) noted that if debt is the predominant form of financing the greater is the potential for credit restriction. Thus, even covenants may be an obstacle to the firm when it faces an opportunity of investment, through the establishment of a limit level of leverage shortening the options of investment, narrowing the chances of survival. Firms when facing financial
distress costs and consequent cash flow shortage, provided by their constriction in internal and external finance sources, will seek significant reductions in their investment in response (Molina & Preve, 2009).
Financial markets dynamics and the availability of credit strongly affect firms financing and investment options. If a firm has difficulty obtaining finance outside, its investments will be highly reliant to fluctuation of internal funds. Whited (1992) said that small firms with low liquid asset positions have limited access to debt markets because they cannot find enough robust assurance to match with their loans. Chan (2008) pointed out that the cost and access to finance are at the top 5 problems in developing countries. Ding et al (2013) complements the argument by showing that Chinese companies, except the ones controlled by the government, suffer very high pressure and difficulties of accessing the financial markets. Bernanke (1983) shows that, in periods of economic downturns, banks tend to divide small borrowers into “good” or “bad” and fore take only the first ones, which further restricts the financial credit. Fazzari et al (1988) reinforces this statement by defining, that “bad” borrowers are generally small and medium-sized companies which are often denied loans in favor of better-quality borrowers, the ones who have greater investment opportunities.
The higher is the ratio of debt financing over the firm’s assets, more pressure will be to generate more cash flow from its investments. In case of shortage of cash flow there is a high probability to enter in default with obligations inherent to financing agreements. Following this scenario, the matter it is not if firms are able to sustain the costs of their loans, but the consequence of continuously increasing the amount of credit obtained to invest. If a firm raises more debt to pay older credits, this will compromise the cycle of production, the firm will be more concerned in paying its creditors and will suffer diminishing funds necessary to afford inputs. Thereby, resulting in a decrease of revenues, reduction of cash flow and compromising liquidity. Myers (1977) showed that high levels of debt cause firms to leave projects with positive net present value, creating the potential for underinvestment and bankruptcy.
Financial constraints do not have the same impact in every firm. Bond et al (2003) and Chan (2008) consider that these constraints have a more noticeable effect when a firm desires to expand production and sales. If a firm has no financing capabilities to pursue investment opportunities, it will end up allocating scarce resources toward current production and forgo future projects. Bernanke (1983) has a contradictory opinion, saying that shocks to financial markets, considering the one felt in the last economic crisis, are more restrictive to firms. Since shortage of external capital available will cause financial stresses to firms.
Love (2003) in her study obtained robust evidence regarding the impact of financial constraints over certain characteristics of firms. Firstly, noticed that with financial development, financial constraints tend to decrease as long as internal funds improve. Secondly, concluded that in developing countries smaller firms are prone to withstand higher access difficulties to financial markets, which is coincident with Chan’s (2008) finding. Therefore, smaller firms, in spite of having good opportunities of investment, their investment will rely in greater proportion on the availability of internal funds. Thus, by combining the two statements, we may assume that the shift in a country’s financial condition, such as in booms and in recessions, will cause amendments to the impact of financial constraints over firms and in return define the available funds which may be appealed to. With this note in mind, we will expect to see the a relation between the variable that states the economy’s condition and the consequent impact of financial constraints which in turn will translate in higher sensitivity of investment on WC.
2.6. Trade Credit and alternative sources of financing
Aforementioned is the framework of a firm’s investment, namely the available options, the criteria and outcome, which a firm needs to attend to be capable to find investment capital equilibrium and the limitations it may encounter. Therefore, it remains important the clarification of the alternatives which well selected provide the equilibrium in financial resources.
The three major sources of funds are internal finance, the company’s cash flow as Carpenter et al (1994) noted, debt markets and the last resort is equity markets. The latter will not be considered in this paper to better understand the sensitivity of financial constraints in firms without alternative forms of external funding.
Debt markets provide the company with the necessary cash or assets in return for short-term and/or long-term loans, leasings, along with other instruments that define an obligation for the company to repay the lender. This source, in spite of very resourceful, showed by Modigliani & Miller (1958), when compared with internal finance it offers some cost disadvantages. The more evident forms are transaction costs, tax disadvantages, agency costs, financial distress and asymmetric information costs. If external finance cost is not significant, firms will simply use external funds to smooth investment when internal finance fluctuates. Although when cost is relevant, firms will tend to retain and their investment should be driven by fluctuations in the cash flow (Fazzari et al, 1988). In this sense, these financing tools are not perfect substitutes, particularly in the short run.
Internal Finance is more volatile and its fluctuations affect all components of investment (Carpenter et al, 1994). Hence small and medium sized corporations will suffer much more a variation than larger ones, considering a scenario where external finance is absent or has a lower preponderance. In response to the internal finance shocks, Moyen (2004) and Carbó-Valverde et al (2016) noted that unconstrained firms tend to issue debt while financially constrained will reduce their available assets, starting with those which can offer liquidity and require significantly low costs of disposal (Carpenter et al, 1994). Almeida et al (2004) emphasize this argument, saying that constrained firms with operating cash flows relatively low have a strong tendency to save cash rather than pay down debt. In opposition, unconstrained firms and constrained firms with high cash flows pay down debt rather than save cash.
We are also capable of using a control variable as a source of financing in WC which is Trade Credit. Trade Credit is the period of time provided by suppliers in order to pay the materials purchased, which have already been received by the client.
Delaying this time frame, within the agreed period, allows firms to thoroughly evaluate the quality of bought products (Gill et al, 2010). Alongside, it provides financial aid in times of liquidity shocks, since clients may avoid appeal to new bank credit and are allowed paying afterwards.
On the other hand, suppliers have a comparative advantage regarding banks when enforcing debt repayment, because they can stop selling the goods to clients, providing them significant influence in this relationship (Cuñat, 2007). In spite of this, suppliers may suffer low profitability due to the correlation from slow collection of the cash (Gill et al, 2010). Thus, the longer the period firms conceive to their clients to pay, the need over that amount of cash will gradually increase. Therefore an unsustainable growth in receivables may even become a financial distress cost if not well monitored (Molina & Preve, 2009). Providing a longer period must be allowed and having in sight the purpose of attracting new customers and gaining larger number of orders (Lazaridis & Tryfonidis, 2006). It may even be a way of stimulating sales in times of low demand, providing more control over the variation of sales along the year (Emery, 1987).
To summarize, Trade Credit can be used as an alternative source of finance, although it may come expensive, for both suppliers and clients. This is why firms will tend to use trade credit when other sources of financing are unavailable (Molina & Preve, 2012). This source is more suitable when verified the condition of having a restrictive connection between both parties, meaning there shall be significant costs to both parts to find another counterpart to negotiate with. This way, the interest rate will compensate the risk of default (Cuñat, 2007). However, Bãnos-Caballero (2010) and Molina & Preve (2012) noticed that Trade Credit is significantly used by smaller and less dominant firms. Carbó-Valverde et al (2016) conclusions show that financially constrained firms are more dependent of Trade Credit. Due to a possible difficulty of access to financial credit, suppliers take advantage of the situation to lend cash to their distressed clients.
2.7. Hypothesis
We seek to understand the relation between investment in NWC and consequently the impact it caused on unlisted European firms performance. Bearing in mind the results from the studies of Long et al. (1993), Deloof (2003) and Bãnos-Caballero et al. (2013), pointing out the existence of an optimal level of WC, suggest that firms have a gap which is possible to raise the amount invested in WC while increasing the profitability level and the opposite scenario occurs after surpassing the limit point. According to Aktas et al (2015), when facing the decision to invest more or less in NWC, one must take into account its current position. If the firm is already pushing some significant effort in investing, then it may consider reducing the unnecessary excess in order to converge to the optimal point which leads to higher profitability results. Therefore, following this assumption, we expect that our first regression will express an opposite sign relation between NWC and firms’ performance while continuously investing in WC.
Regarding our second hypothesis, we are looking to apply the same principle as in the previous one. However, the expected results are fixated on financially constrained firms. As stated by Fazzari & Petersen (1993) constrained firms are more susceptible of suffering shocks in their performance derived from shocks in cash flow. Bãnos-Caballero et al (2013) adds by referring that financially distressed firms present a lower optimal working capital comparatively to non-distressed firms. Thus, firms that sustain greater constraints in financing will face higher impacts in their performance if investing at the same degree as the other firms. In this sense we are looking to obtain the same interaction as in the previous regressions and, eventually, with higher intensity.
As our last hypothesis, we’ll be looking to understand how the investment in NWC and alternative channels affected European companies. Fazzari & Petersen (1993) conclusions pointed to a negative correlation between the both types of investment, namely stating that firms feel the urge to alter the amounts invested in order to smooth fluctuations in performance. Aktas et al (2015) also suggested that firms with high values of unnecessary cash tied up in NWC tend to release this excess and canalize it towards more efficient investments, such as fixed assets and consequently obtain higher performance values. In this
sense, we are looking to verify, in our study, a decrease in firms’ performance when there is a simultaneous increase of funds applied in NWC and other alternative investments.
We simplified our hypothesis in three primary results we expect to observe:
Hypothesis 1 - There is a negative relationship between net working capital and firms’
performance;
Hypothesis 2 – Especially, there is a negative relationship between net working capital and
the performance of firms’ that are affected by financial constraints;
Hypothesis 3 - There is a negative relationship between having cash tied in net working
III. Data and Summary Statistics
3.1. Data
Our sample is composed by 135.005 firm-year observations from 25 countries which belong to European Union, with observations from the last 10 years (2008 – 2017).
Our sample is solely composed by unlisted companies, without any access to capital markets and therefore dependent on external financing, in order to reflect more accurately the reality of constraints to obtain financing and, thus, the importance of WCM.
Firms from the financial sector are excluded from our data set, along with the ones which pursue public administration and national defense activities.
We are considering exclusively firms with consolidated accounts, avoiding duplication of values from subsidiaries.
Additionally, we focused the data in medium and large enterprises, which gathered the criteria of having at least 43 million EUR of total assets and a minimum of 250 employees, similar to the study of Gonçalves et al (2018).
3.2. Variables Description
We estimate our initial model as following:(1) ROEi,t = β0 + β1ROAi,t + β2ZNTCi,t + β3ZNTC2i;t + β4SIZEi;t + β5LEVi;t + β6GROWTHi;t + ηi + Ωi + λt + εi;t
As dependent variable for our analysis we selected Return on Equity (ROE), calculated as the ratio of net income to total assets, in order to measure the net performance obtained from unlisted firms. Regarding WCM and its relation with firms’ performance, we introduced two independent variables, Net Trade Cycle (NTC) and it’s respectively square, as used in the study of Bãnos-Caballero et al (2013). NTC is calculated as: [(accounts receivable + inventories − accounts payable) / sales] * 365. Additionally we have standardized our variable in order to give a more perceptible understanding of the shifts in
the investment of working capital. The combination of these two variables allows a better comprehension of which sense does the relation with performance is facing and, the shape of it, namely the way firms behave comparatively to the sample average in WCM and the respectively response from performance obtained.
The remaining independent variables considered, were chosen in accordance to the study Bãnos-Caballero et al (2013). In order to determine the firms dimension we use the variable named SIZE, which is defined as the natural logarithm of sales. Considering the importance that is for this study the financing structure of firms, we introduced the variable called LEV, which indicates the degree of leverage or dependency on external credit and can be computed as the ratio of total debt to total assets. To understand and quantify the opportunities firms have to grow we consider the variable named GROWTH, which is the ratio of book value of intangibles assets to total assets. Lastly, since firms’ performance is directly dependent on the state the operations are being managed, we introduced the Return on Assets (ROA), measured as the ratio of EBIT over total assets.
We also considered dummy variables with the purpose of controlling and stabilizing the influence of economic factors in the specific industries (ηi), in the various countries (Ωi), a time dummy variable that aims to capture the different effects over the considered years (λt) and finally the representation of the error term (εi,t), the random disturbance. One additional dummy was included to identify the years of crisis and non-crisis, following the study of Almeida (2017). The period of crisis is comprised between 01.11.2008 and 31.12.2012 and the post-crisis period started on 01.01.2013, therefore we assumed the value “1” for the years 2008 until 2013 and the value “0” from 2014 until 2017.
For the financial constraints, many are the possible indicators that can point an evidence of a financing’s negative impact. Hence, we consider the following as proxies:
Cash Flow (computed as the ratio of EBIT to Total Assets), as in Moyen (2004) to differentiate firms with constraints and without them consists in comparing the cash flow value for each firm with the median of the sample. Since firms with higher cash flow hold a
greater capability of covering a larger portion of the financing costs these feel less pressure from constraints;
Size (measured as the natural logarithm of sales), according to Whited (1992), Carpenter et al (1994) and Almeida et al (2004), firms of greater dimension possess larger amount of resources to face superior internal-finance availability shocks and have better access conditions to external credit. Therefore, by considering the size we follow the notion that smaller firms withstand higher financing constraints. We compared each firm’s size value with the sample median and considered the ones below the median as the ones more susceptible to suffer more the effects.
Cost of external financing (calculated as the ratio Financial Expenses to Total Debt), as stated by Fazzari et al (1988), firms feel a direct impact on their results and consequent availability of liquidity depending on the pressure felt by the financing expenses. In this sense, financial constraints bind more when firms face higher financing costs. Thus, companies withstanding costs above the median of the sample are more likely to be financially distressed.
Interest Coverage (measured by the ratio of earnings before interest and taxes to financial expenses) highlights the capability firms have to repay expenses arising from being financed by debt and in some cases emphasize the necessity for additional income to face the supplementary financial expenses pressure. According to Whited (1992) as this ratio increases lesser difficulties firms sustain and, therefore, a coverage ratio below the sample median represents a higher probability to be financially constrained.
Collateral (calculated by the ratio of tangible assets to total assets), as considered by Ding et al (2013), firms with high levels of leverage require greater levels of tangible assets to use as a warranty to support those credits. In this sense, firms that exhibit lower ratio values of tangible assets in the total set of resources comparatively to the sample median are more likely to be financially constrained.
Furthermore, we standardized all these proxies in order to provide additional robustness.
3.3. Summary Statistics
We made some arrangements in the data, in order to have more refined and consistent information taken from the obtained results. In this sense, we took out the observations which did not have results for any of the given variables and removed extreme outliers.
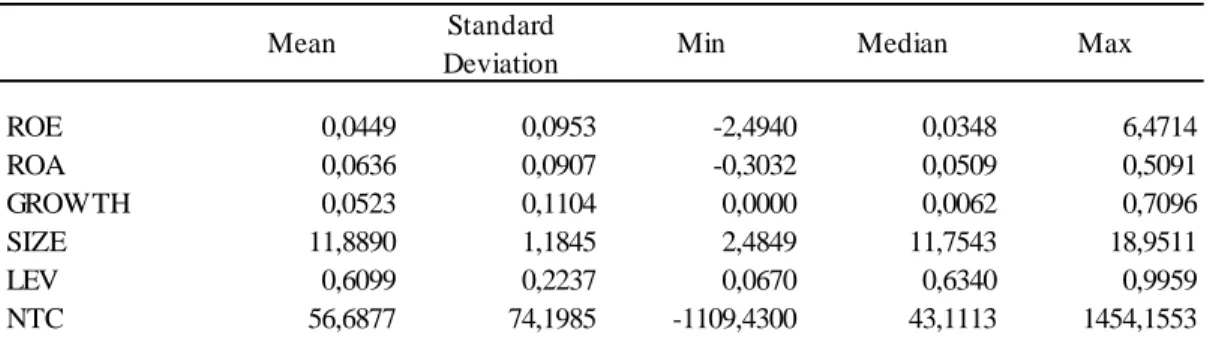
After disposing these cases remained 135.005 firm-year observations. In Table I we show the descriptive statistics, namely mean, standard deviation, median, maximum and minimum for these observations.
T
ABLEI
Summary Statistics
Table I shows that our firms sample on average obtain a ROE of 4.49% while its median is 3.48%.
The variable representative of the size exhibits a mean of 11,8890 (approximately 145.654 thousands of Euros) when comparing with the study of Bãnos-Caballero et al (2013), their results showed a higher mean value for size 12,1233 (approximately 184.112 thousands of Euros). With firms from UK only, Gonçalves et al (2018) also presents a sample composed merely by firms from UK and on the average their firms’ sales round the 230.540 thousands Euros much higher values when compared with the ones we obtained from our sample even which considers a broader range of countries.
Regarding return on assets, the mean value for this variable is lower for firms in UK, 5,59 % in the study of Bãnos-Caballero et al (2013) and 4,16% on Gonçalves et al (2018). In
Mean Standard
Deviation Min Median Max
ROE 0,0449 0,0953 -2,4940 0,0348 6,4714 ROA 0,0636 0,0907 -0,3032 0,0509 0,5091 GROWTH 0,0523 0,1104 0,0000 0,0062 0,7096 SIZE 11,8890 1,1845 2,4849 11,7543 18,9511 LEV 0,6099 0,2237 0,0670 0,6340 0,9959 NTC 56,6877 74,1985 -1109,4300 43,1113 1454,1553
our study, the value is higher, 6,36% posing better performance results even though firms in UK showed greater sales values.
In terms of WCM, on average our firms sample presents a very similar result, 56,69 days, to the one in the study of Bãnos-Caballero et al (2013), 56,47 days. However, UK firms possess a higher median, 52,29 days comparatively to our sample 43,11 days.
Our study also shows that firms in EU, on average, are financed by debt in, approximately, 61% a close percentage to the one obtained by Bãnos-Caballero et al (2013), 56,86%. The growth opportunities variables highlight a significantly lower average in our study, 0,05, when compared with companies solely in UK, 0,21.
In Table II are presented the bivariate Pearson correlations between the variables mentioned above.
T
ABLEII
Correlation matrix between dependent and independent variables
Notes:*, ** represent significant correlations at 0.05 and 0.01, respectively.
Is possible to observe that almost all associations are significant and don’t seem to present correlations too intense that may indicate multicollinearity between variables.
Observing firstly the correlation between return on equity and return on assets, it shows a positive strong association, 0,737, meaning the corporate profitability rises driven by growth in operating results of companies.
ROE ROA GROWTH SIZE LEV NTC
ROE 1 ROA 0,737** 1 GROWTH -0,088** -0,075** 1 SIZE 0,040** 0,055** 0,030** 1 LEV -0,212** -0,172** 0,039** 0,143** 1 NTC -0,006* -0,002 -0,053** -0,125** -0,035** 1
The variable size displays a positive relation with the performance variables, as well as in the study of Bãnos-Caballero et al (2013), implying that as sales increase there will be an increment in the profitability.
Regarding our NWC variable and its correlation with other variables our results are very similar to the study of Bãnos-Caballero et al (2013). However the interaction between return on assets and NWC suggests that an increase in WC will cause movement in performance towards the opposite direction contrarily to Bãnos-Caballero et al (2013) findings.
Bearing in mind the results from the correlations test and the similarity between variables, it was necessary to test the existence of multicolearity.We run two different tests, first, as stated in the study of Bãnos-Caballero et al (2013), calculate the variance inflation factor (VIF) for each independent variable, since the highest value obtained is 1.827, quite inferior to limit stated of 5, therefore this test proves the non-existence of multicollinearity in our data. Our second test consists in running different regressions with and without the control and verify the differences which may occur in all the different regressions created. The outcome from this test shows no evident sign of alteration in any of the regressions, therefore supporting the previous test and confirming the non-existence of multicollinearity.
IV. Empirical Methodology and Results
4.1. Impact of WC in firms performance
As aforementioned, we are looking to understand three key points: consequent profitability derived from firms WCM in the covered timeline; the impact of investing in WC while sustaining financial constraints and lastly tracing firms’ investment profile, by analyzing the relation between investing in WC while having cash tied in other alternatives, and its influence on firms’ performance.
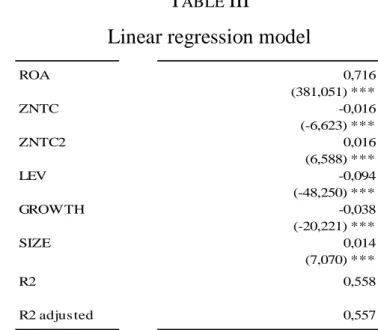
Table III shows the results for the first main point of study:
T
ABLEIII
Linear regression model
Notes:*, ** represent significant correlations at 0.05 and 0.01, respectively.
The dependent variable is return on equity; ZNTC is the net trade cycle divided by 100 and standardized and ZNTC2 its square; SIZE the size; LEV the leverage; GROWTH the growth opportunities; and ROA the return on assets. Time, country and industry dummies are included in the estimations, but not reported. T-test statistic in brackets. Values from standardized coefficients.
In a first analysis, our regression presents a robust explanatory value of information of 55,7% and significance at the point of 1% (P-value < 0,01). All variables exhibit high individual significance. ROA 0,716 (381,051) *** ZNTC -0,016 (-6,623) *** ZNTC2 0,016 (6,588) *** LEV -0,094 (-48,250) *** GROWTH -0,038 (-20,221) *** SIZE 0,014 (7,070) *** R2 0,558 R2 adjusted 0,557
Noting specifically the relation between WCM and corporate performance we can affirm that, in our sample, firms that increase their investment in WC have an associated decrease in their profitability, meeting the result expected for our first hypothesis. Alongside, by analyzing the results from the squared NWC variable, considering both coefficients (β2 <0 and β3 >0), we complement our findings stating that firms that are closer to the sample average are more inclined to obtain better profitability results and feel less accentuated shifts in their performance derived from investing or divesting in WCM, coinciding with Aktas et al (2015) conclusions.
In order to reflect the specific crisis effect, we’ve used a crisis subsample and ran the previous regression two more times, obtaining two new regressions, one in period of crisis and the other one in the non-crisis period, similar to the approach of Gonçalves et al (2018). In Table IV are presented the results from the additional tests and the conclusions we take are very similar to the ones in the previous regression.
T
ABLEIV
Linear regression model for different periods
Notes:*, ** represent significant correlations at 0.05 and 0.01, respectively.
The dependent variable is return on equity; ZNTC is the net trade cycle divided by 100 and standardized and ZNTC2 its square; SIZE the size; LEV the leverage; GROWTH the growth opportunities; and ROA the return on
assets. Time, country and industry dummies are included in the estimations, but not reported. T-test statistic in brackets. Values from standardized coefficients.
Non-Crisis Period Crisis Period
ROA 0,688 0,743 (240,331) *** (302,672) *** ZNTC -0,017 -0,016 (-4,543) *** (-4,913) *** ZNTC2 0,015 0,017 (4,047) *** (5,386) *** LEV -0,094 -0,093 (-31,838) *** (-36,748) *** GROWTH -0,039 -0,037 (-13,657) *** (-15,012) *** SIZE 0,011 0,017 (3,752) *** (6,367) *** R2 0,518 0,599 R2 adjusted 0,517 0,599
4.2. The relationship between WC and firm’s performance under
financial constraints
To provide some robustness to our results, our next step is to perceive if the relation presented above is also statistical significant in a context where firms are burdened by financial constraints. In this sense we’ve proceeded to define a new variable, DFC, which is a dummy that assumes the value “1” for firms more financially constrained and 0 otherwise. Therefore, our original regression changes into the following:
(2) ROEi,t = β0 + β1ROAi,t + β2ZNTCi,t + β3(DFC*ZNTCi,t) + β4ZNTC2i;t + β5(DFC*ZNTC2i;t) + β6SIZEi;t + β7LEVi;t + β8GROWTHi;t + ηi + Ωi + λt +
εi;t
All remaining variables stayed unaltered. Table V shows the results for this regression categorized for each constraint.
T
ABLEV
Linear regression model for financial constraints
Notes:*, ** represent significant correlations at 0.05 and 0.01, respectively.
The dependent variable is return on equity; ZNTC is the net trade cycle divided by 100 and standardized and ZNTC2 its square; SIZE the size; LEV the leverage; GROWTH the growth opportunities; and ROA the return on
Cashflow Collateral Interest Coverage Cost of External
Financing Size ROA 0,716 0,716 0,716 0,716 0,716 (380,861) *** (381,042) *** (381,004) *** (381,046) *** (381,008) *** ZNTC -0,004 -0,015 -0,011 -0,017 -0,019 (-0,954) (4,356) *** (-3,350) *** (-5,138) *** (-5,444) *** DFC * ZNTC -0,017 -0,002 -0,008 0,001 0,004 (-3,599) *** (-0,590) (-2,592) ** (0,344) (1,211) ZNTC2 0,009 0,014 0,014 0,016 0,020 (2,607) *** (3,876) *** (4,671) *** (5,304) *** (5,230) *** DFC * ZNTC2 -0,007 0,002 0,002 -0,001 -0,006 (1,665) * (0,619) (0,600) (-0,374) (-1,448) LEV -0,094 -0,094 -0,094 -0,094 -0,094 (-48,331) *** (-48,244) *** (-48,200) *** (-48,248) *** (-48,263) *** GROWTH -0,038 -0,038 -0,038 -0,038 -0,038 (-20,172) *** (-20,220) *** (-20,155) *** (-20,222) *** (-20,215) *** SIZE 0,014 0,014 0,014 0,014 0,013 (7,044) *** (7,070) *** (7,183) *** (7,067) *** (6,239) *** R2 0,558 0,558 0,558 0,558 0,558 R2 adjusted 0,557 0,557 0,557 0,557 0,557
assets. Time, country and industry dummies are included in the estimations, but not reported. T-test statistic in brackets. Values from standardized coefficients.
The results display a diverse set of conclusions for different constraints, complementing the test done in the first regression.
Observing firstly the cash flow constraint, the NWC variable is no longer significant by itself, however its interaction with the constraint dummy is significant at 1% and presenting a negative value for the coefficient. This means that, the firms in our sample, which possess a low value of cash flow will suffer the risk of diminishing their profitability by investing in WC. Alongside, the interaction of the squared NWC variable with the financial constraints dummy present a negative coefficient, which is contrary to what we observed in the previous regression. Therefore, we conclude that the effect of investing in WC and reducing corporate performance, while sustaining the pressure of having a smaller amount of cash flow available, it is more accentuated for smaller changes around the mean.
In the interest coverage perspective, we conclude that in both situations, for the general set of firms and for firms which feel financially distressed, increasing the amount invested in WC has a significant consequence by reducing profitability.
For the remaining cases of financial constraints the results do not present any particular significant effect, meaning the performance does not show significant alterations when distressed firms increase their investment in WC.
T
ABLEVI
Linear regression for constrained firms in Non-Crisis period
Notes:*, ** represent significant correlations at 0.05 and 0.01, respectively.
The dependent variable is return on equity; ZNTC is the net trade cycle divided by 100 and standardized and ZNTC2 its square; SIZE the size; LEV the leverage; GROWTH the growth opportunities; and ROA the return on
assets; DFC is a dummy variable equals 1 for firms more likely to be financially constrained and 0 otherwise. Time, country and industry dummies are included in the estimations, but not reported. T-test statistic in brackets. Values from standardized coefficients.
Cashflow Collateral Interest Coverage Cost of External
Financing Size ROA 0,688 0,688 0,688 0,688 0,688 (240,205) *** (240,327) *** (240,295) *** (240,329) *** (240,315) *** ZNTC -0,003 -0,022 -0,011 -0,015 -0,019 (-0,510) (-4,132) *** (-2,376) ** (-2,929) *** (-3,589) *** DFC * ZNTC -0,020 0,007 -0,008 -0,003 0,003 (-2,761) *** (1,273) (-1,909) * (-0,712) (0,618) ZNTC2 0,007 0,019 0,013 0,016 0,018 (1,330) (3,343) *** (2,816) *** (3,294) *** (3,013) *** DFC * ZNTC2 -0,009 -0,006 0,002 -0,002 -0,004 (-1,514) (-1,026) (0,569) (-0,431) (-0,691) LEV -0,094 -0,094 -0,094 -0,094 -0,094 (-31,888) *** (-31,839) *** (-31,817) *** (-31,845) *** (-31,844) *** GROWTH -0,039 -0,039 -0,039 -0,039 -0,039 (-13,616) *** (-13,666) *** (-13,623) *** (-13,655) *** (-13,655) *** SIZE 0,011 0,011 0,012 0,011 0,011 (3,695) *** (3,752) *** (3,834) *** (3,759) *** (3,347) *** R2 0,518 0,518 0,518 0,518 0,518 R2 adjusted 0,517 0,517 0,517 0,517 0,517 Non-Crisis Period
T
ABLEVII
Linear regression for constrained firms in Crisis period
Notes:*, ** represent significant correlations at 0.05 and 0.01, respectively.
The dependent variable is return on equity; ZNTC is the net trade cycle divided by 100 and standardized and ZNTC2 its square; SIZE the size; LEV the leverage; GROWTH the growth opportunities; and ROA the return on
assets; DFC is a dummy variable equals 1 for firms more likely to be financially constrained and 0 otherwise. Time, country and industry dummies are included in the estimations, but not reported. T-test statistic in brackets. Values from standardized coefficients.
There are some noticeable changes between the two periods that weren’t so evident in the previous observations. Concerning the context of cash flow and interest coverage constraints, the results are very similar to the aforementioned.
Regarding the collateral constraint, in addition to the negative relation between WC and corporate performance which is constant for both periods, we observe a significant pressure on firms with less collateral resources to meet their financing, in the period comprised by crisis. The effect is more significant on firms with a degree of investment far apart the sample average. This indicates the added importance it has for firms financed through external credit to preserve a robust set of collateral to anticipate periods of financial crisis and therefore withstand lesser financial constraints. This results are coincidental with
Cashflow Collateral Interest Coverage Cost of External
Financing Size ROA 0,744 0,743 0,744 0,743 0,743 (302,519) *** (302,651) *** (302,637) *** (302,663) *** (302,613) *** ZNTC -0,005 -0,009 -0,011 -0,020 -0,019 (-0,866) (-1,964) * (-2,445) ** (-4,482) *** (-4,179) *** DFC * ZNTC -0,014 -0,011 -0,007 0,005 0,005 (-2,256) *** (-2,357) ** (-1,730) * (1,301) (1,103) ZNTC2 0,010 0,010 0,016 0,017 0,022 (2,425) (2,078) ** (3,908) *** (4,297) *** (4,433) *** DFC * ZNTC2 -0,004 0,010 0,001 0,000 -0,007 (-0,788) (2,161) ** (0,192) (0,031) (-1,316) LEV -0,094 -0,093 -0,093 -0,093 -0,093 (-36,811) *** (-36,720) *** (-36,698) *** (-36,736) *** (-36,760) *** GROWTH -0,037 -0,037 -0,037 -0,037 -0,037 (-14,985) *** (-15,016) *** (-14,954) *** (-15,003) *** (-15,005) *** SIZE 0,017 0,017 0,017 0,017 0,015 (6,384) *** (6,368) *** (6,444) *** (6,369) *** (5,592) *** R2 0,599 0,599 0,599 0,599 0,599 R2 adjusted 0,599 0,599 0,599 0,599 0,599 Crisis Period
Bernanke (1983) and Bernanke & Gertler (1989) conclusions, which means that there are constraints that become more evident during recessions.
Since the latter test shows variations in the values for the two periods, even if minor ones, we’ve proceeded to an additional test of means t-test, in order to confirm if these differences reveal to be significant or not.
T
ABLEVIII
Comparison of means
Regarding the results obtained, in Table V, we conclude that the differences in the coefficients within the two periods are only significantly different in the variables of Return on Assets and Return on Equity. The remaining show no statistical significant differences between different economic cycles.
4.3. Investment trade-off and corporate performance
Lastly, as additional test, we analyze the existence of an equilibrium in investment, meaning that if firms have restricted funding so we must expect to observe a negative relation between investing simultaneously in WC and in alternative sources of investment, as tangible assets, as stated in our last hypothesis. We proceeded in the same way as before, that is to say, we’ve created new variable, DINVEST, which is a dummy that assumes the value “1” for firms that increased their investment and 0 otherwise. Whereby our regression was altered to the following: Equal means ROE 0,001 ROA 0,026 ZNTC 1,000 ZNTC2 0,996 LEV 0,914 GROWTH 0,773 SIZE 0,026
(3) ROEi,t = β0 + β1ROAi,t + β2ZNTCi,t + β3(DINVEST*ZNTCi,t) + β4ZNTC2i;t + β5(DINVEST*ZNTC2i;t) + β6SIZEi;t + β7LEVi;t + β8GROWTHi;t + ηi + Ωi
+ λt + εi;t
To determine which firms increased their investment we’ve calculated the variation in the amount registered in tangible assets plus cash for each firm and for each year. Therefore any positive variation is considered as an increase in investment and consequently assumes the value of “1” in our dummy and the value “0” for the remaining cases. Since the calculation of the variation requires two years of comparison, the observations for the year of 2008 did not have any results to compare to, hence were not included in this test and thus our sample was reduced to 128.101 firm-year observations.
Table IX presents the result for our investment regressions.
T
ABLEIX
Linear regression model for investment
Notes:*, ** represent significant correlations at 0.05 and 0.01, respectively.
The dependent variable is return on equity; ZNTC is the net trade cycle divided by 100 and standardized and ZNTC2 its square; SIZE the size; LEV the leverage; GROWTH the growth opportunities; and ROA the return on
assets; DFC is a dummy variable equals 1 for firms that increased their investment in cash and/or tangible assets and 0 otherwise. Time, country and industry dummies are included in the estimations, but not reported. T-test statistic in brackets. Values from standardized coefficients.
Inves tment in tangible as s ets plus cas h ROA 0,709 (354,563) *** ZNTC -0,012 (-3,275) *** DINVEST * ZNTC -0,006 (-1,699) * ZNTC2 0,012 (3,509) *** DINVEST * ZNTC2 0,004 (1,119) LEV -0,094 (-45,330) *** GROWTH -0,038 (-19,076) *** SIZE 0,014 (6,647) *** R2 0,548 R2 adjus ted 0,547
With this test we can conclude that throughout the period from 2008 until 2017, the firms in our sample that sought alternative sources of investment, such as increasing their tangible assets, cash and its equivalents or both, harmed their performance while simultaneously investing in WC.
In order to understand the years that provide a deeper impact on this relation, once more, we’ve divided our regressions in two subsamples, one comprised the period of crisis and the other the non-crisis period. Table X shows the results for both regressions.
T
ABLEX
Linear regression model for investment in different periods
Notes:*, ** represent significant correlations at 0.05 and 0.01, respectively.
The dependent variable is return on equity; ZNTC is the net trade cycle divided by 100 and standardized and ZNTC2 its square; SIZE the size; LEV the leverage; GROWTH the growth opportunities; and ROA the return on
assets; DFC is a dummy variable equals 1 for firms that increased their investment in cash and/or tangible assets and 0 otherwise. Time, country and industry dummies are included in the estimations, but not reported. T-test statistic in brackets. Values from standardized coefficients.
We observe that, contrary to financial constraints, investment highlights a significant effect during periods outside of crisis, supporting the idea that these are the periods when a more substantial number of companies feel more comfortable to invest in new machinery,
Non-Cris is Period Cris is Period Inves tment in tangible as s ets
plus cas h
Inves tment in tangible as s ets plus cas h ROA 0,688 0,734 (240,230) *** (265,321) *** ZNTC -0,009 -0,016 (-1,680) * (-3,182) *** DINVEST * ZNTC -0,011 0,001 (-2,242) ** (0,112) ZNTC2 0,008 0,018 (1,565) (3,666) *** DINVEST * ZNTC2 0,010 -0,004 (2,147) ** (-0,894) LEV -0,094 -0,093 (-31,865) *** (-32,556) *** GROWTH -0,039 -0,037 (-13,635) *** (-13,407) *** SIZE 0,011 0,017 (3,770) *** (5,833) *** R2 0,518 0,585 R2 adjus ted 0,517 0,584
new processes among other alternatives and simultaneously increasing inventory stock which will lead to a more significantly effect on performance. On the other hand, in periods of crisis firms have a higher restraint over their investments and a fewer number of firms are presented with investment opportunities, thus the relation is less significant, as suggested by Chan (2008) and Aktas et al (2015).
V. Conclusions
The aim of this study is to examine the relationship between working capital management and firms’ performance, under three assumptions: in a general overview of the relation, in the presence of financial constraints and while using available funds as alternative sources for investment. Alongside, our sample is composed by unlisted firms from the European Union and comprises the years from 2008 until 2017.
Our paper covers the period of the most recent financial crisis, which inflicted many credit access obstacles to firms especially to those without the possibility of obtaining financing through capital markets. Thus, on our study we also seek to comprehend crisis specific effect in those three respective conditions mentioned above.
Our results support the conclusions from Aktas et al (2015) exhibiting a negative association between investment in WC and firms’ performance. Determining that firms which have investment levels in WC far distant from the sample mean are the ones that feel the greatest consequences from this effect, revealing a U-shaped relation.
We’ve analyzed the previous relationship in the presence of financially distressed firms, following the approach of Bãnos-Caballero et al (2013). Our findings present additional robustness to our results, specifically by stating that firms’ that feel constrained in terms of internal finance availability are more exposed to performance shocks by investing in WC. Bringing together Gonçalves et al (2018) methodology, analyzing the impacts for different periods, we obtained additional results which complemented the study. Namely, firms financed through external credit which possess fewer resources to use as collateral, in periods of crisis, show a tendency to withstand significant pressure on their results while investing in WC. On the contrary, in non-crisis periods, this is not so evident.
Regarding firms’ performance and WCM while simultaneously using funds to support investment in alternative assets we find that this scenario have a significant expression over profitability, especially in periods of non-crisis, contrary to financial constraints.