November 2015
ISSN: 0075-0778 (Print) 1939-4055 (Online)
http://www.irishgeography.ie
The green ‘signature’ of Irish cities: An examination
of the ecosystem services provided by trees using
i-Tree Canopy software
Gerald Mills, Max Anjos, Michael Brennan, Jean Williams, Clare
McAleavey and Tine Ningal.
How to cite: Mills, G. et. al. (2015)
‘The green ‘signature’ of Irish cities: An
examination of the ecosystem services provided by trees using i-Tree Canopy
software’. Irish Geography, 48(2), 62-77, DOI: 10.2014/igj.v48i2.625
The green ‘signature’ of Irish cities: An examination of the
ecosystem services provided by trees using i-Tree Canopy
software
G. Mills*a, Max Anjosb, Michael Brennan, Jean Williams, Clare McAleavey and
Tine Ningal.
a School of Geography, Newman Building, UCD, Dublin 4.
b Institute of Geography and Spatial Planning, Center of Geographical Studies
(ZEPHYRUS/Climate Change and Environmental Systems Research Group) Universidade de Lisboa. Ed. IGOT. CAPES-Foundation, Ministry of Education of Brazil, Brasília DF 70040-020, Brazil (nº. process: 1135-13-9)
Abstract: Urban areas profoundly alter the local atmosphere, hydrology
and biology, usually for the worse. Increasing the vegetative cover in urbanised areas is considered an effective way of offsetting many of the undesirable outcomes of urbanisation and is often incorporated as Green Infrastructure into urban development plans. In this paper we present a first assessment of the green cover in Irish city centres (Belfast, Cork, Derry, Dublin, Galway, Limerick and Waterford) and evaluate the environmental benefits of trees for air quality using the i-Tree Canopy software. This online software is used to conduct a spatial sample of the urban landscape and estimate tree canopy cover from which potential air quality benefits are calculated. The results show significant differences between and within city centre areas in terms of vegetative (and tree) cover; Belfast and Dublin, with less than 10% vegetative cover are in marked contrast to other cities where the average is close to 30%. Based on the findings we discuss place-based policies for improving green infrastructure in Irish cities and the evidence needed to support policies.
Introduction
The natural environment in cities is demonstrably changed from the vegetated landscape that preceded it. The intensity of the changes varies across the urbanised landscape and is related to aspects of both its form and function. The former refers to the physical character of the city, which may be described in terms of surface cover, construction materials and built geometry. The latter refers to the human activities that are sustained by the through-flow of energy, water, food and materials that are needed to maintain the population and economy. Once used, these resources become waste; for example, the emission of heat, moisture and materials into the overlying atmosphere is largely responsible for the degraded quality of air in cities. The net effect is an urban atmosphere that is warmer, drier
and enriched with a host of particulates and trace gases when compared with the non-urban atmosphere. Among the most relevant measures of the intensity of urbanisation (and of its impact on the local hydrology, climate and biology) are the proportions of the landscape that are impermeable and vegetated (Grimm et
al., 2008).
Impermeable surface cover prevents rainfall from infiltrating to the underlying soil, diverting it instead to a hydrologic network of pipes that deliver water quickly to natural and artificial water courses. As a result, rivers receive more water, more quickly from urbanised surfaces than from natural surfaces and experience a greater range of discharge. A closely related measure is the proportion of the landscape that is vegetated; this Green Infrastructure (GI) describes all the vegetated spaces within a given area, from large stands of natural vegetation and park land, to single street trees, lawns and roof gardens (Benedict and McMahon, 2006). Planning for GI can address many of the undesirable effects of urbanisation and provide environmental, social and even economic benefits (Jim and Chen, 2008, Liekens
et al., 2013). This paper presents a first examination of the vegetative cover (GI)
and its corollary (built cover) in the central areas of Irish cities. Its particular focus is on the tree canopy cover and its potential for offsetting atmospheric pollution.
Literature Review
There is considerable international interest in mitigating the effects of urbanisation through the integration of water and vegetation features into urban design. Together these are referred to as blue and green infrastructure (EPA, 2012), reflecting their roles as ecosystem service providers. For example, ‘ecosystem services supplied by Green Infrastructure (GI) include provisioning, such as the production of food and water; regulating, such as the control of climate and disease; supporting, such as nutrient cycles and crop pollination; and cultural, such as spiritual and recreational benefits’ (Comhar, 2010). An effective GI strategy creates a network of greenspaces that can improve the city’s adaptation to climate change, its resilience to extreme weather events and enhance the environment for urban residents (Baró et al., 2014). The value of GI is increasingly recognised in (inter)national policy instruments designed to improve the sustainability of urban development (Lennon, 2014). As an example, since 1997 a Green Area Ratio has been used in Berlin, Germany to evaluate the extent and quality of GI and a site sustainability metric (Keeley, 2011).
Here, our focus is on the environmental benefits of vegetation and, especially, of trees in cities. While all vegetation can provide benefits the magnitude of the contribution varies; for example, a grass roof with a thin soil substrate provides less hydrological benefit than a green park with a deep substrate. Trees, as the largest and most visible single components of GI, have a uniquely important environmental role in cities (Jim and Chen, 2009) partly because they can be integrated with other aspects of urban infrastructure like roads and paths. In addition they provide a suite of ecosystem services that other forms of vegetation cannot provide to the same degree (see Roy et al., 2012). These include:
1. Regulation of surface and air temperatures (e.g. Wang et al., 2016), 2. Control of storm winds and water (e.g. Armson et al., 2013), 3. Removal of atmospheric pollutants (e.g. Nowak et al., 2006) and, 4. Sequestration and storage of carbon (e.g. Strohbach and Haase, 2012). Many of these system services are linked to the species and age of the tree, which govern the area and seasonality of the leafy canopy. In general, the larger the plan area of the canopy, the greater the total leaf area exposed to the atmosphere.
Trees with higher leaf area can intercept more precipitation, cast a greater shadow area, provide more wind shelter and interact with a greater atmospheric volume. Leaves act as both interactive and passive surfaces. At leaf stomata, water vapour and carbon dioxide (CO2) are exchanged in the parallel processes of photosynthesis and evapotranspiration. However, this process also allows other gases such as sulphur dioxide (SO2) and nitrogen oxides (NOX) that are present in elevated concentrations in cities to enter leaf tissue (Morani et al., 2014). Leaves are also settling surfaces that scavenge particulate matter from the air (Kardell et
al., 2011). These are some of the reasons that the management of the population
of trees in cities (the ‘urban forest’) is advocated as a biotechnological solution to address environmental issues (Nowak, 2006).
A detailed analyses of the functions provided by the urban forest requires a census that records the locations, species, dimensions, and health of the tree stock. Such censuses are rare and are especially difficult to conduct in urban areas where tree planting has taken place over a considerable time and much of the stock exists in private gardens. For example, Ningal et al., (2010) studied the urban forest in the centre city of Dublin (that is, the 14.5 km2 enclosed between the Royal and
Grand canals). Using aerial imagery, over 10,000 trees were identified but detailed individual tree data was gathered for just the street trees, which comprised 25% of the total. Altogether the tree canopy covered 800 ha., or about 6% of the study area. More commonly, the urban forest and its functions are estimated from sample surveys. A recent survey in London used aerial imagery and randomly sampled at 12,000 points over an area of 1600 km2 to estimate total canopy cover at close
to 20% (GLA, 2015). These studies highlight the importance of the geographic boundary used to assess canopy cover, which can make comparisons difficult; Fuller and Gaston (2009) in a survey of green space cover in European cities found that the cover is largely a function of city area rather than the number of inhabitants.
There has been very little work on green infrastructure in Irish towns and cities that, in terms of urban form, are characterised by an abundance of low-density and often discontinuous urban fabric (Kasanko et al., 2006). Soil sealing in urban areas is generally low, with a tendency for only a small area at the centre to be highly sealed (Voorde et al., 2009). Urban green space in Irish urban areas can be a considerable proportion of the total, e.g. 24% of the total area of urban Dublin consists of green space (Brennan et al., 2009), with values of 34% and
20% reported for Cork and Galway respectively (Galway City Council, 2011, Cork City Council, 2014). However, to our knowledge, the work of Ningal et al., (2010) is the only study of trees and their ecosystem services in Ireland. In this study we examine the land-cover (including tree canopy and green coverages) in the centre of seven Irish cities: Belfast, Cork, Derry, Dublin, Galway, Limerick and Waterford.
Methodology
This research employed i-Tree Canopy to estimate tree canopy cover and its potential air quality benefits in the selected urban areas. Canopy is part of suite of i-Tree software tools1 developed by the US Forest Service to assess the ecosystem
services provided by urban forests. Canopy is an online tool used to assess land-cover proportions, specifically tree canopy land-cover, which is used to estimate the air quality functions provided by trees (Nowak et al., 2006). The steps for using
Canopy include:
Identifying a case-study area: A geographic boundary file is uploaded that identifies the area of interest. This allows the software to link with GoogleEarth and present the viewer with a plan area view of that area.
1. Creating land-cover categories: The user creates categories of land-cover, the simplest of which is tree and non-tree.
2. Generating a canopy database: Canopy generates a geographic point at random that is superimposed on the GoogleEarth image. The user categorises the feature under the sample point into the appropriate land-cover category. This process is repeated until such time as a sufficient geographic sample is taken.
Here, the land-cover in each city is assessed by superimposing a circular buffer area (radius of 1 km) with its origin in the geographic city centre. For some cities, such as Belfast and Dublin, this area represents a small proportion of the built-up urban area (Table 1) and largely captures the central city area (Figures 1 and 2a); as a result very large green areas (such as the Phoenix Park, for example) lie outside the study area. For other cities, such as Derry and Waterford (Figures 2c and 2f), the study area covers both the city centre and adjacent suburbs. So, what is the justification for selecting this buffer size?
First, selecting a standard area allows comparison between cities based on an enclosed area of 314 ha. The 1km radius is a reasonable walking distance for those living, working and visiting the city centre; for example, the guideline distance for people to walk to a bus stop2 is 400 m. Second, the highest traffic (emission)
and population (exposure) densities coincide in city centres and this is where the potential benefits for air quality are greatest; in other words, the need for tree cover to address the issues raised in the introduction is greatest in city centres. Third, 1 See https://www.itreetools.org/
from the perspective of distributing environmental services (such as managing flooding due to rainfall) it is canopy density at a place (%) that is relevant in
addition to overall canopy cover (m2). For these reasons, an assessment based on
a fixed area located in the city is reasonable. However, we acknowledge that this makes international comparisons more difficult.
In Canopy, eight land-cover categories were created: Grass, Shrub, Tree, Building, Road, Other Impervious, Water and Other (e.g. sand and rock). Each is readily identifiable in the available GoogleEarth images for the selected cities: ‘shrubs’ were distinguished from trees based on the shape of the canopy and its height as gauged by the relative length of shadows; ‘other impervious’ included all-weather pitches, pavements and car parks. All of the available images were taken in clear sky conditions during the growing season so that the vegetative canopies were clear. To assess land-cover, 5000 randomly selected points with each study area were classified, corresponding to a density of 16 per hectare (100 m2). These data were used to estimate the proportion of a given land-cover (p) and
its associated standard error (σp)3:
where N represents the number of sample points (5000) and is the number of points that correspond to that land-cover category.
Canopy estimates the air quality potential of urban trees using functions that
are based on canopy cover. The pollutants it considers include the common urban pollutants, namely: carbon monoxide (CO), nitrogen dioxide (NO2), ozone (O3), and particulate matter (PM) with diameters less than 2.5 μm (PM2.5), and less than 10 μm (PM10). In addition, the software calculates the annual carbon dioxide sequestration (CO2(sq)) and stored (CO2(st)) by the urban forest. In the following section, we present the results of the land-cover survey and the ecosystem potential provided by the canopy cover.
Results
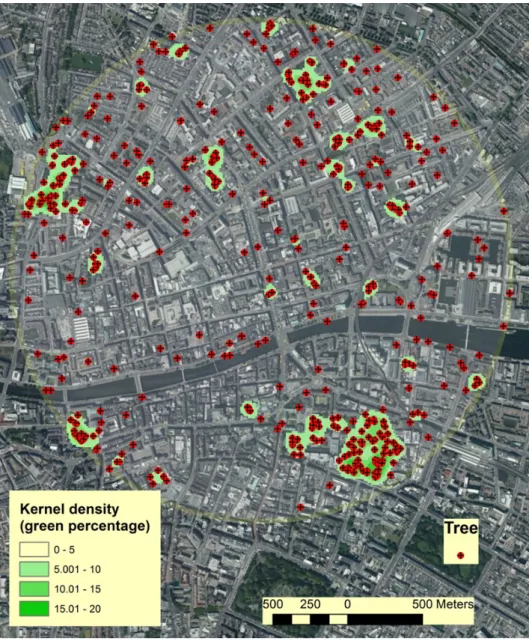
Figure 1 shows the distribution of the green area (that is, grass, shrub and tree) for the Dublin study area, expressed in terms of area density (%) and of the sample points that fall on tree canopies. The green cover percentage is estimated by applying a filter (kernel) across the mapped area at a resolution of 50m2. The
pattern shows patches of green across the city that corresponds to the location of public parks and institutions (note the two patches in the south-east of the city that correspond to Stephen’s Green and the Trinity College Dublin campus). The extent of overlap between the trees and the green areas is an indication of tree planting inside and outside of parks and gardens. Overall, excluding water cover, 9.5% of the study area is green and 85% is impervious (Table 1).
3 https://www.itreetools.org/canopy/resources/iTree_Canopy_Methodology.pdf
p = n/N
and
Figure 1. The Dublin city centre area study area as defined in i-Tree Canopy; 5000
randomly selected points within the study area were classified into land-cover types. The red symbols represent those sample points that fall on a tree canopy. The green areas represent the estimated green cover percent using a 50m2 kernel. from the perspective of distributing environmental services (such as managing
flooding due to rainfall) it is canopy density at a place (%) that is relevant in
addition to overall canopy cover (m2). For these reasons, an assessment based on
a fixed area located in the city is reasonable. However, we acknowledge that this makes international comparisons more difficult.
In Canopy, eight land-cover categories were created: Grass, Shrub, Tree, Building, Road, Other Impervious, Water and Other (e.g. sand and rock). Each is readily identifiable in the available GoogleEarth images for the selected cities: ‘shrubs’ were distinguished from trees based on the shape of the canopy and its height as gauged by the relative length of shadows; ‘other impervious’ included all-weather pitches, pavements and car parks. All of the available images were taken in clear sky conditions during the growing season so that the vegetative canopies were clear. To assess land-cover, 5000 randomly selected points with each study area were classified, corresponding to a density of 16 per hectare (100 m2). These data were used to estimate the proportion of a given land-cover (p) and
its associated standard error (σp)3:
where N represents the number of sample points (5000) and is the number of points that correspond to that land-cover category.
Canopy estimates the air quality potential of urban trees using functions that
are based on canopy cover. The pollutants it considers include the common urban pollutants, namely: carbon monoxide (CO), nitrogen dioxide (NO2), ozone (O3), and particulate matter (PM) with diameters less than 2.5 μm (PM2.5), and less than 10 μm (PM10). In addition, the software calculates the annual carbon dioxide sequestration (CO2(sq)) and stored (CO2(st)) by the urban forest. In the following section, we present the results of the land-cover survey and the ecosystem potential provided by the canopy cover.
Results
Figure 1 shows the distribution of the green area (that is, grass, shrub and tree) for the Dublin study area, expressed in terms of area density (%) and of the sample points that fall on tree canopies. The green cover percentage is estimated by applying a filter (kernel) across the mapped area at a resolution of 50m2. The
pattern shows patches of green across the city that corresponds to the location of public parks and institutions (note the two patches in the south-east of the city that correspond to Stephen’s Green and the Trinity College Dublin campus). The extent of overlap between the trees and the green areas is an indication of tree planting inside and outside of parks and gardens. Overall, excluding water cover, 9.5% of the study area is green and 85% is impervious (Table 1).
3 https://www.itreetools.org/canopy/resources/iTree_Canopy_Methodology.pdf
p = n/N
and
Green signatures of Irish cities
Figure 2 shows maps of green land-cover in the remaining six city centres and Table 1 compares each city in terms of land-cover. The green cover of Belfast city centre has a similar green cover to Dublin with large areas that are devoid of vegetation; the impervious surface cover here also accounts for 86%. By comparison, all of the remaining cities have between 38% and 37% green cover. Derry is the greenest city with a small road fraction (10%) and large tree canopy cover (16%). The only areas of the city that are mostly impervious correspond to the Bogside and Waterside districts on either side of the river Foyle.
Figure 2. The study area of each of the Irish cities; the legend is the same as that
The remaining cities (Cork, Galway, Limerick and Waterford) have similar green cover (28.5% – 31.2%) but are distinguished by its distribution. The green areas of Cork are confined mostly to its western side, while the east side close to the docks is largely impervious – the same is true for Galway, although it has significantly lower tree canopy cover (Table 1). Note, however, that the study area for Galway includes a large ‘Other’ category which corresponds mainly to the coastal landscape that is exposed at low tide; as a result, the available land area is about 250 ha, 50 ha less than is available in Cork. The green areas of Limerick city centre are largely confined to the residential areas outside the commercial/ docklands area to the south-east of the city centre. The green area of Waterford forms a ring around the city centre, which has maintained its medieval form with closely spaced buildings and narrow streets.
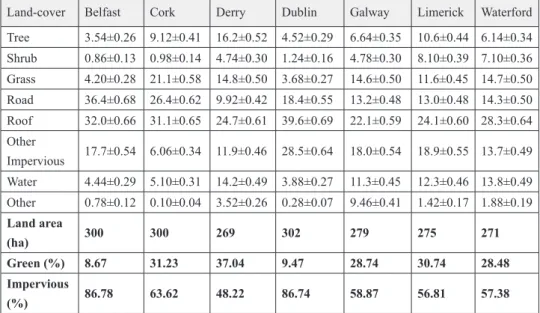
Land-cover Belfast Cork Derry Dublin Galway Limerick Waterford Tree 3.54±0.26 9.12±0.41 16.2±0.52 4.52±0.29 6.64±0.35 10.6±0.44 6.14±0.34 Shrub 0.86±0.13 0.98±0.14 4.74±0.30 1.24±0.16 4.78±0.30 8.10±0.39 7.10±0.36 Grass 4.20±0.28 21.1±0.58 14.8±0.50 3.68±0.27 14.6±0.50 11.6±0.45 14.7±0.50 Road 36.4±0.68 26.4±0.62 9.92±0.42 18.4±0.55 13.2±0.48 13.0±0.48 14.3±0.50 Roof 32.0±0.66 31.1±0.65 24.7±0.61 39.6±0.69 22.1±0.59 24.1±0.60 28.3±0.64 Other Impervious 17.7±0.54 6.06±0.34 11.9±0.46 28.5±0.64 18.0±0.54 18.9±0.55 13.7±0.49 Water 4.44±0.29 5.10±0.31 14.2±0.49 3.88±0.27 11.3±0.45 12.3±0.46 13.8±0.49 Other 0.78±0.12 0.10±0.04 3.52±0.26 0.28±0.07 9.46±0.41 1.42±0.17 1.88±0.19 Land area (ha) 300 300 269 302 279 275 271 Green (%) 8.67 31.23 37.04 9.47 28.74 30.74 28.48 Impervious (%) 86.78 63.62 48.22 86.74 58.87 56.81 57.38
Table 1. A classification of the land-cover in Irish city centres based on 5000
randomly selected points within a circular area (1 km radius) using the i-Tree Canopy software.
The values in each cell represent the percentage of points (and standard error) that correspond to that land-cover. The final three rows are the land area (that is the study area excluding water), the percentage of land area that is Green (that is, Tree or Shrub or Grass) and Impervious (Roof, Road and Other impervious).
The available land area in the largest cities (Belfast, Cork and Dublin) are nearly the same so that a direct comparison can be made. Of the impervious surface cover, the roof proportion is highest for Dublin (40%); the road cover is highest for Belfast (36%); and the other impervious cover is highest for Dublin (29%). Cork is distinguished by its relatively small proportion of other impervious cover and large grass cover.
Potential air quality benefits
In Irish cities, the observed ambient levels of pollution are generally quite low: Table 2 presents annual air pollution values where available. These data are based on fixed measurement sites and provide a sense of the ambient or background air quality. However, the pollutant concentration at a place will vary considerably over time and space; in particular, distance from roadways and traffic flow will exert a significant control on concentrations of CO, NO2 and PM especially, which are generated by vehicles. On the other hand, O3 is a secondary-pollutant that forms if primary (directly emitted), precursor pollutants are present; hence highest O3 concentrations are often found at some distance from the source of primary emissions. City NO2 O3 SO2 PM2.5 PM10 Belfast 30 40 20 * 19 Derry 15 45 6 * 19 Cork 27 52 6 8 19 Dublin 17-25 43-51 1-3 9 14
Galway, Limerick & Waterford 4-16 53-55 2-5 8-16 11-17
Table 2. Annual mean values (in μg m-3) for urban air pollutants in 2014 measured
at fixed stations. Data for Belfast and Derry is from DOENI (2015) and http:// www.airqualityni.co.uk/ and the PM2.5 data was not reported as concentrations were well below target values of 25. Data for other cities is from O’Dwyer and Delaney (2015) and those for Galway, Limerick and Waterford are general values provided for large towns. The ranges represent the different values recorded at air quality stations.
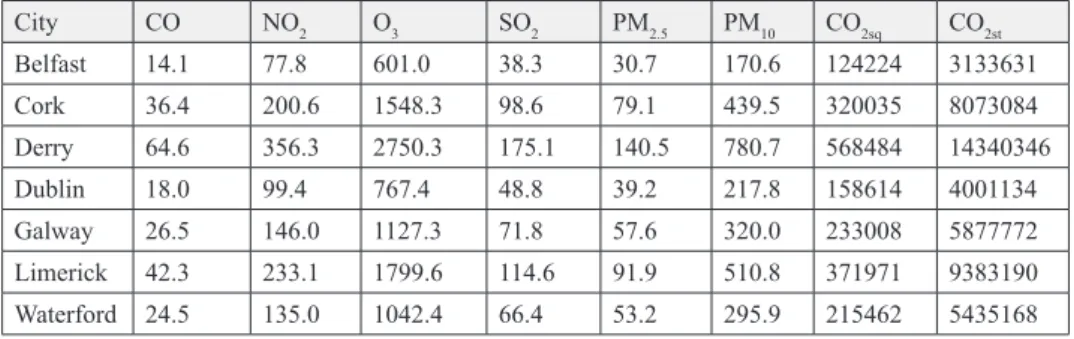
Table 3 presents the potential pollution removal (in kg yr-1) provided by each of
the city centre tree canopies. These estimates are based on multipliers derived from extensive research carried out on urban forests and ambient air quality in the US, which are employed in the i-Tree Canopy model.
City CO NO2 O3 SO2 PM2.5 PM10 CO2sq CO2st Belfast 14.1 77.8 601.0 38.3 30.7 170.6 124224 3133631 Cork 36.4 200.6 1548.3 98.6 79.1 439.5 320035 8073084 Derry 64.6 356.3 2750.3 175.1 140.5 780.7 568484 14340346 Dublin 18.0 99.4 767.4 48.8 39.2 217.8 158614 4001134 Galway 26.5 146.0 1127.3 71.8 57.6 320.0 233008 5877772 Limerick 42.3 233.1 1799.6 114.6 91.9 510.8 371971 9383190 Waterford 24.5 135.0 1042.4 66.4 53.2 295.9 215462 5435168 Table 3. Potential tree benefit estimates in kg pollutant removal based on i-Tree
It is important to emphasise the difference between potential and actual removal, which depends on the level of pollution in the atmosphere to which vegetation is exposed. For example, Derry, which has the most extensive tree canopy, is capable of removing over 350 kg of NO2 annually; as the annual mean ambient value is about 15 μg m-3, this indicates the canopy can clean about 23 km3
of air, if exposed.
Nevertheless, the estimated pollution removal provides a sense of the value of the canopy in each city and the potential to redress some of the emitted pollutants at a local level.
Benefits are estimated based on tree canopy area cover using the following multipliers in g m2 yr-1: Carbon monoxide (CO) 0.127; Nitrogen Dioxide (NO
2)
0.700; Ozone (O3) 5.404; Sulphur Dioxide (SO2) 0.344; Particulate matter less than 2.5 μm (PM2.5) 0.276 and less than 10 μm (PM10) 1.534; Carbon dioxide sequestered (CO2sq) 1,117; and Carbon dioxide stored (CO2st) 18,177.
The final two columns in Table 3 show the annual carbon dioxide sequestration (CO2sq) and stored (CO2st) by trees in each city. Carbon dioxide is not an air pollutant in the conventional sense as concentrations do not directly affect human health. However, CO2 is a greenhouse gas (GHG) and human use of fossil fuels has increased its global atmospheric concentration, which is the main anthropogenic driver of climate change. The ability of a tree to sequester CO2 is related to the size of the tree, which is linked to the size of the tree canopy – in other words, the largest trees with the largest canopies, sequester and store a far greater quantity of carbon than smaller trees. Given the high background concentration of CO2 (close to 0.775 kg m-3) the issue of proximity to the source of emissions is less critical
than is the case with other urban pollutants. However, it is reasonable to assess the contribution of urban forests to carbon mitigation; in this respect Dublin and Belfast city centres contribute the least, even though these are the places likely to emit the most. As a guideline, Codema (2010) estimates that Dublin City (115 km2) emits 5 million tonnes of CO
2 per year; if this were distributed evenly,
then the wider study area emits about 136,000,000 kg. In other words, the tree canopy in this area would need 850 years to sequester the current annual emission; alternatively, the existing tree stock stores 34 years of current emissions.
Discussion and Conclusion
Urban tree surveys (using Canopy) conducted in Britain show values that range from 15% in Manchester and Glasgow to over 20% in Birmingham and London (see Table 1 in Rogers and Jaluzot (2015)). It is likely that equivalent studies for Irish cities would yield similar values; however, these are city-scale assessments that do not capture the considerable spatial variation that occurs across the urban landscape. Here, the survey has used a buffer area of the same size located in each city centre to permit direct comparison; even still the range of city sizes shows the importance of scale in examining canopy cover. The city centres of Dublin and Belfast are dominated by commercial land-uses and have the lowest green cover and the lowest tree canopy cover; what GI is present is in the form of
street trees and public parks. In other cities, the study area includes low-density residential areas, where there are often large private gardens. This is clearest for Derry and Waterford, the smallest cities included in this study but it can also be seen in Limerick, where commercial development is concentrated to the south of the Shannon extending westward.
The focus on city centres here is justifiable as these are the most intensely urbanised parts of cities where both the air quality hazard and the population exposure is highest; this is where GI could yield the greatest benefits to citizens. As an indicator, there were approximately 40,000 people living in the Dublin study area in 2011 and 22,000 in the Cork study area. If the GI and tree canopy cover are expressed in terms of population, then the differences between cities becomes stark. Dublin has the lowest ratio of GI and canopy per capita, significantly lower than the values for Belfast (Table 4).
City Green area (ha) Tree canopy
(ha) Population in city centre Green per cap. Tree canopy per cap. Belfast 26.0 11.1 9199 0.28 0.12 Cork 93.7 28.6 22151 0.42 0.13 Derry 99.6 50.9 9282 1.07 0.55 Dublin 28.6 14.2 40385 0.07 0.04 Galway 80.2 20.8 11896 0.67 0.18 Limerick 84.5 33.3 15602 0.54 0.21 Waterford 77.2 19.3 11728 0.66 0.16
Table 4. The estimated total area (ha) and per capita area (m2 cap-1) of Green
Infrastructure and of tree canopy in the city centres of Irish urban areas. (The population resident within the city centre areas was estimated from the 2011 censuses of Northern Ireland and Ireland.)
The development plans of modern cities promote high density, well serviced, mixed-use neighbourhoods that include GI at the design stage. For example, the draft development plan for Dublin (2016-2022)4 states that ‘within the next 25
to 30 years, Dublin will be a beautiful, compact city, with a distinct character... It will be a socially inclusive city of urban neighbourhoods, all connected by an exemplary public transport, cycling and walking system and interwoven with a quality bio-diverse greenspace network’. Achieving the latter in an existing city centre environment presents a (re)design challenge. The options for greening must consider: creating urban parks, developing roof/wall gardens and tree planting. It is worthwhile examining the Dublin land-cover, as an example, to see what potential exists.
A greening strategy for Dublin city centre
Of the 302 ha of land area in the study area, 87% is built upon: 57 ha is road; 126 ha is roof and 89 ha is other impervious cover (Table 1). Of course, not all of this space is used and some is vacant or derelict; Dublin City Council estimates that there are about 63 ha of vacant land in the inner city, or about 4% of the total area5.
Making an urban park requires setting aside valuable land (in a conventional, economic sense) for recreational use; even where the owner is a public body, transformation to a park space is often allowed on a temporary basis only (e.g. see Moore-Cherry (2016) on Granby Park in Dublin). However, temporary interventions on disconnected sites are not ideal for the enhancement of the GI network or its functionality.
The considerable roof area suggests that a green roof strategy could form an important component of Dublin’s GI, especially as part of a sustainable urban design strategy to reduce urban runoff rates. These types of roofs are usually categorised into intensive and extensive types depending on the depth of substrate and the type of vegetation. Dublin City Council has examined the potential of green roofs and living walls based on the experiences of other cities (van Lennep and Finn, 2008) but there has been no formal assessment of its potential within the city. While green roofs may be appropriate for the provision of some GI services, they are unlikely to increase tree canopy cover as intensive green roofs that impose significant additional load on buildings, would be required.
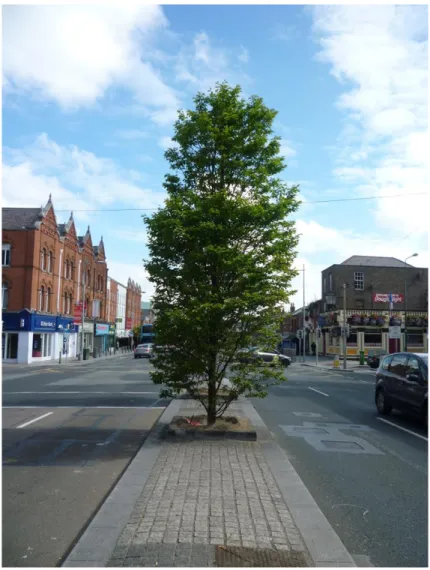
The large proportion of existing impermeable ground cover would allow an enhanced tree planting programme; unlike parks, they can be located with other built elements and address place-specific issues such as wind shelter and air quality. In densely built environments like urban centres, the installation of additional tree stock can be challenging, owing to the potential disruption to underground infrastructure, pavements and roads. However, new stock can be implemented through innovative urban design, in which trees form part of new or existing urban elements (e.g. see Figure 3). Additionally, instead of permanently emplacing trees within a street, trees can be placed and replaced using large planting boxes; this approach allows a rapid deployment of new urban forestry assets to vacant areas (examples can be observed in several locations in Dublin6 and Derry7). An urban
forestry approach should take into account the diversity of the existing tree stock (species and age), the ‘gaps’ in spatial coverage and the need (e.g. pedestrian routes). Addressing these issues results in a policy for planting the ‘right tree in the right place at the right time’ (Nowak, pers. comm.) as the path to a sustainable urban forest. 5 http://www.irishtimes.com/news/environment/dublin-city-audit-finds-282-vacant-sites-ahead-of-land-hoarding-levy-1.2123606 6 http://www.dublincity.ie/main-menu-your-council-your-area-south-east-area-grafton-street-quar-ter/clarendon-street-clarendon 7 http://www.externalworksindex.co.uk/entry/113149/IOTA/Derry-City-Council-Bespoke-granite-tree-planters/
Figure 3. Example of street trees integrated into an urban setting. These trees
are planted along a road median in Dorset Street in central Dublin. This road experiences very high traffic flows and the trees provide some air quality functions, such as particulate removal. (Credit Tine Ningal, UCD.)
Conclusion
Sustainable urban planning stresses the value of green infrastructure to meet environmental, social and economic targets. However, despite the rhetoric in urban development plans, there is little evidence in most Irish city centres of a coordinated approach to creating a quality bio-diverse greenspace network. Such networks would take account of the existing built/green ratios to inform strategy. The best approach for Dublin, with a high roof fraction, may be different from Belfast with a high non-roof impervious fraction; elsewhere there may be ample available green space (e.g. Galway and Cork) yet much of it is grassland which
provides a more limited array of ecosystem functions than trees. What is needed nationally is a comprehensive survey of urban forests to inform the GI strategies of cities.
References
Armson, D., Stringer, P. and Ennos, A.R., 2013. The effect of street trees and amenity grass on urban surface water runoff in Manchester, UK. Urban Forestry
& Urban Greening 12, 282-286.
Baró, F., Chaparro, L., Gómez-Baggethun, E., Langemeyer, J., Nowak, D. and Terradas, J., 2014.
Contribution of Ecosystem Services to Air Quality and Climate Change Mitigation Policies: The Case of Urban Forests in Barcelona, Spain. Ambio 43, 466-479. Benedict, M.A. and McMahon, E., 2006. Green infrastructure: Linking landscapes
and communities. Island Press, Washington, DC.
Brennan, M., McInerney, D.O., Hochstrasser, T. and Hayden, T., 2009. Landuse change in Dublin: perspectives and consequences of urban greenspace change within the city between 1990 and 2006. Urban Institute Ireland Working Paper
Series 09/02, 8pp.
Codema, 2010. Dublin City Sustainable Energy Action Plan 2010 – 2020. Available at http://www.dublincity.ie/
Comhar, 2010. Creating Green Infrastructure for Ireland Enhancing Natural
Capital for Human Wellbeing. Comhar Sustainable Development Council.
Available at: http://www.heritagecouncil.ie/fileadmin/user_upload/Planning/ LCA_CPD/LCA_CPD_Sep_2011/Reports/Comhar_Green_infrastructure_ report_final.pdf
Cork City Council, 2014. European Green Capital Award Application for 2017. Cork. Penrose Wharf Business Centre, Penrose Wharf, Cork. EPA, 2012.
Ireland’s Environment: An Assessment.
Fuller, R.A. and Gaston, K.J., 2009. The scaling of green space coverage in European cities. Biology Letters, 5(3), pp. 352-355.
Galway City Council, 2011. Galway Development Plan: 2011-2017. Galway, Galway City Council.
GLA, 2015. Measuring tree canopy in London: An analysis using aerial imagery. Available at: https://www.london.gov.uk/sites/default/files/measuring_tree_ canopy_cover_2015.pdf.
Grimm, N.B., Faeth, S.H., Golubiewski, N.E., Redman, C.L., Wu, J., Bai, X. and Briggs, J.M., 2008.
Global change and the ecology of cities. Science 319(5864), 756-760.
Jim, C.Y. and Chen, W.Y., 2008. Assessing the ecosystem service of air pollutant removal by urban trees in Guangzhou (China). Journal of Environmental
Management 88:665-676.
Jim, C.Y. and Chen W.Y., 2009. Ecosystem services and valuation of urban forests in China. Cities 26:187-194.
saturation isothermal remanent magnetization (SIRM) as a proxy for particulate matter monitoring: inter-species differences and in-season variation. Atmospheric
Environment, 45(29), 5164-5171.
Kasanko, M., Barredo, J.I., Lavalle, C., McCormick, N., Demicheli, L., Sagris, V. and Brezger, A., 2006. Are European cities becoming dispersed?: A comparative analysis of 15 European urban areas. Landscape and Urban Planning 77, 111-130.
Keeley, M., 2011. The Green Area Ratio: an urban site sustainability metric.
Journal of Environmental Planning and Management, 54(7), 937-958.Lennon,
M., 2014. Green infrastructure and planning policy: a critical assessment.Local
Environment 20, 957-980.
Liekens, I., De Nocker, L., Broekx, S., Aertsens, J. and Markandya, A., 2013.
Ecosystem services and their monetary value. Ecosystem services: global issues local practices, 1st edn. Elsevier, New York, 13-28.
Moore-Cherry, N. (2016) Beyond art in ‘meanwhile spaces’: Temporary parks, urban governance and the co-production of urban space in Murzyn-Kupisz, M. and Działek, J. (Eds.) The Impact of Artists on Contemporary Urban
Development in Europe. Netherlands: Springer. Forthcoming.
Morani, A., Nowak, D., Hirabayashi, S., Guidolotti, G., Medori, M., Muzzini, V., Fares, S.,
Mugnozza, G.S. and Calfapietra, C., 2014. Comparing i-Tree modeled ozone deposition with field measurements in a periurban Mediterranean forest.
Environmental Pollution, 195, 202-209.
Ningal, T., Mills, G. and Smithwick, P., 2010. An inventory of trees in Dublin city centre. Irish Geography, 43(2), 161-176.
Northern Ireland Statistics and Research Agency, 2011 Census: Aggregate data
(Northern Ireland).
UK Data Service Census Support. Downloaded from: http://infuse.ukdataservice. ac.uk.
Nowak, D.J., 2006. Institutionalizing urban forestry as a ‘biotechnology’ to improve environmental quality. Urban Forestry and Urban Greening, 5, 93-100.
Nowak, D.J., Crane, D.E. and Stevens, J.C., 2006. Air pollution removal by urban trees and shrubs in the United States. Urban Forestry and Urban Greening, 4(3), 115-123.
Rogers K. and Jaluzot A., 2015. Oxford i-Tree Canopy Cover Assessment 2015. Available at http://www.urbantreecover.org/wp-content/uploads/2015/08/ Oxford-Canopy-Report.pdf.
Roy, S., Byrne, J. and Pickering, C., 2012. A systematic quantitative review of urban tree benefits, costs, and assessment methods across cities in different climatic zones. Urban Forestry and Urban Greening, 11, 351-363.
Strohbach, M.W. and Haase, D., 2012. Above-ground carbon storage by urban trees in Leipzig,
104, 95-104.
United Nations, 2016. World Urbanization Prospects. Retrieved 27th January 2016. United Nations: World Urbanization Prospects.
Van Lennep, E. and Finn, S., 2008. Green Roofs Over Dublin: A Green Roof
Policy Guidance Paper For Dublin. Draft guidelines for DCC to develop
planning directives for the incorporation of Green Roofs in new development. Available at:http://www.sdcc.ie/sites/default/files/publications/dcc-green-roof-draft-guidelines-sept-2008.pdf
Voorde, D., Van, T., Canters, F., Van der Kwast, J., Engelen, G., Binard, M. and Cornet, Y., 2009. Quantifying intra-urban morphology of the Greater Dublin area with spatial metrics derived from medium resolution remote sensing data. In. IEEE (Eds) Joint Urban Remote Sensing Event, 1-7.
Wang, Z.-H., Zhao, X., Yang, J. and Song, J., 2016. Cooling and energy saving potentials of shade trees and urban lawns in a desert city. Applied Energy, 161, 437-444.