Determination of polybrominated diphenyl ethers in water at ng/L level by a simple DLLME–GC–(EI)MS method
Mónica S. F. Santos*, José Luís Moreira**, Luís M. Madeira*, Arminda Alves*, 1
*
LEPABE, Faculty of Engineering of the University of Porto, Rua Dr. Roberto Frias, 4200-465 Porto, Portugal.
**
Department of Chemical Engineering, Faculty of Engineering of the University of Porto, Rua Dr. Roberto Frias, 4200-465 Porto, Portugal
1
Abstract – Dispersive liquid-liquid microextraction (DLLME) is an extraction procedure
gaining popularity in the recent years due to the easiness of operation, high enrichment factors, low cost and low consumption of organic solvents. This extraction method, prior to gas chromatography with mass spectrometry detection (GC-MS), was optimized for the analysis of polybrominated diphenyl ethers (PBDEs) in aqueous samples. These were extracted with chlorobenzene (extraction solvent) and acetonitrile (dispersive solvent), allowing an enrichment factor of about 470 for BDE-100. The calibration curve for BDE-100 was linear in the range of 0.005-10 μg/L, with an average reproducibility of 12% (RSD %). The LOD, calculated by the signal-to-noise ratio, was 0.5 ng/L for BDE-100 and the recovery ranged from 91-107% for all spiked samples. Relative expanded uncertainty was concentration-dependent, reaching high values near the limit of quantification and decreasing until 14% for concentrations higher than 1 µg/L of BDE-100. The dispersive liquid-liquid microextraction combined with gas chromatography with mass spectrometry detection (DLLME-GC-MS) method could be successfully applied to the determination of other PBDEs in water samples.
Keywords: dispersive liquid-liquid microextraction, gas chromatography with mass
PBDEs are widely used in commercial products such as furniture, textiles, plastics, paints and electronic equipments to reduce ignition and burning, acting as additive flame retardants due to their low cost and high-performance. The family of PBDEs consists of 209 congeners (C12H10-xBrxO where x = 1, 2, …, 10). The main commercial mixtures, penta-, octa- and deca-BDE, contain a limited number of congeners, respectively BDE-99/47/100/153/154, BDE-183/197/196/207 and BDE-209/206, in order of decreasing percentage [1]. These commercial mixtures differ in the content of specific PBDEs congeners, which in turn differ in their bioavailability, bioaccumulation and toxicological properties. As they are not chemically bound, these chemicals can leach out of the products/materials in which they are applied. As a result of their potential to accumulate in the environment, the EU has agreed to ban the marketing and use of penta- and octa-BDE from 1 July 2004. Only deca-BDE is allowed, and therefore EU and USA industries have ceased the penta- and octa-BDE manufacturing. There is however no maximum admissible level for these compounds in water set by the European Community.
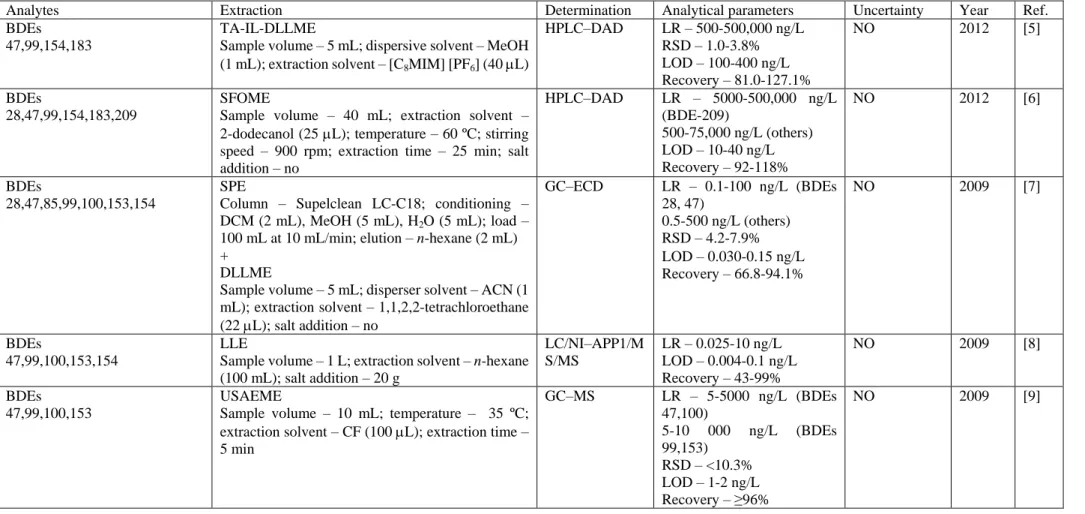
Analytical methods for PBDEs in waters are complex and laborious, due to the necessity of using a pre-concentration step. This pre-concentration step is always needed in order to reach detection limits (LODs) low enough to determine the ultra-trace levels at which PBDEs are present in water (normally within the ng/L or low g/L range) [2-4]. The analytical methods found in the literature for PBDEs quantification in water matrices are compiled in Table 1 [5-18]. Concerning the chromatographic techniques, gas chromatography with electron-capture detection (ECD) [7] or mass spectrometry (MS) detection [9, 10, 14-18] are the most widely used for the determination of PBDEs in water
samples, but high-performance liquid chromatography with diode array (HPLC-DAD), ultraviolet (UV) or MS detectors may be also applied [5, 6, 8, 11-13]. Methods that use liquid chromatography generally lead to higher LODs (10-700 ng/L). The LLE-HPLC-MS-MS method conducts to lower LODs but the equipment is rather expensive, a high sample volume is required (1 L) and significant amounts of organic solvents (not environmentally friendly) are typically used, which restrains this method for monitoring applications.
Solid phase extraction plus DLLME is another method used for the extraction of PBDEs from water and plant samples [7] presenting low LOD but with the disadvantages of requiring high sample volume and laborious experimental procedure. On the other hand, the ECD detector used does not allow the identification of the compounds, which may represent a problem if any undesired interference co-elutes with target analytes.
A great variety of recent extraction techniques was applied prior to GC-MS: ultrasound-assisted emulsification-microextraction (USAEME) [9], cloud point extraction (CPE) with ultrasound assisted back extraction (UABE) [10], hollow-fiber liquid phase microextraction (HF-LPME) [14], hollow-fiber microporous membrane liquid-liquid extraction (HF-MMLLE) [15], microwave assisted extraction (MAE) [16], stir bar sorptive extraction (SBSE) [17] and headspace solid phase microextraction (HS-SPME) [18]. Almost all of these methods use low sample volume. This is also particularly important if the analytical method is designed to be applied, for instance, in degradation or sorption experiments, where small amounts of samples are taken along the time.
Although advantages are recognized to each of the described methods, some drawbacks are also pointed out. For instance, some methods are rather laborious, which increases the time of analysis [10, 17], while other present lower precision [14, 15], as reported elsewhere [9, 19], or require higher sample volumes (up to 1.5 L) [16]. Finally, carry-over phenomena have also been pointed as a disadvantage for SBSE and HS-SPME [17, 18]. Therefore, the search for a simple and inexpensive method, applicable either to environmental monitoring or degradation/sorption studies of PBDEs in aqueous samples (which require small volumes of sample and quick response) justifies the choice of DLLME.
DLLME technique has gained a great popularity due to the easiness of operation, rapidity, low time and cost, high recovery and enrichment factor [11]. The application of this promising technique for PBDEs determination in water samples is still very limited. Up to the author’s knowledge, only three analytical methodologies, based exclusively on DLLME as extraction technique, were found in the literature for such purpose [5, 11, 12]. All of them use detectors (HPLC-DAD and HPLC-UV) that do not allow an unequivocal compound confirmation. Furthermore, the LODs obtained by these methods (12-400 ng/L) are in general not compatible with the requirements for monitoring purposes. The most recent DLLME method uses ionic liquids as extraction solvent (TA-IL-DLLME), but the use of such ionic liquids, with too high viscosity, represents an important trouble for the direct injection in the liquid chromatograph.
Therefore, the proposed analytical methodology intends to overcome some drawbacks of the determination of PBDEs at ng/L level by using DLLME as a quick and easy
extraction step, that requires low sample volume, hyphenated to mass spectrometry detection. On the other hand, this study presents for the first time a complete set of validation parameters, including the calculation of the expanded uncertainty associated to the results in the range of quantification.
EXPERIMENTAL
Reagents. 2,4,4’-tribromodiphenyl ether (BDE-28), 2,2´,4,4’-tetrabromodiphenyl ether
(BDE-47), 2,2’,3,4’,4-pentabromodiphenyl ether (BDE-85), 2,2’,4,4’,5-pentabromodiphenyl ether (BDE-99), 2,2’,4,4’,6-pentabromodiphenyl ether (BDE-100), 2,2’,4,4’,5,5’-hexabromodiphenyl ether (BDE-153),
2,2’,4,4’,5,6’-hexabromodiphenyl ether (BDE-154),
2,2’,3,4,4’,5’,6-heptabromodiphenyl ether (BDE-183) as 50 mg/L solutions in isooctane were obtained from Sigma-Aldrich (St. Louis, MO, USA). Distilled water was used for standards preparation. Acetonitrile (ACN), acetone (AC) and methanol (MeOH) of LC-MS grade were obtained from VWR (Porto, Portugal). Chlorobenzene (CB) of analytical grade and dichloromethane (DCM) for pesticide residue analysis were purchased from VWR (Porto, Portugal). Carbon tetrachloride (CTC) and chloroform (CF) were p.a. from Merck. 1,1,2,2-Tetrachloroethane (TCE) was reagent grade from Aldrich.
Standard solutions and samples. Stock solutions were prepared by evaporating an
appropriate amount of each analytical standard under a gentle nitrogen flow. Then, the residue was redissolved in ACN. Aqueous standard solutions were prepared daily by
evaporating an appropriate amount of stock solution under nitrogen flow and resuspending the residue in 25 mL of water. The homogenization of standards was promoted by vortex. A calibration curve with 12 BDE-100 standards extracted by DLLME, as described below, was obtained from 0.005 to 10 μg/L.
Three different types of water samples were used: a natural river water (collected from Sousa River, Portugal), tap water (from our laboratory located at the Northern region of Portugal, a relatively hard water, pH 6.90, TOC 2.3 mg/L) and a mineral water (commercial water with pH 6.39, TOC 1.1 mg/L). All types of water were filtered (VWR quantitative filter papers with particle retention between 5-10 m – West Chester, USA) and stored in amber glass bottles, at -20 ºC, protected from light until they were processed. Preliminary tests did not reveal any retention in the filters used.
Instrumentation. PBDEs were determined by a Varian 4000 GC-MS Chromatograph.
The mass spectrometer was operated in the electronic impact ionization (EI) mode. The temperatures for the injector, trap, transfer line and manifold were held respectively at 290, 200, 250 and 50 ºC. A DB-5MS column was used (30 m × 0.25 mm ID × 0.25 µm film thickness; Walnut Creek, CA, USA) and the oven temperature was programmed as follows: initial stage at 60 ºC for 2 min, heating 30 ºC/min to 250 ºC, then 5 ºC/min until 300 ºC and held for 8 min. The injected volume was 1 L and a 701N Hamilton syringe was used. Carrier gas was Helium (99.9999 %) at 1 mL/min flow rate. Monitoring ions in the selected ion-monitoring mode (SIM) are listed in Table 2. The identification of the compounds was done by comparison of the retention times with those obtained for
directly injected standard solutions. All PBDEs were injected separately under the optimized conditions described below.
DLLME procedure. Extractions were performed in 50 mL plastic screw-cap test tubes
with conical bottom. An aqueous sample (25 mL) was extracted with given volumes of different dispersive and extraction solvents; optimized conditions were 1 mL of ACN and 80 l of CB. The mixture was centrifuged for 5 min at 4000 rpm in a Hettich Rotofix 32A Centrifuge. The sedimented phase was collected with a syringe and injected in the GC-MS.
Validation parameters. Precision was evaluated by extracting 3 independent standards
at 3 concentration levels: 0.01, 1 and 10 μg/L, and 3 independent spiked samples (tap, drinking and river water) at three concentration levels: 0.01, 1 and 10 μg/L. Accuracy (extended trueness) was evaluated by standard addition method using tap, drinking and river waters spiked with BDE-100 at the same three concentration levels.
RESULTS AND DISCUSSION
This work comprised a previous optimization of the extraction method by DLLME, followed by the validation of the analytical methodology, with special care to the estimation of the expanded uncertainty associated to the results.
Optimization of DLLME. The effect of some critical parameters on the DLLME
dispersive solvents, extraction time and salt addition. For such purpose, BDE-100 was selected as a model compound to evaluate in which manner the extraction process was affected by such parameters. So, all results obtained in this section were carried out with aqueous solutions containing 1 g/L of BDE-100. The final conditions were afterwards applied to the other PBDEs. To better understand the effects of the above-mentioned parameters on the DLLME performance, enrichment factors (EF) and extraction recoveries (%ER) were determined:
0 / C C EF sed (1) 100 ) /( ) ( %ER CsedVsed C0Vaq (2)
where C0 and Vaq are the BDE concentration and volume of aqueous solution samples and
Csed and Vsed the BDE concentration and volume of the sedimented phase.
All experiments were performed in triplicate and the samples were injected in the GC–MS at least twice.
Effect of extraction and dispersive solvents The kind of extraction and dispersive solvent
is crucial in the extraction efficiency by DLLME [19]. The extraction solvent must display high extraction capability for the analytes, higher density than water, good chromatographic behavior and low water solubility [11, 12, 19]. Typically, halogenated hydrocarbons are used due to their high density [19, 20]. On the other hand, the selection of the dispersive solvent should take into account its miscibility both in water and in the
extraction solvent. The commonly used dispersive solvents include MeOH, ethanol, ACN, AC and tetrahydrofuran [19]. Usually, the selection of extraction and dispersive solvents is made separately but the result may be compromised. In this study, this selection was made jointly to determine which set of solvents leads to a higher extraction efficiency. Therefore, the combined effect of four extraction solvents (CTC, CB, DCM and CF) and three dispersive solvents (AC, MeOH and ACN) on DLLME performance was studied. TCE was also tested as extraction solvent with ACN but this set of solvents proved to be aggressive for some components of the equipment used, such as the GC injection syringe, and therefore was discarded.
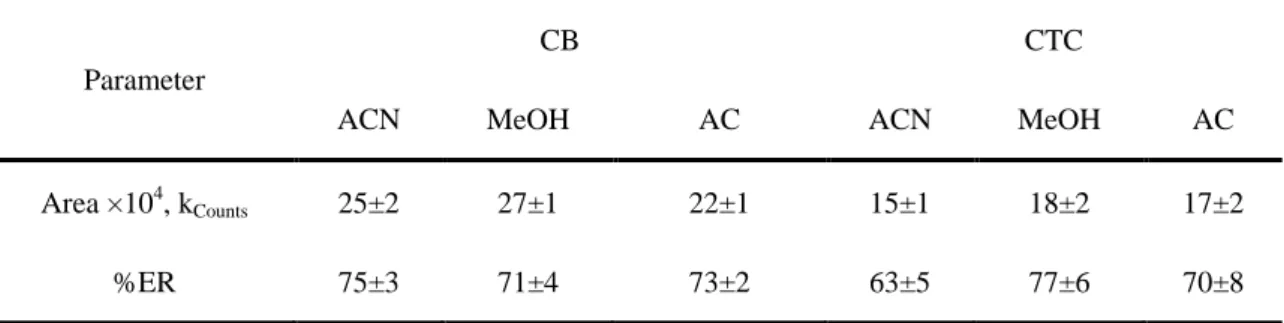
The experiments were performed using 1 mL of dispersive solvent containing 100 L of extraction solvent (Table 3). The analytical responses obtained for the extracted samples were compared to those obtained for standards prepared in the same solvent. DCM and CF were automatically discarded because the formation of two phases was not observed under the conditions employed and using the mentioned dispersive solvents. Although similar extraction recoveries were attained for both extraction solvents (CTC and CB), CB was chosen because it gave higher analytical response. This last point is very important specifically in the quantification of trace compounds like PBDEs. On the other hand, CTC leads to higher variation coefficients and has a lower boiling point, which could represent a relevant source of error.
Yanyan Li et al. [11] used TCE and ACN as extraction and dispersive solvents, respectively. This set of solvents led to higher extraction efficiencies (extraction recovery of around 103%), but injections were made manually in the HPLC due to the aggressive character of the solvent mixture, which may contribute to the decrease of precision. The
same problem arose when this organic solvent was applied jointly with tetrahydrofuran (dispersive solvent) for BDE-209 determination in water [12].
Concerning the dispersive solvent, although CB showed good results when combined with AC, higher reproducibility was obtained with ACN, probably due to less leaks of solvent by evaporation and therefore ACN was the selected as dispersive solvent.
Effect of the extraction solvent volume To examine the effect of the CB volume on the
extraction process performance, BDE-100-containing aqueous samples were submitted to the same DLLME procedure by using 1 mL of ACN containing different volumes of CB (80, 100, 150 and 200 L). Chlorobenzene volumes below 80 L were not considered because a minimum safety volume of 40 L was set for the sedimented phase. Fig. 1a depicts the extraction recovery and the enrichment factor versus CB volume. As shown in Fig. 1a, the enrichment factor decreases and the recovery remains constant as the CB volume increases. Indeed, it was noticed that an increase in the volume of the extraction solvent did not allow the transfer of a higher mass of analyte to the sedimented phase and, for that reason, the concentration in such a phase decreased. Since the concentration in the sedimented phase decreased in the same proportion as the increase of the extraction solvent volume, the extraction recovery remains constant and the enrichment factor decreases, as indicated in Fig. 1a. The same behavior was observed by other authors who implemented DLLME technique to determine a huge number of target compounds in different matrices [11, 12, 19, 21]. Therefore, 80 L of CB was selected as the optimum volume.
Effect of dispersive solvent volume The dispersive solvent is directly responsible for the
formation of the cloudy solution and, by this way, its volume may compromise the degree of dispersion of the extraction solvent in the aqueous phase [19]. To evaluate the effect of dispersive solvent volume, the experimental tested conditions included the use of 0.5, 1.0, 1.5 and 2.0 mL of ACN, containing 80 L of CB. Although the extraction solvent volume added was 80 L, due to the miscibility of this solvent with the dispersive solvent and water phase some losses occurred and the volume of the sedimented phase was smaller than 80 L. For that reason, a concentration factor of approximately 470 was obtained (Fig. 1b). This observation is in line with many papers [22]. The results in Fig. 1b also show that neither the extraction recovery, nor the enrichment factor was significantly affected by the volume of ACN. Other authors found an optimum value of dispersive solvent volume, but with different sample volumes used (5 mL instead 25 mL) for the same dispersive solvent volumes tested here [5, 11, 12, 21]. So, 1 mL of ACN was chosen for the subsequent experiments because it leads to more precise results (lower coefficient of variation).
Effect of extraction time In DLLME, the extraction time is defined as the interval between
the injection of the extraction and dispersive solvents mixture and the centrifugation step. One remarkable advantage of this extraction technique is the short time needed to transfer the analyte from the aqueous phase to the organic one and thus, to reach the equilibrium stage [19]. It is important to study the effect of this parameter because the extraction time can influence significantly the extraction efficiency [23]. The extraction recoveries obtained from aqueous solutions submitted to the same DLLME procedure and different
extraction times (0, 10, 15 and 30 min) are shown in Fig. 1c. As observed, the extraction time has no impact on the extraction efficiency within the interval of times selected. Longer times were not considered, because the aim is to obtain a rapid extraction with acceptable efficiency; the most time-consuming step is the centrifuging, which lasts about 5 min. This is an important aspect since it marks the great advantage of this extraction technique against the others presented in the introduction section. Similar results were also achieved by other researchers [11, 12, 21], meaning that the mass transfer is very fast, occurring during the injection of the solvents/start-up of the centrifuge.
Effect of salt addition The increase of the aqueous sample ionic strength by salt addition
may cause opposite consequences on the recovery. Firstly, an increase of the ionic strength can lead to a decrease of analyte and extraction solvent solubilities in the aqueous phase, which may contribute positively to the extraction process recovery [19]. However, the volume of sedimented phase increases by increasing ionic strength and thus, the analyte concentration decreases [19]. The ionic strength was evaluated adding 0–5% (w/v) sodium chloride to the aqueous solution. Under such conditions, no significant salt addition effect on the DLLME performance was observed (Fig. 1d). Similar results were obtained by other authors [7, 24, 25]. Consequently, the following experiments were performed without the addition of salt.
Quantitative analysis. Quantitative analysis of contaminants as BDE-100, or ultra-trace
contaminants in water samples, is usually necessary for different objectives. The most important is to allow the monitoring of waters in different environmental media (rivers,
lakes, drinking and tap water, etc.) and for that, the main purpose of the validation is to obtain the lowest quantification limit possible. However, other objectives include the quantification of the contaminants for sorption and degradation studies, or other, where normally higher concentrations are used. In this case, it is acceptable to reach somewhat higher quantification limits, but the limiting factor is the available sample volume, because most of the time batch experiments are carried out and samples have to be taken along the process time. Therefore, analytical methods have to be able to quantify the contaminants at low levels, using low sample volumes. In these cases, the estimation of the uncertainty of the results plays an important role, because models will be constructed. The combination of low quantification limits with low sample volume will have an impact on the uncertainty of the results.
The validation of the analytical method, including the uncertainty measurement, followed the bottom-up approach described in EURACHEM CITAC Guide [26] and by other authors [27-29]. It comprised a first step of in-house validation, where the main parameters were obtained – linearity of the response (using standards extracted in the same mode as samples), limit of detection, limit of quantification (LOQ), precision and accuracy. The second step was the estimation of the expanded uncertainty associated to the results.
Response linearity and detection and quantification limits Calibration was performed for
BDE-100 by DLLME-GC-MS using 12 standards extracted in the same conditions as the samples (from 0.005 to 10 g/L). The correlation coefficient (0.9997) and the linearity tests revealed a good performance for the linearity. The LOD and LOQ were calculated based on a signal-to-noise-ratio of 3 and 10, and they were found to be 0.5 and 2 ng/L,
respectively. Compared with other techniques reported in the Introduction, the obtained LOD is lower or, at least, of the same order of magnitude.
Precision and Accuracy The precision was evaluated by repeatability and intermediate
precision at three BDE-100 concentration levels – 0.01, 1 and 10 g/L. Repeatability corresponds to the relative standard deviation (RSD%) observed when one sample is injected six times in the same day under the same conditions. Repeatability expressed as RSD% was 7, 5 and 3% for 0.01, 1 and 10 g/L. Intermediate precision was analyzed extracting three independent standards (ultrapure water) and spiked samples (drinking, tap and river water) at three concentration levels (Table 4). Average precision, expressed as RSD, was 12% for standards and 13%, 12% and 10% for spiked drinking, tap and river waters, respectively.
Accuracy (extended trueness) was evaluated by the percentage of recovery for spiked samples (drinking, tap and river water) because nor the reference materials, neither interlaboratory or proficiency studies, were available. Recoveries were on average higher than 91% and lower than 107% for all spiked sample considered (Table 4). The good recovery results and the low RSDs observed enable an accurate evaluation of BDE-100 in the tested samples, even at the lowest level assessed.
The analytical response for standards prepared in ultrapure water was compared to the response obtained for spiked drinking, tap and river waters at the same concentration levels. It was observed that the analytical response is almost independent of the type of water used, meaning that there is no matrix effect.
Estimation of the expanded uncertainty associated to the results According to the bottom-up approach described in the EURACHEM CITAC Guide, four individual
sources of uncertainty (U1, U2, U3 and U4) were taken into account to estimate the combined standard uncertainty (u ) [26]: c
2 2 2 2 4 3 2 1 U U U U uc (3)
The individual sources of uncertainty are the following: 1
U – The uncertainty associated with the preparation of the standards (it was estimated
using the error propagation law for the different dilution steps from the stock standard solution):
(4)
where mi is the error associated with the measurement of a certain parameter and mi
is the measured value.
2
U – The uncertainty associated with the calibration curve which was obtained from 12
BDE-100 standards extracted by DLLME as samples (it was calculated for the different concentration levels of the standards):
i i x y o o o x x a y yo n m a s x x sx U 2 _ 2 2 _ / ) ( ) ( 1 1 1 2 (5) 2 1
i st mi mi U Uwhere 2 ) ˆ ( 2 /
n y y s i i i x y , (6) 0sx is the standard deviation of the concentration x , a is the slope of the calibration 0
curve, m is the number of replicates performed, n is the number of standards of the calibration curve, yˆ are the y values calculated by the calibration curve from x i
values, y0 is the average of the yˆ values,i
_
y is the average of the y values i
(experimental values), x is the concentration of standards used in the calibration curve i
and _
x is the average of the x values. i
3
U – The uncertainty associated with the precision of the extraction and also of the chromatographic method: n y s U med 3 (7)
where s is the standard deviation of precision assays, ymed is the average of the y values obtained for each concentration and n is the number of assays.
4
U – The uncertainty associated with the accuracy (it was calculated as the average
n s
U4 () (8)
where s() is the RSD of the average percent recovery and n is the number of assays.
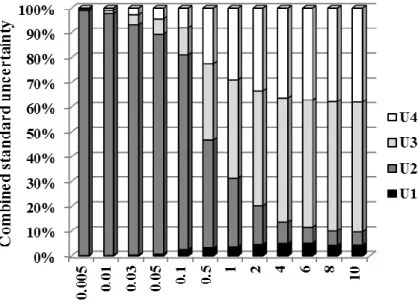
To provide an interval within which the value of the measurand is believed to lie with a higher level of confidence, an expanded uncertainty (U ) should be used [26]. So, the expanded uncertainty (U ) was obtained for an approximate level of confidence of 95% by a coverage factor of 2 [26]. Fig. 2a shows the contribution of each uncertainty source for the combined standard uncertainty (u ). As can be seen, the uncertainty associated c
with the calibration curve ( U2 ) is the most significant contribution at lower concentrations, showing the importance of this estimation. For higher concentrations, the uncertainty associated with the precision (U3) and accuracy (U4) exhibit more importance for the combined standard uncertainty (u ). From Fig. 2b, it can be observed c
that the relative expanded uncertainty decreases from 22 to 14% for BDE-100 concentrations varying from 0.5 to 10 µg/L, which is acceptable and normally obtained with other methods. However, when BDE-100 concentrations approach the quantification and detection limits of the analytical method, the relative expanded uncertainty increases exponentially and represents more than 100% of the stated value. For that reason, Fig. 2b only represents the expanded uncertainty for BDE-100 concentrations higher than 0.1 g/L. This behavior was already observed in other studies [29].
Suitability of the extraction methodology to other PBDEs. The applicability of the
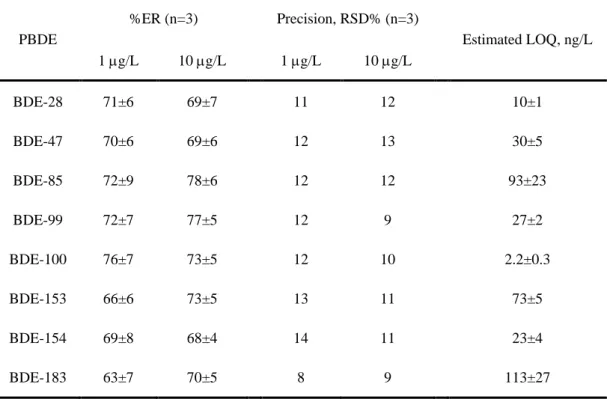
developed analytical methodology (DLLME-GC-MS) for other PBDEs quantification in water matrices was also evaluated. The PBDEs selected are the environmentally dominant congeners [30]. Firstly, the extraction recovery was determined for each PBDE at two concentration levels – 1 and 10 g/L (Table 5). For that, aqueous solutions prepared from a mixture of all PBDEs were submitted to DLLME under the conditions optimized in the section 3.1. Fig. 3 shows an example of a chromatogram obtained, where good separation of the compounds and high resolution can be observed. Despite the extraction optimization was performed only for BDE-100, high extraction recoveries were attained for the other PBDEs (Table 5). On the other hand, it can be seen that the extraction efficiency of BDE-100 is not affected by the presence of the other congeners. These results prove that such extraction methodology can be successfully applied for the other PBDEs and it seems that the extraction efficiency of individual PBDEs is similar both when they are alone or together in the sample. In terms of quantitative analysis, the precision was evaluated by extracting three independent standard solutions at the same two concentration levels (1 and 10 g/L). The results expressed as RSD% are compiled in Table 5. Again, it can be advanced that the method remains precise, even when it was applied to a mixture of PBDEs. Estimated LOQs were calculated based on a signal-to-noise ratio of 10 and by injecting three independent standards of each PBDE congener and evaluating the analytical response. As observed from Table 5, the method proposed here, beyond being successfully applied to all PBDEs considered, allows reaching lower or comparable quantification limits than those existing in the literature (with more complex or time consuming extraction techniques).
CONCLUSIONS
A method by DLLME-GC-MS has been described for the determination of PBDEs in water samples. Additionally, the expanded uncertainty of the results was assessed for the first time, which is especially important for low concentration levels, where most uncertainty sources are extremely significant. The LOQ for BDE-100 was 2 ng/L and acceptable precision (12% for standards and 13%, 12% and 10% for spiked drinking, tap and river waters, respectively) and accuracy (91-107% recovery for all spiked samples) were obtained. The relative expanded uncertainty decreased from 22% to 14% when concentration of BDE-100 was increased up to 0.5 µg/L. Similar extraction recoveries were achieved when the developed method was applied to other PBDEs. The precision remains satisfactory (average 11%) even when mix standards with all PBDEs were analyzed. Lower or comparable LOQs to those reported in literature were obtained with this cheap, fast and easy to implement method for PBDEs quantification in water (2-113 ng/L).
ACKNOWLEDGEMENTS
This work was undertaken as part of the European Research Project SecurEau (http://www.secureau.eu/ – Contract no. 217976), supported by the European commission within the 7th Framework Programme FP7-SEC-2007-1.
Mónica S. F. Santos is grateful to the Portuguese Foundation for Science and Technology (FCT) for her PhD grant (ref. SFRH/BD/61302/2009). The authors are also grateful to FCT for the financial support through the project PTDC/AAC-AMB/101687/2008.
REFERENCES
1. Sjödin, A., Jakobsson, E., Kierkegaard, A., Marsh, G. and Sellström, U., J.
Chromatogr. A, 1998, vol. 822, no. 1, p. 83.
2. Sánchez-Avila, J., Tauler, R. and Lacorte, S., Environ. Int., 2012, vol. 46, no. 0, p. 50. 3. Daso, A.P., Fatoki, O.S., Odendaal, J.P. and Olujimi, O.O., Arch. Environ. Con. Tox., 2012, vol. 62, no. 3, p. 391.
4. Hope, B.K., Pillsbury, L. and Boling, B., Sci. Total Environ., 2012, vol. 417–418, no. 0, p. 263.
5. Zhao, A., Wang, X., Ma, M., Wang, W., Sun, H., Yan, Z., Xu, Z. and Wang, H.,
Microchim. Acta, 2012, vol. 177, no. 1-2, p. 229.
6. Liu, H., Zhang, M., Wang, X., Zou, Y., Wang, W., Ma, M., Li, Y. and Wang, H.,
Microchim. Acta, 2012, vol. 176, no. 3-4, p. 303.
7. Liu, X., Li, J., Zhao, Z., Zhang, W., Lin, K., Huang, C. and Wang, X., J. Chromatogr.
A, 2009, vol. 1216, no. 12, p. 2220.
8. Bacaloni, A., Callipo, L., Corradini, E., Giansanti, P., Gubbiotti, R., Samperi, R. and Laganà, A., J. Chromatogr. A, 2009, vol. 1216, no. 36, p. 6400.
9. Fontana, A.R., Wuilloud, R.G., Martínez, L.D. and Altamirano, J.C., J. Chromatogr. A, 2009, vol. 1216, no. 1, p. 147.
10. Fontana, A.R., Silva, M.F., Martínez, L.D., Wuilloud, R.G. and Altamirano, J.C., J.
Chromatogr. A, 2009, vol. 1216, no. 20, p. 4339.
11. Li, Y., Wei, G., Hu, J., Liu, X., Zhao, X. and Wang, X., Anal. Chim. Acta, 2008, vol. 615, no. 1, p. 96.
12. Li, Y., Hu, J., Liu, X., Fu, L., Zhang, X. and Wang, X., J. Sep. Sci., 2008, vol. 31, no. 13, p. 2371.
13. Li, Y., Wei, G. and Wang, X., J. Sep. Sci., 2007, vol. 30, no. 16, p. 2698.
14. Xiao, Q., Hu, B., Duan, J., He, M. and Zu, W., J. Am. Soc. Mass Spectr., 2007, vol. 18, no. 10, p. 1740.
15. Fontanals, N., Barri, T., Bergström, S. and Jönsson, J.-Å., J. Chromatogr. A, 2006, vol. 1133, no. 1–2, p. 41.
16. Yusà, V., Pastor, A. and de la Guardia, M., Anal. Chim. Acta, 2006, vol. 565, no. 1, p. 103.
17. Llorca-Porcel, J., Martínez-Sánchez, G., Álvarez, B., Cobollo, M.A. and Valor, I.,
Anal. Chim. Acta, 2006, vol. 569, no. 1–2, p. 113.
18. Polo, M., Gómez-Noya, G., Quintana, J.B., Llompart, M., García-Jares, C. and Cela, R., Anal. Chem., 2004, vol. 76, no. 4, p. 1054.
19. Zang, X.-H., Wu, Q.-H., Zhang, M.-Y., Xi, G.-H. and Wang, Z., Chinese J. Anal.
Chem., 2009, vol. 37, no. 2, p. 161.
20. Krylov, V.A., Krylov, A.V., Mosyagin, P.V. and Matkivskaya, Y.O., J. Anal. Chem., 2011, vol. 66, no. 4, p. 331.
21. Rezaee, M., Assadi, Y., Milani Hosseini, M.-R., Aghaee, E., Ahmadi, F. and Berijani, S., J. Chromatogr. A, 2006, vol. 1116, no. 1–2, p. 1.
22. Zgoła-Grześkowiak, A. and Grześkowiak, T., Trends Anal. Chem., 2011, vol. 30, no. 9, p. 1382.
23. Sousa, R., Homem, V., Moreira, J.L., Madeira, L.M. and Alves, A., Anal. Method, 2013, vol. 5, no. 11, p. 2736.
25. Kozani, R.R., Assadi, Y., Shemirani, F., Hosseini, M.R.M. and Jamali, M.R., Talanta, 2007, vol. 72, no. 2, p. 387.
26. Ellison, S.L.R., Rosslein, M. and Williams, A. Eurachem/ Citac Guide- Quantification uncertainty in analytical measurement. UK: EURACHEM/ CITAC, 2000. 27. Ratola, N., Martins, L. and Alves, A., Anal. Chim. Acta, 2004, vol. 513, no. 1, p. 319. 28. Silva, S.L., Alves, A. and Santos, L., J. Chromatogr. Sci., 2009, vol. 47, no. 2, p. 103. 29. Dı́az, A., Vàzquez, L.s., Ventura, F. and Galceran, M.T., Anal. Chim. Acta, 2004, vol. 506, no. 1, p. 71.
30. Qiu, Y.-W., Zhang, G., Guo, L.-L., Zheng, G.J. and Cai, S.-Q., Mar. Environ. Res., 2010, vol. 70, no. 2, p. 219.
Table 1. Literature survey on PBDEs quantification in water samples
Analytes Extraction Determination Analytical parameters Uncertainty Year Ref. BDEs
47,99,154,183
TA-IL-DLLME
Sample volume – 5 mL; dispersive solvent – MeOH (1 mL); extraction solvent – [C8MIM] [PF6] (40 L)
HPLC–DAD LR – 500-500,000 ng/L RSD – 1.0-3.8% LOD – 100-400 ng/L Recovery – 81.0-127.1% NO 2012 [5] BDEs 28,47,99,154,183,209 SFOME
Sample volume – 40 mL; extraction solvent – 2-dodecanol (25 L); temperature – 60 ºC; stirring speed – 900 rpm; extraction time – 25 min; salt addition – no HPLC–DAD LR – 5000-500,000 ng/L (BDE-209) 500-75,000 ng/L (others) LOD – 10-40 ng/L Recovery – 92-118% NO 2012 [6] BDEs 28,47,85,99,100,153,154 SPE
Column – Supelclean LC-C18; conditioning – DCM (2 mL), MeOH (5 mL), H2O (5 mL); load –
100 mL at 10 mL/min; elution – n-hexane (2 mL) +
DLLME
Sample volume – 5 mL; disperser solvent – ACN (1 mL); extraction solvent – 1,1,2,2-tetrachloroethane (22 L); salt addition – no GC–ECD LR – 0.1-100 ng/L (BDEs 28, 47) 0.5-500 ng/L (others) RSD – 4.2-7.9% LOD – 0.030-0.15ng/L Recovery – 66.8-94.1% NO 2009 [7] BDEs 47,99,100,153,154 LLE
Sample volume – 1 L; extraction solvent – n-hexane (100 mL); salt addition – 20 g LC/NI–APP1/M S/MS LR – 0.025-10 ng/L LOD – 0.004-0.1 ng/L Recovery – 43-99% NO 2009 [8] BDEs 47,99,100,153 USAEME
Sample volume – 10 mL; temperature – 35 ºC; extraction solvent – CF (100 L); extraction time – 5 min GC–MS LR – 5-5000 ng/L (BDEs 47,100) 5-10 000 ng/L (BDEs 99,153) RSD – <10.3% LOD – 1-2 ng/L Recovery – ≥96% NO 2009 [9]
BDEs 47,99,100,153
CPE
Sample volume – 10 mL; non-ionic surfactant – Triton X-100 (0.4 g/L); salt addition – 400 L of 6.15 mol/L; temperature – 80 ºC; equilibrium time – 7 min
+ UABE
Extraction solvent – isooctane (50 L); extraction time – 5 min GC–MS LR – 4-150 ng/L RSD – ≤8.5% LOD – 1-2 ng/L Recovery – 96-106% NO 2009 [10] BDEs 28,47,99,209 DLLME
Sample volume – 5 mL; disperser solvent – ACN (1 mL); extraction solvent – tetrachloroethane (20 L); salt addition – no HPLC–DAD LR – 50-50,000 ng/L (BDEs 28, 99); 100-100,000 ng/L (others) RSD – 3.8-6.3% LOD – 12.4-55.6ng/L Recovery – 87.0-114.3% NO 2008 [11] BDE-209 DLLME
Sample volume – 5 mL; disperser solvent – THF (1 mL); extraction solvent – tetrachloroethane (22 L); salt addition – no HPLC–UV LR – 1000-500,000 ng/L RSD – 2.1% LOD – 200 ng/L Recovery – 89.9-95.8% NO 2008 [12] BDE-209 SDME
Sample volume – 5 mL; extraction solvent – toluene; solvent drop volume – 3 L; extraction time – 15 min; stirring speed – 600 rpm; salt addition – no HPLC–DAD LR – 1,000-1,000,000 ng/L RSD – 4.8% LOD – 700 ng/L Recovery – 91.5-102.8% NO 2007 [13] BDEs 28,47,99,100 HF-LPME
Sample volume – 3 mL; temperature – 40 ºC; extraction solvent – decane; stirring speed – 1000 rpm; extraction time – 20 min; salt addition – no
GC–ICP–MS LR – 200-20,000 ng/L RSD – 5.1-9.1% LOD – 15.2-40.5 ng/L Recovery – 85-110% NO 2007 [14] BDEs 28,47,99,100,153,154,183 HF-MMLLE
Sample volume – 100 mL; extraction solvent –
n-undecane; stirring speed – 1200 rpm; extraction
time – 60 min; salt addition – no
GC–MS LR – 1-100 ng/L RSD – 16.9% LOD – 1.1 ng/L Recovery – 85-110%
BDEs
28,47,66,85,99,100,138,153,154
MAE
Sample volume – 1.5 L; extraction solvent – hexane-acetone, 1:1 (v/v) (60 mL); temperature – 85 ºC; extraction time – 1 min; two cycles
GC–MS–MS LR –500-100,000 ng/L LOD –0.02-0.1 ng/membrane Recovery – 72-91% NO 2006 [16] BDEs 28,47,66,85,99,100,138,153,154 SBSE
Sample volume – 100 mL; PDMS commercial stir bars; temperature – ambient; extraction time – 25 h; MeOH addition – 20% TD–GC–MS LR – 20-600 ng/L RSD – ≤20% LOD – 0.3-9.6 ng/L Recovery – 94-106% NO 2006 [17] BDEs 3,47,85,99,100,153,154 HS-SPME
Sample volume – 10 mL; fiber – PDMS; extraction temperature – 100 ºC; extraction time – 30 min; desorption temperature – 280 ºC; desorption time – 2 min; salt addition – no
GC–MS–MS LR – 0.12-503 ng/L RSD – 1.2-26%
LOD – 0.0075-0.190 ng/L Recovery – 74-117%
NO 2004 [18]
AC – acetone, ACN – acetonitrile, CB – chlorobenzene; CF – chloroform; CPE – cloud point extraction; CTC – carbon tetrachloride; DCM – dichloromethane; DLLME – dispersive liquid-liquid microextraction; EF – enrichment factor; ER – extraction recovery; GC-ECD – gas chromatography with electron capture detector; GC-ICP-MS – gas chromatography-inductively coupled plasma mass spectrometry; GC-MS – gas chromatography mass spectrometry; GC-MS-MS – gas chromatography tandem mass spectrometry; HF-LPME – hollow-fiber liquid phase microextraction; HF-MMLE – hollow-fiber microporous membrane liquid-liquid extraction; HPLC-DAD – high-performance liquid chromatography with diode array detector; HPLC-UV – high-performance liquid chromatography with ultraviolet detector; HS-SPME – headspace solid phase microextraction; LC/NI-APPI/MS/MS – liquid chromatography-negative ion atmospheric pressure photoionization tandem mass spectrometry; LLE – liquid-liquid extraction; LOD – detection limit; LOQ – limit of quantification; LR – linearity range; MAE – microwave assisted extraction; MeOH – methanol; PBDEs – polybrominated diphenyl ethers; RSD – relative standard deviation; SBSE – stir bar sorptive extraction; SDME – single-drop microextraction; SFOME – solidified floating organic drop microextraction; SPE – solid phase extraction; TA-IL-DLLME – temperature-assisted ionic liquid dispersive liquid-liquid microextraction; TCE – 1,1,2,2-tetrachloroetahne; TD-GC-MS – thermal desorption gas chromatography mass spectrometry; TOC – total organic carbon; UABE – ultrasound-assisted back extraction; USAEME – ultrasound-assisted emulsification-microextraction
26
Table 2. Retention time, quantification and qualifier ions for each PBDE by GC–MS
PBDE Class Retention time, min Quantification ion (m/z) Qualifier ion (m/z) BDE-28 Tri-BDE 10.720 248 + 408 246 BDE-47 Tetra-BDE 12.513 326 + 486 328 BDE-85 Penta-BDE 15.954 406 + 564 404 BDE-99 Penta-BDE 14.829 406 + 566 404 BDE-100 Penta-BDE 14.227 406 + 566 564 BDE-153 Hexa-BDE 17.459 484 + 644 486 BDE-154 Hexa-BDE 16.480 484 644 BDE-183 Hepta-BDE 20.473 564 + 724 562
Table 3. Analytical responses and extraction recoveries (ER) obtained with different
extraction and dispersive solvents
Parameter
CB CTC
ACN MeOH AC ACN MeOH AC
Area ×104, kCounts 25±2 27±1 22±1 15±1 18±2 17±2
27
Table 4. Precision and recovery obtained for BDE-100 standards and spiked water
samples
Sample
Precision, RSD% (n=3) Recovery, % (n=3)
0.01 g/L 1 g/L 10g/L 0.01 g/L 1 g/L 10 g/L Standard 18 10 8 --- --- ---
Spiked drinking water 20 6 13 96±19 107±6 88±12
Spiked tap water 19 6 11 114±22 103±6 105±11
Spiked river water 11 14 4 82±9 110±16 82±3
Table 5. Extraction recovery (ER), precision and estimated LOQ for all PBDEs by
DLLME-GC-MS PBDE %ER (n=3) Precision, RSD% (n=3) Estimated LOQ, ng/L 1 g/L 10 g/L 1 g/L 10 g/L BDE-28 71±6 69±7 11 12 10±1 BDE-47 70±6 69±6 12 13 30±5 BDE-85 72±9 78±6 12 12 93±23 BDE-99 72±7 77±5 12 9 27±2 BDE-100 76±7 73±5 12 10 2.2±0.3 BDE-153 66±6 73±5 13 11 73±5 BDE-154 69±8 68±4 14 11 23±4 BDE-183 63±7 70±5 8 9 113±27
28
Figure Captions
Fig. 1. Effect of chlorobenzene volume (a), acetonitrile volume (b), extraction time (c)
and salt addition (d) on the enrichment factor and extraction recovery for BDE-100.
Fig. 2. Contribution of each source of uncertainty to the combined standard uncertainty:
U1 – standards preparation, U2 – calibration curve, U3 – precision and U4 – accuracy (a) and expanded uncertainty (b) for BDE-100 determination in water by DLLME–GC–MS.
Fig. 3. Chromatogram of a standard solution of PBDEs at individual concentration of 1 g/L.
29
Fig. 1. Santos M.S.F. et al.
(a) (b)
(c) (d)
(a) (b)
30
Fig. 2. Santos M.S.F. et al.
(b) (a)
31