Article
J. Braz. Chem. Soc., Vol. 22, No. 9, 1679-1685, 2011. Printed in Brazil - ©2011 Sociedade Brasileira de Química
0103 - 5053 $6.00+0.00
A
*e-mail: [email protected]
SPE-HPLC Method for Determination of Ketoconazole and
Clotrimazole Residues in Cow’s Milk
Farzaneh Ahmad Khan Beigi,a,b Mohammad Imani,*,a Mahmood Payehghadrb and
Hedayat Hosseinic
aNovel Drug Delivery Systems Dept., Iran Polymer and Petrochemical Institute, P.O. Box 14965-115, Tehran, Iran
bPayame Noor University (PNU), Karaj, Iran
cFood Science & Technology Dept., National Nutrition & Food Technology Research Institute,
Shahid Beheshti University of Medical Sciences, P.O. Box 19395-4741, Tehran, Iran
Um método simples conirmatório para determinação em HPLC-UV de resíduos de cetoconazol e clotrimazol em leite de vaca, após extração da fase sólida (SPE), é relatado neste artigo. Foram removidos das amostras proteínas e lipídeos por tratamento com acetonitrila e conseqüente extração
em n-hexano. Os extratos foram posteriormente limpos e concentrados através de extração em
fase sólida. Os analitos foram determinados quantitativamente usando um método validado de
cromatograia líquida de alta eiciência. O método foi linear no intervalo de 0,1 a 1,0 µg mL-1
para ambos analitos. Os limites de detecção e quantiicação para os analitos foram iguais a 0,01
e 0,1 µg mL-1, respectivamente. Parâmetros importantes que inluenciam a eiciência da extração
foram investigados e otimizados. O método proposto foi aplicado à análise de amostras de leite. Foram obtidas recuperações satisfatórias no intervalo de 95,9 a 101,78%, usando SPE.
A simple conirmatory method for HPLC-UV determination of ketoconazole and clotrimazole residues in cow’s milk after solid phase extraction (SPE) is reported in this article. The samples were
deprived of proteins and lipids by treating with acetonitrile and consequent extraction in n-hexane.
Extracts were further cleaned-up and concentrated via solid phase extraction. The analytes were
determined quantitatively using a validated high performance liquid chromatography method.
The method was linear in the range of 0.1-1.0 µg mL-1 for both analytes. Limits of detection
and quantiication for both analytes were equal to 0.01 and 0.1 µg mL-1, respectively. Important
parameters inluencing the extraction eficiency were investigated and then optimized; the proposed method was applied to the analysis of milk samples. Satisfactory recoveries were obtained in the range of 95.9-101.78% using SPE.
Keywords: ketoconazole, clotrimazole, solid-phase extraction, high performance liquid
chromatography, milk
Introduction
Administration of veterinary drugs for treatment of food-producing animals, can signiicantly affect public health and international trade of food products, due to the presence of drug residues or their metabolites in milk, eggs, meat etc. Misuse of drugs and/or giving not adequate time after treatment for drug clearance, possibly leads to the presence of their residues in milk and increases the potential risk to consumers, due to the allergic reactions of those who are sensitive to those drugs e.g., antibiotics.1,2
Ketoconazole (KET) (Figure 1A) and clotrimazole (CLO) (Figure 1B) are synthetic imidazole derivatives with a broad-spectrum of antifungal activity. First developed in 1969, topical preparations containing CLO are routinely
Figure 1. Chemical structures of (A) ketoconazole and (B) clotrimazole. N N
Cl
(B) O
N N O
O
H O
Cl Cl
N
N
used for treatment of various systemic mycoses including candidiasis.3,4 The compound is highly effective, but can
alter liver enzymatic activity.5-8
The major problem concerning analysis of drug residues in milk is complexity of this analytical matrix.1
Milk is a complex luid containing all nutrients required for growth and development of newborns, for example speciic proteins, easily digestible fats, vitamins, and other components that may play an important role, all these may interfere with an analyte recovery.
Methods for monitoring drug residues in veterinary products should be rapid, speciic and sensitive enough to enable detection at very low levels. It is also necessary to develop and optimize analytical methods for detection of residues at low concentration levels. Solid phase extraction (SPE) is a relatively rapid, easy and inexpensive method of extraction which has been shown to be applicable in extraction of drug residues from biological matrices, including fatty matrices, e.g., milk.9
Several SPE methods for extraction of azole antifungal drugs from plasma, serum and biological samples were reported;10, 11 however, no report on application of SPE
for separation of antifungal drug residues from dairy products appeared in the literature to the best of the authors’ knowledge. Extraction of CLO residue from environmental samples, i.e., water, is reported by Paull and co-workers,12
using an optimized SPE procedure which was subsequently analyzed by HPLC using a monolithic column. A solid phase extraction procedure is also reported for clean-up and sample preconcentration of antifungal agents including KET, CLO, itraconazole, luconazole, and voriconazole and their metabolites after incubation with human parenchymal hepatocytes.13 Extraction of miconazole from human
plasma was performed by SPE.14 Several methods for
determination of CLO and KET have been described in the literature including volumetric,15 spectrophotometric,16,17
spectroluorimetric,18,19 capillary electrophoresis,20,21 thin
layer chromatography,22 gas chromatography23 and high
performance liquid chromatography methods.24,25 This
paper describes the development and optimization of a new analytical method combining SPE of CLO and KET residues in milk from dairy cattle and their subsequent analysis by a previously validated HPLC-UV method.
Experimental
Instrumentation
Samples were analyzed using an Agilent 1200 high performance liquid chromatograph (Agilent, USA) consisting of degasser, G1312B binary pump system,
autosampler and G1316B TCCS1 column oven. It was coupled with UV-Visible detector and controlled by Agilent Chemstation® software. Separation of KET and CLO
were achieved using a Zorbax Eclipse XDB-C18 column (particle size 5 µm, 250 × 4.6 [l × i.d.]) equipped with Zorbax C18 analytical guard column (12.5 mm × 4.6 mm) at 35 ºC. All injections were performed automatically using a 20 µL loop on an Agilent C1329A ALS autosampler apparatus. Detection of the analytes was carried out using Agilent multiwavelength UV detector (G1365C MWDSL, Agilent, USA) at 212 nm. The analytes were separated by running a mobile phase consisted of acetonitrile and 20 mmol L-1 sodium acetate buffer (pH 4.6) at a low rate of
1 mL min-1 through the column. The composition was held
constant at (85:15 v/v) to give a total run time of 5.5 min. All experiments were employed in the same isocratic mode and all calculations concerning the quantitative analysis were performed with external standardization by measurement of peak areas. Calibration curve was drawn using six concentrations of the analytes, separately. All analyses were replicated three times. A brief description of HPLC method validation results is given in Table 1.
For solid phase extraction, C18 Sep-Pak cartridges
(WAT036575, 55-105 µm, Waters, USA), extraction tank and manifold (Waters, Milwaukee, USA) were used. pH/Ion meter (Model 781, Metrohm, Switzerland), electronic precision balance (Model 770, KERN, Switzerland) and centrifuge (SIGMA 2-16K, Sigma, Germany) were also used.
Chemicals and reagents
Ketoconazole and clotrimazole (USP XXIII) were obtained from FDC (India). KET (LOT # H0F084) and CLO (LOT # K0C280) certiied reference standards were obtained from United States Pharmacopeia Convention (Maryland, USA). Methanol, ethanol, acetone, chloroform, acetonitrile (ACN) were of HPLC grade and purchased from Romil (Loughborough, UK). Glacial acetic acid and sodium acetate (both of analytical grade) were obtained from Merck Chemicals (Darmstadt, Germany). Sodium chloride pellets (analytical grade) was obtained from Merck. Water (HPLC grade) was produced in-house. All water used was doubly-deionized water (AquaMax Ultra 370 water puriication systems, YoungLin, Anyang, South Korea).
Preparation of standard solutions
Individual standard stock solutions (1000 µg mL-1)
solutions were stored at 4°C for not longer than 2 weeks. A working standard solution (10 µg mL-1) was prepared by
pouring 100 µL of each standard stock solution to a single 10 mL volumetric lask and diluting to volume with doubly-deionized water. Working solution was prepared daily and stored at 4 °C prior to use.
Extraction procedure
Cow’s milk samples provided from local market and then were stored at −14 °C before use and defrosted at room temperature for analysis. Milk sample (5 mL) was added into a 50 mL centrifuge tube. For samples spiked with drugs, 1 µg mL-1 of the working solution was added
to the blank cow’s milk sample. ACN (15 mL) was added, shook and centrifuged. The supernatant was transferred into another 50 mL centrifuge tube and 10 mL of n-hexane was added. The centrifuge tube was then shook for 15 min and centrifuged at 5000 rpm for 15 min at 20 °C. The top hexane layer was removed, and the middle layer, a mixture of ACN and water containing imidazole residues, was transferred into another tube by pipetting. ACN was removed using a stream of nitrogen at 50°C in a water bath. After approximately 45 min, about 3 mL of the aqueous solution remained in the test tube; 10 mL of water was added to reconstitute the sample extracts. Cartridges were preconditioned sequentially with 10 mL
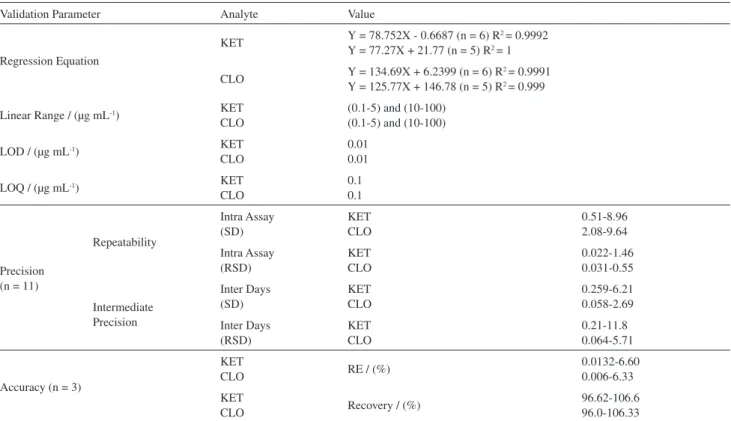
Table 1. HPLC-UV method validation parameters for analysis of clotrimazole and ketoconazole
Validation Parameter Analyte Value
Regression Equation
KET Y = 78.752X - 0.6687 (n = 6) R
2 = 0.9992
Y = 77.27X + 21.77 (n = 5) R2 = 1
CLO Y = 134.69X + 6.2399 (n = 6) R
2 = 0.9991
Y = 125.77X + 146.78 (n = 5) R2 = 0.999
Linear Range / (µg mL-1) KET
CLO
(0.1-5) and (10-100) (0.1-5) and (10-100)
LOD / (µg mL-1) KET
CLO
0.01 0.01
LOQ / (µg mL-1) KET
CLO
0.1 0.1
Precision (n = 11)
Repeatability Intra Assay (SD) KET CLO 0.51-8.96 2.08-9.64 Intra Assay (RSD) KET CLO 0.022-1.46 0.031-0.55 Intermediate Precision Inter Days (SD) KET CLO 0.259-6.21 0.058-2.69 Inter Days (RSD) KET CLO 0.21-11.8 0.064-5.71
Accuracy (n = 3)
KET
CLO RE / (%)
0.0132-6.60 0.006-6.33
KET
CLO Recovery / (%)
96.62-106.6 96.0-106.33
of methanol and water, 5 mL of 2% NaCl, and 10 mL of phosphate buffer (pH 5.8). The reconstituted solution was loaded on the preconditioned cartridge under vacuum. Finally, ketoconazole and clotrimazole were eluted from the cartridges using ethanol. The SPE cartridges were eluted with 5 mL of ethanol and the resulting eluent was transferred to 10 mL test tubes and blown with transmission of N2 gas low at 50 °C in a water bath until
complete drying. Finally, the extract was mixed with 1 mL of ACN, shook for 30 s and, sonicated to complete dissolution and then analyzed by HPLC-UV with an injection volume of 20 µL.
Results and Discussion
Presence of bioactive residues in food chain can impose huge risks to consumers. Several methods have been previously reported to separate and analyze anti-fungal drug residues in plasma and lung, liver, and adrenal gland tissues of rats.26 Determination of KET and CLO are usually
accomplished by chromatographic techniques but strongly needs a prior sample treatment and enrichment step that has been carried out by liquid-liquid extraction (LLE).27-30 There
and enroloxacin in milk; however, no limit has been ruled out for CLO and KET until now.31
Several important parameters such as eluent type and its volume, sample low rate, sample volume, pH, and ionic strength were optimized and investigated in details. Eluent type and composition showed an important effect on the elution performance and separation eficiency of the analytes hence, a suitable solvent should be selected, which is dependent on the chemical nature of the analyte(s). Five solvents differing in polarity i.e., acetone, ethanol, methanol, ACN and chloroform were tested for eluting KET and CLO. Trials results are shown in Table 2 indicating that acetone showed the best elution eficiency but it is very volatile. Therefore, in the following studies, ethanol was adopted as an eluent due to its less volatility, toxicity and cost.
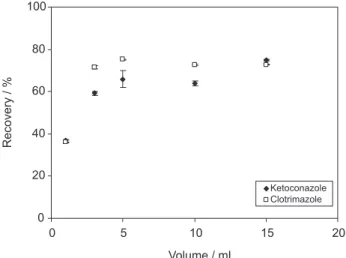
A series of experiments was designed through changing the volume of eluent ethanol from 1 to 15 mL. The results (as shown in Figure 2) elucidates that the recoveries for drugs increased with an increase in the eluent volume between 1 to 5 mL. When the volume of ethanol was more than 5 mL, the recoveries kept constant. Therefore, in all of the subsequent experiments, 5 mL ethanol was used as the eluent.
Flow rate of the sample solution not only affects the recovery of analyte(s), but also controls the analysis
time.32 In order to save the analysis time and obtain an
acceptable result, the low rate for sample solutions was investigated and optimized in the range of 1-10 mL min-1.
The effect of low rate on the recovery of the drugs is shown in Figure 3. According to the results, when the low rate reached 1 mL min-1, the recoveries for two analytes
were in the range of 74-87%, which is acceptable in trace analysis. Therefore, in the subsequent analysis, 1 mL min-1
low rate was selected.
The pH plays an important role in the solid phase extraction process because it determines the existing ionic state of analytes hence; determines their extraction eficiency.33 In this experiment, the effect of pH was studied
in the range of 4.0-8.0. The results are shown in Figure 4. It was observed that the maximum enrichment eficiencies can be achieved for the drugs at pH 5.8, while the lowest recoveries were obtained at pH 4.0. Considering pKa values of 6.3 and 6.5 for CLO and KET, the analytes will be mostly in their cationic state at pH of 5.8 and the observed extraction ineficiency at the lower pH values can attributed to instability of these imidazole drugs at strong acidic aqueous solutions. Thus, in the following experiments the pH of cartridge was adjusted at 5.8.
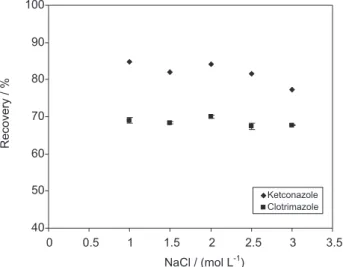
The effect of ionic strength on the adsorption of drugs on the solid substrate was studied. Ionic strength was adjusted using NaCl to determine this effect as shown in Figure 5. A series of experiments were designed using NaCl solution (1-3% m/v). The results elucidated that using NaCl to adjust the ionic strength of the eluent solution can improve the extraction recovery signiicantly to 70.04-84.13% for both analytical species. However, it was found that using organic solvent as eluent easily causes
Figure 2. Effect of the eluent volume on the recovery of drugs isolated by SPE cartridge. Conditions: sample concentration 1 µg mL-1 of each
analytical species, sample volume 10 mL, volume of ethanol 5 mL, low rate 1.0 mL min-1
Figure 3. Effect of the eluent low rate on the recovery of the ketoconazole and clotrimazole by SPE cartridge. Conditions: sample concentration 1 µg mL-1 for each compound, sample volume 10 mL, volume of ethanol
5 mL, low rate 1.0 mL min-1 Table 2. Effect of eluent type on the recoveries of KET and CLO
Drug Recovery / (%)
Acetone Ethanol Methanol Chloroform Acetonitrile
CLO 72 ±8 70 ± 8 64 ± 7 67 ± 5 57 ± 2
Figure 4. Effect of pH on the extraction eficiency of the analytes in SPE. Extraction conditions: sample concentration, 1 µg mL-1 for both
compounds, sample volume 10 mL, volume of ethanol 5 mL, low rate 1.0 mL min-1
salting out when concentration of the salt was 2% m/v or more therefore; the effect of higher concentrations of NaCl on the adsorption of drugs has not been suited.
In order to obtain dependable analytical results and a high-enrichment factor, breakthrough volume was determined as a signiicant parameter which should be brought up for SPE. The effect of sample volume on the recoveries of KET and CLO was investigated in the range
Figure 5. Effect of ionic strength on the recoveries of the analyzed drugs by SPE method. Extraction conditions: sample concentration, 1 µg mL-1
for both compound, sample volume 10 mL, volume of ethanol 5 mL, pH 5.8, eluent low rate of 1.0 mL min-1.
of 25-500 mL. Results are shown in Figure 6, which indicates that acceptable enrichment performance was obtained. The recoveries were increased with sample volume in the range of 25-250 mL. The recoveries began to slightly decrease when the sample volume was more than 250 mL. Based on this observation, sample volume of 250 mL was adopted in further experiments.
Analytical performance
Under the above optimum conditions, linear range, limits of detection and repeatability of the analytical method were examined (Table 3). Linearity was observed over the range of 0.1-1 µg mL-1 for two drugs. Coeficients of
correlation (R) ranged from 0.9949 to 0.9993. The limits of detection (LODs), based on a signal to noise ratio (S/N) of 3, ranged from 0.01 µg mL-1. The RSD was found to be
below 7% for KET and CLO.
Extraction procedure
KET and CLO were extracted from milk samples spiked with drugs using the described SPE procedure. Milk proteins were denaturated by 15 mL of ACN and lipids or fat were separated using 10 mL of n-hexane. Separations were achieved using an SPE procedure on C18 cartridges
Figure 6. Effect of breakthrough volume on the recoveries of drugs by SPE. Extraction conditions: sample concentration, 1 µg mL-1 for each
analyte, sample volume 10 mL, volume of ethanol 5 mL, pH 5.8 , low rate 1.0 mL min-1.
Table 3. Repeatability (RSD), enrichment factor (EF), linear range (LR), correlation of coeficient (R2), and limits of detection (LODs) using SPE method
Drug RSD / (%)
(n = 9) EF / (µg mL
-1) LR / (µg mL-1) R2 LOD / (µg mL-1)
(S/N = 3)
KET 1.2-6.8 25-250 0.1-1 0.9949 0.01
after sample clean up and enhancement. The results are shown in Table 4.
Recovery tests were performed using milk samples spiked with drugs mixture. HPLC chromatogram of the cow’s milk and milk samples spiked with 1 µg mL-1
of each analyte are shown in Figure 7. Analyzing milk samples gathered from local market (n = 16) at different time intervals revealed no cases of pollution with KET and CLO in the detection range of the developed method for samples gathered from local market.
Conclusions
In this paper, a cheap, simple and reliable method is reported for enrichment and determination of KET and CLO in milk samples using solid phase adsorbents. Enrichment factor and detection limit were 25-250 and 0.01 µg mL-1, respectively. The calibration curve for drugs
in the range of 0.1-1 was linear, and recovery was in the range of 95.9-101.8%. Relative standard deviations were 1.2-6.8 and 0.3-5.3 for KET and CLO, respectively. Using SPE technique, it is the irst report on the extraction and subsequent analysis of KET and CLO from milk by SPE technique.
References
1. Aerts, M. M. L.; Hogenboon, A.C.; Brinkman, U.A.;
J. Chromatogr., B: Anal. Technol. Biomed. Life Sci. 1995, 667, 1.
2. Pontes Netto, D.; Lopes, M. O.; Olivera, M. C. S.; Nunes, M. P.; Machinski Jr., M.; Bosquiroli, S. L.; Benatto, A.; Benini, A.; Bombardelli, A. L. C.; Vedovello Filho, D.; Machado, E.;
Belmonte, I. L.; Alberton, M.; Pedroso, P. P.; Scucato E. S.;
Acta Sci., Anim. Sci.2005, 27, 105.
3. Valenta, C.; Lexer, A.; Spiegl, P.; Die Pharmazie1992, 47, 641. 4. Hoogerheide, J. C.; Strusiak, S. H.; Taddei, C. R.; Townley, E.
R.; Wyka, B. E. J.; J. Assoc. Off. Anal. Chem. 1981, 64, 864. 5. Zegarelli, D. J.; Otolaryngol. Clin. N. Am. 1993, 26, 1069. 6. Odds, F. C.; Milne, L. J.; Gentles, J. C; Ball, E. H.; J. Antimicrob.
Chemother. 1980, 6, 97.
7. Heel, R. C.; Brogden, R. N.; Carmine, A.; Morley, P. A.; Speight, T. M.; Avery, G. S.; Drugs1982, 23, 1.
8. Daneshmend, T. K.; Warnock, D. W; Clin. Pharmacokinet.
1988, 14, 13.
9. Schenck, F. J.; Wagner, R.; Bargo, W.; J. Liq. Chromatogr. Relat. Technol. 1993, 16,513.
10. Di Pietra, A. M.; Andrisano, V.; Gotti , R.; Cavrini, V.; J. Pharm. Biomed. Anal.1996,14 ,1191.
11. Wienen, F.; Laug, S.; Baumann, K.; Schwab, A.; Just, S.; Holzgrabe, U.; J. Pharm. Biomed. Anal.2003, 30, 1979. 12. Bones,J.; Nesterenko, P.; Thomas, K.; Paull, B.; Int. J. Environ.
Anal. Chem. 2006, 86, 487.
13. Crego, A. L.; Gómez, J.; Marina, M. L.; Lavandera, J. L.;
Electrophoresis2001, 22, 2503.
14. Kobyliń ska, M.; Kobyliń ska, K.; Sobik, B.; J. Chromatogr., B: Anal. Technol. Biomed. Life Sci. 1996, 685, 191.
15. Gaur, R.; Azizi, M.; Gan, J.; Hansal, P.; Harper, K.; Mannan, R.; Panchal, A.; Patel, K.; Patel, M.; Patel, N.; Rana, J.; Rogowska A.;
The British Pharmacopoeia, 6th ed.; Medicines and Healthcare
Products Regulatory Agency: London, 2009, Vol. I.
16. Abdelmageed, O. H.; Khashaba, P. Y.; Talanta1993, 40, 1289. 17. Khashaba, P.Y.; El-Shabouri, S. R.; Emara, K. M.; Mohamed,
A. M.; J. Pharm. Biomed. Anal.2000, 22, 363.
18. El-Saharty, Y. S.; Hassan, N. Y.; Metwally, F. H.; J. Pharm. Biomed. Anal. 2002, 28,569.
19. El-Bayoumi, A.; El-Shanawany, A. A.; El-Sadek, M. E.; Abd El-Sattar, A.; Spectrosc. Lett. 1997, 30, 25.
20. Crego, A. L; Gómez, J.; Lavandera, J. L.;J. Sep. Sci. 2001, 24, 265.
21. Wienen, F.; Laug, S.; Baumann, K.; Schwab, A.; Just , S.; Holzgrabe, U.; J. Pharm. Biomed. Anal.2003, 30, 1879. 22. Popović, G.; Čakar, M.; Vučićević, K.; Vladimirov, S.; Agbaba,
D.; J. Planar Chromatogr.-Mod. TLC 2004, 17, 109. 23. Szathmary, S. C.; Luhmann, I.; J. Chromatogr., A 1988, 425,
193.
24. Whitehouse, L. W.; Menzies, A.; Dawson, B.; Cyr, T. D.; By, A. W.; Black, D. B.; Zamecnik, J.; J. Pharm. Biomed. Anal.1994,
12, 1425.
25. De Bruijn, P.; Kehrer, D. F. S.; Verweij, J.; Sparreboom, A.;
J. Chromatogr., B: Anal. Technol. Biomed. Life Sci. 2001,
753, 395.
26. Riley, C. M.; James, M. O.; J. Chromatogr. B: Biomed. Sci. Appl. 1986, 377, 287.
Table 4. Determination and recovery results for KET and CLO in the spiked milk samples
Drug Added Levels / (µg mL-1)
Found / (µg mL-1)
Recovery / (%)
KET 1 0.96 95.09
CLO 1 1.02 101.78
27. Huang, Q.; Guang-Ji, W.; Jian-Guo, S.; Xiao-Lin, H.; Yi-Hong, L.; Zhang, Q.; Rapid Commun. Mass Spectrom.2007, 21, 1009. 28. Chen, Y. L.; Felder, L.; Jiang, X.; Naidong, W.; J. Chromatogr.,
B: Anal. Technol. Biomed. Life Sci.2002, 774, 67.
29. Hamdy, D. A.; Brocks, D. R.; Biomed. Chromatogr.2008, 22, 542.
30. Wienen, F.; Laug, S.; Baumann, K.; Schwab, A.; Just, S.; Holzgrabe U.; J. Pharm. Biomed. Anal. 2003, 30, 1879.
31. Veau De, E. J.; Pedersoli, W.; Cullison, R.; Baker, J.; J. Vet. Pharmacol. Ther.1998, 21, 437.
32. Cai, Y.; Jiang, G.; Liu, J.; Zhou, O.; J. Anal. Chem. 2003, 75, 2517.
33. Zhou, Q. X.; Ding, Y. J.; Xiao, J. P.; Anal. Bioanal. Chem. 2006, 85, 1520.
Submitted: November 27, 2010