Article
Printed in Brazil - ©2017 Sociedade Brasileira de Química0103 - 5053 $6.00+0.00*e-mail: [email protected]
Solid-Liquid Extraction with Low Temperature Purification Coupled with Gas
Chromatography and Mass Spectrometry for Determination of Polychlorinated
Biphenyls in Sewage Sludge
Mariana R. Maia, Ana Luíza P. Arcanjo, Gevany P. Pinho* and Flaviano O. Silvério
Instituto de Ciências Agrárias, Universidade Federal de Minas Gerais, Avenida Universitária, 1000, 39404-547 Montes Claros-MG, Brazil
Sewage sludge is the residue produced by the wastewater treatment plants, which can be used as soil conditioner in agriculture. However, the current legislation recommends monitoring chemical contaminants such as polychlorinated biphenyls (PCBs). In this study, solid-liquid extraction with low temperature purification (SLE-LTP) was optimized and validated for monitoring six PCBs. The analyses were performed by gas chromatography and mass spectrometry. Sulfur interference was removed by 1.5 g of copper metal. The extraction was carried out using 6.50 mL isopropanol, 1.50 mL ethyl acetate, 0.1 g NaCl, 0.8 mL water and 15 min into ultrasound. Extraction percentages were between 82 and 94% and relative standard deviation ≤ 16% for low concentrations. Detection and quantification limits were 3.3 and 10 µg kg-1, respectively. The method was applied to
sludge samples collected monthly in the wastewater treatment plant and PCB 52 was detected in six samples.
Keywords: PCB, sewage sludge, SLE-LTP, extraction method
Introduction
Sewage sludge is the solid residue produced by the wastewater treatment plants (WWTP). This residue can be used in agriculture as a fertilizer complement or soil conditioner. The sludge has a high content of organic matter and essential elements to plants such as nitrogen
and phosphorus.1,2
However, sewage sludge may contain chemical contaminants which can be transferred to soil, plants,
animals, rivers and groundwater.3-6 Among the contaminants,
polychlorinated biphenyls (PCBs) stand out for being highly persistent in soil, for their low biodegradability and high lipophilicity and the proven harmful effects on biota and
carcinogenicity on humans.7-10 Although these compounds
have been banned by the 2001 Stockholm Convention, recently, 209 polychlorinated biphenyl congeners have been
identified in sewage effluents.11 The PCB congeners named
28, 52, 101, 138, 153 and 180 are known as indicators of environmental pollution due to their highly frequent
detection in environmental and biological samples.12-14
PCBs are quantified by gas chromatography and mass spectrometric detection (GC-MS) or electron capture
detection (ECD).15 Traditional techniques such as shaker
table,16 soxhlet extraction17 and ultrasound18 are the most
used ones for PCB studies on sewage sludge.19 Accelerated
solvent extraction, a more sophisticated technique, has also
been used.20
Recently, solid-liquid extraction with low temperature purification (SLE-LTP) was used for quantification of polycyclic aromatic hydrocarbons (PAHs) and
chlorobenzenes in sewage sludge.21,22 The principle
of the technique was proposed by McCulley and
McKinley in 1964,23 but only in 2007 the technique was
modified for pyrethroid determination in water, which was initially named liquid-liquid extraction with
low-temperature partition (LLE-LTP).24 Significant advances
in this technique have been achieved for the monitoring of chemical contaminants and, in the last eight years, it has been optimized and validated for different matrices such as
milk,25 tomato,26 human urine,27 beverages,28 human liver,29
pineapple,30 lettuce31 and Caiman yacare eggs.32
technique enables extraction and cleaning of extracts in one step, but depending on the matrix complexity, the extract may be subjected to solid phase extraction (SPE) prior to
chromatographic analysis.33
This study aimed to optimize and validate SLE-LTP of six polychlorinated biphenyls in sewage sludge samples. Extracts were analyzed by gas chromatography-mass spectrometry (GC-MS). The validated method was applied to analyze sludge samples from the WWTP of Montes Claros City, Brazil, from May to November 2013.
Experimental
Materials
PCBs 28, 52, 101, 138, 153 and 180, analytical standard, were purchased from Sigma-Aldrich (St. Louis, USA). The high performance liquid chromatography (HPLC) grade solvents hexane, acetonitrile, ethyl acetate and acetone were purchased from Vetec (Rio de Janeiro, Brazil). Isopropanol was purchased from Carlo Erba (France). Reagents anhydrous sodium sulfate and sodium chloride of purity greater than 99% were purchased from Vetec (Rio de Janeiro, Brazil). Copper metal of 99% purity was purchased from Neon (São Paulo, Brazil). Silica gel 230-400 mesh was purchased from Carvalhaes (Germany).
Equipment and chromatographic analysis
The equipment included a vortex (Phoenix, Brazil), an agitation bath (Solab, Brazil), a centrifuge (Kindly, Brazil), a vacuum pump (New, USA), an ultrasonic bath (Unique, Brazil) and a Visiprep (Supelco, Brazil).
The chromatographic analysis was performed in a 7890A gas chromatograph coupled to 5975C mass spectrometer (Agilent Technologies) using a DB5-MS capillary column (Agilent Technologies), stationary phase 5% phenyl and 95% methylsiloxane, (30 m length × 0.32 mm internal diameter × 0.25 µm film), helium (99.9999% purity) as carrier gas at
1.5 mL min-1 flow rate. The split/splitless injector was held
at 280 °C. The temperature program was 70 °C, 12 °C min-1
to 140 °C, 25 °C min-1 to 190 °C, 7 °C min-1 to 280 °C.
The injection volume was 1 µL in the split ratio 1:5, using a CombiPAL injector. The mass detector was operated in the electron impact mode (70 eV) and a quadrupole mass analyzer. The interface was kept at 280 °C and the ion source at 230 °C. Device control and data acquisition were carried out using the ChemStation software (E.02.02.1431
copyright© 1989-2011- Agilent Technology).
Analyses were performed in selective ion monitoring mode (SIM) and data acquisition was divided into five groups
of ions. Group 1 (0 to 11.50 min) comprised ions 186, 256,
292 m/z; group 2 (11.51 to 13 min) ions 150, 207, 255 m/z;
group 3 (13.01 to 14.50 min) ions 256, 324, 326 m/z;group 4
(14.51 to 16.20 min) ions 290, 360, 362 m/z;and group 5
(16.21 to 18 min) ions 324, 394, 396 m/z.
Standard solutions
Standard stock solutions from the six congeners were prepared separately in hexane in the concentration of
400 mg L-1 and stored at −20 °C. The working solutions
were then prepared from the dilution of the stock solutions in the same solvent, containing all the six congeners in the
concentration of 20 mg L-1.
Sewage sludge samples
Biphenyl-free sludge samples were collected from the drying bed of the wastewater treatment plant of the municipality of Juramento City, Minas Gerais, Brazil. These samples were used during the steps of SLE-LTP optimization and validation. The moisture content was determined by weighing 2.0000 g of sample in five replicates. Samples were placed in an oven at 100 °C and were weighed every hour until constant weight.
The sludge samples were collected in the wastewater treatment plant in the municipality of Montes Claros-MG, from May to November 2013 for application of the method in real samples.
SLE-LTP
The parameters copper mass, extraction solvent composition, form and time of homogenization, change in ionic strength, water pH and elution solvent volume were optimized in the SLE-LTP (Table 1). Extraction percentages
in each optimization condition were analyzed by the t-test
(p < 0.05).
In the optimized method, 4.0000 g of sludge were added to 22-mL glass flask and after spiked with 100 µL
of standard solution (62.5 µg kg-1). The system was
maintained at rest for 3 h. In the sample was added 0.80 mL of an aqueous solution containing 0.1 g NaCl. To the flask was added 6.50 mL isopropanol, 1.50 mL ethyl acetate and 1.5000 g copper metal. The system was homogenized in ultrasonic bath for 15 min and incubated in a stirring water bath at 40 °C for one hour. The samples were then kept at −20 °C for two hours. The extracts were subjected to an additional clean up step in the manifold
with flow rate of 1 mL min-1. The cartridge was prepared
eluted with isopropanol and collected into a 10.00 mL volumetric flask.
Validation
Selectivity, linearity, limit of detection (LOD), limit of quantification (LOQ), accuracy and precision were
evaluated.34 Linearity was evaluated by preparing the
calibration curve with seven concentration levels. The
concentrations 4, 10, 20, 30, 40, 50 and 60 µg L-1 were used
with three independent replicates for each level. The least square linear regression was applied to the experimental data for estimating the regression parameters. The outliers were treated and confirmed by the Jacknife test with maximum exclusion of 22.2% of the data. Regression analysis was evaluated by the parameters normality (Ryan and Joiner test), homoscedasticity (Brown and Forsythe test) and independence (Durbin and Watson test). Analysis of variance (ANOVA) was applied to each solvent and matrix calibration curve to test the lack of fit of linearity. The matrix effect was assessed by calculating the percentage of variation of the chromatographic response
[% = (Āmatrix − Āsolvent) / Āsolvent × 100]. The means of areas
obtained for each PCB in solvent and matrix were compared
by the t-test.
The selectivity of the method was investigated by evaluating the PCB-free samples (blank) in six independent replicates. Other interferences such as solvent derivatives, glassware, adsorbents and reagents were investigated by reapplying the method without using sewage sludge samples.
Limits of detection (LOD) and limits of quantification (LOQ) were determined by fortifying the sludge samples
with biphenyls in the lowest acceptable concentrations. LOD and LOQ were considered as three and ten times, respectively, the baseline noise signal obtained for the samples free of biphenyls (blank).
Accuracy was evaluated by fortification/recovery experiments. Three concentration levels were studied 4,
8 and 20 µg L-1 in three replicates. Recovery values for
each level were considered acceptable when between 70
and 120%.34
Precision, under repeatability conditions, was evaluated by the relative standard deviation (RSD) obtained from fortification/recovery experiments of biphenyls in sludge.
The tests were performed in the concentration of 8 µg L-1
in seven replicates. The acceptability criterion for RSD
was ≤ 20%.34
Results and Discussion
SLE-LTP optimization
Previous studies have shown that the optimum ratio of organic solvent-water mixture in SLE-LTP is 8 to
4 mL.24,26 In this study, the sludge samples contained
80% water (m/m). Thus, 0.8 mL of water was added to 4 g of sludge, resulting in 4 mL of water.
The first SLE-LTP parameter optimized was the addition of copper metal to the sludge sample. Copper removes sulfur compounds that interfere with the
chromatographic analysis.35,36 Thus, different masses of
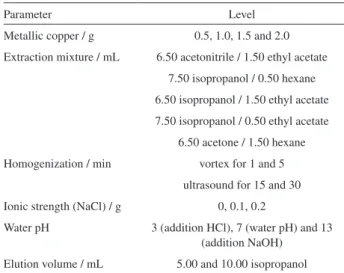
powdered copper were added to the sludge. Addition of 1.5 g of copper removed interferents in the same retention time of the biphenyls and four intense signals named A, B, C and D (Figure 1). Therefore, this mass was used in the other optimization steps.
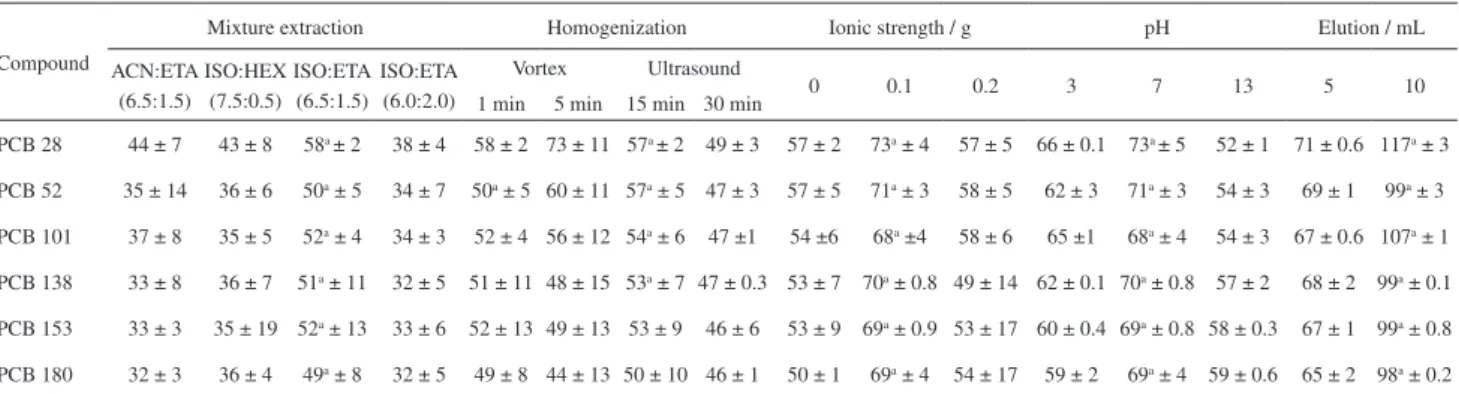
Although acetonitrile is traditionally used in SLE-LTP
as extraction solvent,25 four less polar extractor mixtures
were assessed for the recovery of biphenyls (Table 2). The mixture isopropanol:ethyl acetate in the ratio 6.50:1.50 mL (v/v) had the highest recovery rates for the six biphenyls, with values greater than 50%, as compared by the t-test (p < 0.05).
To improve the percentage recovery of biphenyls, the system homogenization was tested using vortex and ultrasound in two different times (Table 2). The results showed that homogenization in ultrasound for 15 min had higher percentage recovery for four biphenyls, as compared by the t-test (p > 0.05).
Previous studies have reported the salting out effect during the extraction of contaminants in environmental
matrices using SLE-LTP or LLE-LTP.21,37,38 Aliquots of
0.80 mL water containing 0, 0.1 and 0.2 g NaCl were
Table 1. Parameters evaluated in the SLE-LTP of six PCBs in sewage sludge samples
Parameter Level
Metallic copper / g 0.5, 1.0, 1.5 and 2.0
Extraction mixture / mL 6.50 acetonitrile / 1.50 ethyl acetate
7.50 isopropanol / 0.50 hexane
6.50 isopropanol / 1.50 ethyl acetate
7.50 isopropanol / 0.50 ethyl acetate
6.50 acetone / 1.50 hexane
Homogenization / min vortex for 1 and 5
ultrasound for 15 and 30
Ionic strength (NaCl) / g 0, 0.1, 0.2
Water pH 3 (addition HCl), 7 (water pH) and 13 (addition NaOH)
added to the sludge samples during SLE-LTP. Higher amounts of NaCl promoted the separation of the organic and aqueous phases before the temperature lowering and hence they were not used. The higher recovery percentages
were obtained with the addition of 0.1 g NaCl (p < 0.05)
(Table 2). This positive effect is associated with ion solvation by water molecules, facilitating the migration of PCBs into the organic phase.
Although the chemical structure of the biphenyls does not change under pH variation, the sludge matrix components can ionize or degrade, influencing biphenyl extraction. The pH of the water added to the sludge sample was adjusted to 3, 7 and 13. The highest recovery percentages were obtained
at pH 7 for the six biphenyls (Table 2), as compared by the
t-test (p < 0.05). Similar results were reported using SLE-LTP
for extraction of pesticides in honey.33
After the sample freezing in SLE-LTP, the volume of the organic phase reduced from 8 to about 5 mL, because part of the organic solvent was retained in the solidified phase. These 5 mL extracts were subjected to the additional step of cleaning with silica to remove remaining interferents. The isopropanol volume added as eluent changed the recovery percentages of the biphenyls (Table 2). The highest recovery percentages were obtained with a final volume of 10 mL
extract (p < 0.05). Although the addition of the highest
volume of isopropanol had diluted the extract, there was
Figure 1. Total ion chromatograms of sludge extracts obtained by SLE-LTP using 0, 0.5, 1.0, 1.5 and 2.0 g of metallic copper. In addition, standard solution containing the PCBs in acetonitrile at 500 µg L-1.
Table 2. Recovery percentage ± RSD of PCBs in sewage sludge samples during optimization of the SLE-LTP
Compound
Mixture extraction Homogenization Ionic strength / g pH Elution / mL
ACN:ETA (6.5:1.5)
ISO:HEX (7.5:0.5)
ISO:ETA (6.5:1.5)
ISO:ETA (6.0:2.0)
Vortex Ultrasound
0 0.1 0.2 3 7 13 5 10
1 min 5 min 15 min 30 min
PCB 28 44 ± 7 43 ± 8 58a ± 2 38 ± 4 58 ± 2 73 ± 11 57a ± 2 49 ± 3 57 ± 2 73a ± 4 57 ± 5 66 ± 0.1 73a ± 5 52 ± 1 71 ± 0.6 117a ± 3
PCB 52 35 ± 14 36 ± 6 50a ± 5 34 ± 7 50a ± 5 60 ± 11 57a ± 5 47 ± 3 57 ± 5 71a ± 3 58 ± 5 62 ± 3 71a ± 3 54 ± 3 69 ± 1 99a ± 3
PCB 101 37 ± 8 35 ± 5 52a ± 4 34 ± 3 52 ± 4 56 ± 12 54a ± 6 47 ±1 54 ±6 68a ±4 58 ± 6 65 ±1 68a ± 4 54 ± 3 67 ± 0.6 107a ± 1
PCB 138 33 ± 8 36 ± 7 51a ± 11 32 ± 5 51 ± 11 48 ± 15 53a ± 7 47 ± 0.3 53 ± 7 70a ± 0.8 49 ± 14 62 ± 0.1 70a ± 0.8 57 ± 2 68 ± 2 99a ± 0.1
PCB 153 33 ± 3 35 ± 19 52a ± 13 33 ± 6 52 ± 13 49 ± 13 53 ± 9 46 ± 6 53 ± 9 69a ± 0.9 53 ± 17 60 ± 0.4 69a ± 0.8 58 ± 0.3 67 ± 1 99a ± 0.8
PCB 180 32 ± 3 36 ± 4 49a ± 8 32 ± 5 49 ± 8 44 ± 13 50 ± 10 46 ± 1 50 ± 1 69a ± 4 54 ± 17 59 ± 2 69a ± 4 59 ± 0.6 65 ± 2 98a ± 0.2
a considerable gain in signal-noise ratio compared with techniques such as soxhlet (Method 3540C) and ultrasound
(3550C Method)16,17 (Figure S1).
Validation
Linearity, matrix effect and selectivity
After optimization, the method was validated by estimating the seven main figures of merit. The linearity of detector response was evaluated using seven concentration levels, including the limit of quantification, the maximum residue limit and the concentration used in the method optimization. Concentrations were equally spaced in the range evaluated. Replicates of each calibration point provided information on the inherent variability of the response measurements (pure error). The calibration data were obtained by linear regression and the determination
coefficients (R2) were greater than 0.99 (Table 3). The lack
of fit was not significant (p > 0.05) for the analytical curves
prepared in the solvent and matrix extract, indicating the
linearity of response in the range 4-60 µg L-1 (Table 3).
Linearity was assessed by the ordinary least squares method (OLSM). The outliers were confirmed by the Jacknife residue test, with maximum exclusion of 22.2% in 21 replicates (Figure 2). The Ryan-Joiner test confirmed that the regression residuals were normally distributed, with correlation coefficients greater than the critical values and non-significant deviation from normality for the curves (Figure 3). Levene’s test confirmed the homoscedasticity of residues, demonstrating the homogeneous distribution of residues. Independence of regression residuals with distribution of points without positive or negative trend was confirmed by the Durbin-Watson test (Figure 4). The results
obtained after the tests confirmed the OLSM suitability to PCB 28 (Figures 2, 3 and 4) and similar results were found for the other biphenyls studied (data not shown). This complete system for linearity evaluation followed a procedure based on an acceptable and consistent statistics
proposed by Souza and Junqueira.39
The matrix effect was detected in the GC-MS analysis for the six biphenyls, with significant differences in the chromatographic responses in hexane and in the sludge
extract obtained after SLE-LTP (p < 0.05). The matrix effect
Table 3. ANOVA statistics for regression including lack of fit-test for the solvent and matrix-matched calibration curves
PCB Slope Intercept R2 F-test p
28 hexane 184.63 −175.94 0.9949 0.198 0.664
matrix 215.89 −137.63 0.9917
52 hexane 137.25 −155.03 0.9989 0.020 0.890
matrix 146.97 −229.79 0.9935
101 hexane 175.41 −160.55 0.9978 0.039 0.846
matrix 185.99 −85.59 0.9928
138 hexane 157.66 −17.915 0.9957 0.082 0.780
matrix 227.49 −217.24 0.9936
153 hexane 143.37 −26.50 0.9977 0.217 0.649
matrix 178.13 −198.91 0.9915
180 hexane 178.26 −41.146 0.9982 0.244 0.630
matrix 226.57 −400.62 0.9945
PCB: polychlorinated biphenyls; F-test: variance ratio; p: significance.
Figure 2. Residual plots for outlier diagnose by Jacknife standardized residuals test in matrix-matched calibration curve to PCB28.
caused an overestimation of analytical results, indicating a positive matrix effect. The increase of the chromatographic response in the analysis of the biphenyl standard solution at
50 µg L-1 was 75, 72, 110, 151, 150 and 156% for PCBs 28,
52, 101, 138, 153 and 180, respectively. The area variation is associated with retention time of the six biphenyl since the longer the retention time, the greater the matrix effect. Similar results were found for pesticide analysis in tomato
using SLE-LTP.26
The selectivity of the method was demonstrated by the absence of interferents in the retention time of the six biphenyls during the analyses of biphenyl-free sludge extracts (blank) (Figure 5).
Detection and quantification limits
The LOD achieved for the six biphenyls was 1.3 µg L-1 for
the matrix extract and 3.3 µg kg-1 for the sludge sample. The
LOQ for the six biphenyls were 4.0 µg kg-1 and 10.0 µg kg-1
for the extract and the sludge sample, respectively. This value was less than the maximum residue limit established
by Sewage Sludge Directive of the European Community40
that establishes limit for biphenyl < 800 µg kg-1.
Accuracy and precision
The accuracy evaluates the closeness of agreement between the measured values and the true value. Accuracy was assessed using recovery experiments at concentrations of 1 × LQ, 2 × LQ and 5 × LQ,
corresponding to 10, 20 and 50 µg kg-1 of biphenyls
in sewage sludge. The recovery percentages of the
concentrations 10 and 50 µg kg-1 were in compliance with
the recommendations of the European Commission40
which establish for concentrations ≥ 10 µg kg-1 recoveries
between 80 and 110%. These results are in accordance with International Union of Pure and Applied Chemistry (IUPAC) recommendations that suggest the range of 70 to
120%.34 Precision tests evaluate the agreement between
the results. Precision was evaluated under repeatability
conditions in the concentration of 8 µg L-1 with satisfactory
results, since RSD was less than 18% (Table 4).
Application of the method
Of the seven samples tested, PCB 52 was detected in June, July and August, and quantified in September
(60 µg kg-1), October (70 µg kg-1) and November
(50 µg kg-1). Similar concentrations of this biphenyl
Figure 4. Plots of residuals autocorrelation to PCB28: ei, residual and d, Durbin-Watson statistic.
were found in a study conducted in Turkey in the period
2009-2010.41 The three samples had concentrations within
the acceptable limit for biphenyls in sludge according to
the European Community legislation (< 800 µg kg-1).40
Conclusions
Solid-liquid extraction with low temperature purification was optimized and validated for the determination of six PCBs in sewage sludge. The method is simple, easy to perform and has low consumption of solvents and samples. The technique is efficient with recovery rates higher than 80% in the limit of quantification for PCBs. PCB 52 was quantified in 40% of the analyzed sludge samples with values below the maximum acceptable limit established by the European Community legislation. The method is a viable alternative for monitoring PCBs in sewage sludge used for agricultural purposes.
Supplementary Information
Supplementary data are available free of charge at http://jbcs.sbq.org.br as PDF file.
Acknowledgments
Authors thank the National Council of Technological and Scientific Development (CNPq) and the foundation for Research Support of the State of Minas Gerais (FAPEMIG) (APQ-01786-13) for the financial support, and the Federal University of Minas Gerais (UFMG) for the infrastructure offered.
References
1. Passuello, A.; Cadiach, O.; Perez, Y.; Schuhmacher, M.; Environ. Int. 2010,38, 1.
2. Zhang, L.; Xu, C.; Champagne, P.; Mabee, W.; Waste Manage. Res. 2014, 32, 586.
3. Leiva, C.; Ahumada, I.; Betsabet, S.; Richter, P.; Chemosphere 2010, 79, 273.
4. Rhind, S. M.; Kyle, C. E.; Kerr, C.; Osprey, M.; Zhang, Z. L.; Sci. Total Environ. 2011, 409, 3850.
5. Yager, T. J. B.; Furlong, E. T.; Kolpin, D. W.; Kinney, C. A.; Zaugg, S. D.; Burkhardt, M. R.; J. Am. Water Resour. Assoc. 2014, 50, 343.
6. Wen, B.; Li, L.; Zhang, H.; Mab, Y.; Shan, X.; Zhang, S.; Environ. Pollut. 2014,184, 547.
7. Agency for Toxic Substances and Disease Registry (ATSDR); Toxicology Profile for Polychlorinated Biphenyls (BPCs), Department of Health and Human Services, Public Health Service: Atlanta, 2000.
8. El-Shahawi, M. S.; Hamza, A.; Bashammakh, A. S.; Al-Saggaf, W. T.; Talanta2010, 80, 1587.
9. Adenugba, A.; Khan, S. A.; Taylor-Robinson, S. D.; Cox, I. J.; Toledano, M. B.; Thillainayagam, A. V.; Bansi, D. S.; Thomas, H. C.; Gibson, R. W.; Beck, A. J.; Chemosphere 2009, 76, 841.
10. Breivik, K.; Sweetman, A.; Pacyna, J. M.; Jones, K. C.; Sci. Total Environ. 2002, 290, 181.
11. Balasubramani, A.; Howell, N. L.; Rifai, H. S.; Sci. Total Environ. 2014, 473, 702.
12. Mohr, S.; Schwanz, T. G.; Wagner, R.; Soldatelli, L.; Costabeber, I. H.; Quim. Nova 2011, 34, 444.
13. Guo, L.; Zhang, B.; Xiao, K.; Zhang, Q.; Zheng, M.; J. Environ. Sci. 2009, 21, 468.
14. Rhind, S. M.; Kyle, C. E.; Ruffie, H.; Calmettes, E.; Osprey, M.; Zhang, Z. L.; Hamilton, D.; McKenzie, C.; Environ. Pollut. 2013, 181, 262.
15. Zabelina, O. N.; Saloutin, V. I.; Chupakhin, O. N.; J. Anal. Chem. 2010,65, 1098.
16. Zuloaga, O.; Navarro, P.; Bizkarguenaga, E.; Iparraguirre A.; Vallejo, A.; Olivares, M.; Prieto, A.; Anal. Chim. Acta 2012, 736, 7.
17. United States Environmental Protection Agency (US EPA); Method 3540C, Test Methods for Evaluating Solid Waste
Physical/Chemical Methods, SW-846 on CD-ROM; National Technical Information Service (NTIS), U.S. Department of Commerce: Springfield, USA, 1996.
18. United States Environmental Protection Agency (US EPA); Method 3550C, Test Methods for Evaluating Solid Waste
Physical/Chemical Methods, SW-846 on CD-ROM; National
Table 4. Mean recovery and relative standard deviation (RSD) for sewage sludge spiked at different level
Concentration / (µg L-1)
Recovery (mean ± RSD) / %
PCB 28 PCB 52 PCB 101 PCB 138 PCB 153 PCB 180
4a 83 ± 12 82 ± 5 89 ± 14 86 ± 11 94 ± 15 82 ± 16
8b 87 ± 18 89 ± 5 77 ± 6 61 ± 12 64 ± 11 66 ± 13
20a 86 ± 16 85 ± 11 84 ± 12 88 ± 7 91 ± 6 84 ± 1
Technical Information Service (NTIS), U.S. Department of Commerce: Springfield, USA, 2000.
19. Ilyas, M.; Sudaryanto, A.; Setiawan, I. E.; Riyadi, A. S.; Isobe, T.; Tanabe, S.; Chemosphere 2013, 93, 1500.
20. Bolzonella, D.; Fatone, F.; Pavan, P.; Cecchi, F.; Bioresour. Technol. 2010, 101, 9445.
21. Barbosa, E. S.; Evangelista, G. F.; Pimenta, E. M.; Silverio, F. O.; Pinho, G. P.; Quim. Nova 2014, 37, 404.
22. Pinho, G. P.; Silvério, F. O.; Evangelista, G. F.; Mesquita, L. V.; Barbosa, E. S.; J. Braz. Chem. Soc. 2014,25, 1292. 23. McCulley, K. A.; McKinley, W. P.; J. - Assoc. Off. Anal. Chem.
1964, 47, 652.
24. Vieira, H. P.; Neves, A. A.; Queiroz, M. E. L. R.; Quim. Nova 2007, 30, 535.
25. Goulart, S. M.; Queiroz, M. E. L. R.; Neves, A. A.; Queiroz, J. H.; Talanta 2008,75, 1320.
26. Pinho, G. P.; Neves, A. A.; Queiroz, M. E. L. R.; Silvério, F. O.; Food Chem. 2010,121, 251.
27. Magalhães, E. J.; Nascentes, C. C.; Augusti, R.; Queiroz, M. E. L. R.; Silva, J. C. C.; Afonso, R. J. C. F.; Am. J. Anal. Chem. 2012, 3, 118.
28. Goulart, S. M.; Alves, R. D.; Paula, W. X.; Queiroz, J. H.; Neves, A. A.; Queiroz, M. E. L. R.; J. Braz. Chem. Soc. 2012, 23, 1154.
29. Magalhães, E. J.; Queiroz, M. E. L. R.; Penido, M. L. O.; Paiva, M. A. R.; Teodoro, J. A. R.; Augusti, R.; Nascentes, C. C.; J. Chromatogr. A 2013, 1909, 15.
30. Morais, E. H. C.; Rodrigues, A. A. Z.; Queiroz, M. E. L. R.; Neves, A. A.; Morais, P. H. D.; Food Control 2014, 42, 9. 31. Costa, A. I. G.; Queiroz, M. E. L. R.; Neves, A. A.; Sousa, F.
A.; Zambolim, L.; Food Chem. 2015, 181, 64.
32. Sousa, D. A.; Gonçalves, R. M.; Heleno, F. F.; Queiroz, M. E. L. R.; Marchi, M. R. R.; Microchem. J. 2014, 114, 266. 33. Pinho, G. P.; Neves, A. A.; Queiroz, M. E. L. R.; Silvério, F.
O.; Food Control 2010, 21, 1307.
34. Thompson, M.; Ellison, S. L. R.; Wood, R.; Pure Appl. Chem. 2002, 74, 835.
35. Hong, Q.; Wang, Y.; Luo, X.; Chen, S.; Chen, J.; Cai, M.; Mai, B.; Chemosphere 2012,88, 1340.
36. Folch, I.; Vaquero, M. T.; Comellas, L.; Broto-Puing, F.; J. Chromatogr. A1996, 719, 121.
37. Goulart, S. M.; Alves, R. D.; Neves, A. A.; Queiroz, J. H.; Assis, T. C.; Queiroz, M. E. L. R.; Anal. Chim. Acta 2010, 671, 41. 38. França, J. A.; Brandão, M.; Sodré, F. F.; Caldas, E. D.; Forensic
Toxicol. 2015, 33, 93.
39. Souza, S. V. C.; Junqueira, R. G.; Anal. Chim. Acta 2005, 552, 25.
40. European Commission (EC); Council Directive 96/23/EC: Performance of Analytical Methods and the Interpretation of
Results; Official Journal of the European Communities, 2002. 41. Ozcan, S.; Tor, A.; Mehmet, E. A.; Clean: Soil, Air, Water 2013,
41, 411.
Submitted: January 27, 2016