CERN-PH-EP/2012-274 2013/03/19
CMS-TOP-11-021
Measurement of the single-top-quark t-channel cross
section in pp collisions at
√
s
=
7 TeV
The CMS Collaboration
∗Abstract
A measurement of the single-top-quark t-channel production cross section in pp col-lisions at√s = 7 TeV with the CMS detector at the LHC is presented. Two different and complementary approaches have been followed. The first approach exploits the distributions of the pseudorapidity of the recoil jet and reconstructed top-quark mass using background estimates determined from control samples in data. The second approach is based on multivariate analysis techniques that probe the compatibility of the candidate events with the signal. Data have been collected for the muon and electron final states, corresponding to integrated luminosities of 1.17 and 1.56 fb−1, respectively. The single-top-quark production cross section in the t-channel is mea-sured to be 67.2±6.1pb, in agreement with the approximate next-to-next-to-leading-order standard model prediction. Using the standard model electroweak couplings, the CKM matrix element|Vtb|is measured to be 1.020±0.046 (meas.)±0.017 (theor.).
Submitted to the Journal of High Energy Physics
c
2013 CERN for the benefit of the CMS Collaboration. CC-BY-3.0 license
∗See Appendix A for the list of collaboration members
1
Introduction
Single top quarks can be produced through charged-current electroweak interactions. Due to the large top-quark mass, these processes are well suited to test the predictions of the standard model (SM) of particle physics and to search for new phenomena. Measurements of the single-top-quark production cross section also provide an unbiased determination of the magnitude of the Cabibbo–Kobayashi–Maskawa (CKM) matrix element|Vtb|.
Single-top-quark production was observed in proton–antiproton collisions at the Tevatron col-lider with a centre-of-mass energy of 1.96 TeV [1–3]. The cross section increases by a factor of 20 at the Large Hadron Collider (LHC) with respect to the Tevatron. The first measurements of the single-top-quark production cross section in proton–proton collisions at a centre-of-mass energy of 7 TeV were performed by the Compact Muon Solenoid (CMS) [4] and ATLAS [5, 6] experiments.
Previous measurements are compatible with expectations based on approximate next-to-leading-order and next-to-next-to-leading logarithm (NLO+NNLL) perturbative quantum chromody-namics (QCD) calculations. In these calculations, three types of parton scattering processes are considered: t-channel and s-channel processes, and W-associated single-top-quark production (tW). The dominant contribution to the cross section is expected to be from the t-channel pro-cess with a cross section of σt-ch.th =64.6+−2.10.7−+1.51.7pb [7] for a top-quark mass of mt=172.5 GeV/c2.
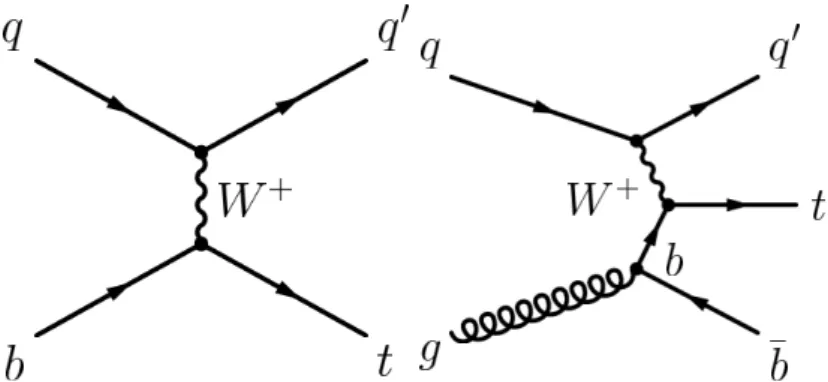
Figure 1: Leading order Feynman diagrams for single-top-quark production in the t-channel: 2→2 (left) and 2→3 (right).
This paper extends the previous CMS measurement [4] of the t-channel cross section. The single-top-quark production cross section measurement is based on pp collision data at√s =
7 TeV collected during 2011 with the CMS experiment, corresponding to integrated luminosities of 1.17 and 1.56 fb−1with muon and electron final states, respectively. Events with leptonically decaying W bosons are selected: t → bW → b`ν(` = e or µ). This measurement is used to determine the CKM matrix element|Vtb|.
The t-channel event signature (Fig. 1) typically comprises one forward jet scattered off a top quark. The decay products of the top quark mainly appear in the central region of the detec-tor. A dedicated event selection is applied, and then measurements with two complementary approaches are performed. The first approach exploits the reconstructed top-quark mass and one of the angular properties specific to t-channel top-quark production: the forward pseudo-rapidity distribution of the light jet recoiling against the top quark. This analysis is referred to as the|ηj0|analysis. It is straightforward and robust and has little model dependence. The second approach exploits, via multivariate discriminators, the compatibility of the signal can-didates with the event characteristics predicted by the SM for electroweak top-quark produc-tion. This approach aims for a precise t-channel cross section measurement by optimising the
2 3 Collision Data and Simulation
discrimination between signal and background. The systematic uncertainties are constrained by simultaneously analysing phase space regions with substantial t-channel single-top-quark contributions and regions where they are negligible. Because of the higher complexity of this approach, two independent multivariate analyses are conducted that cross-check each other. One is based on a Neural Network (NN) and the other on Boosted Decision Trees (BDT). After validating the consistency of the results, the final result is determined by combining the three analyses using the Best Linear Unbiased Estimator (BLUE) [8].
2
CMS Detector
The CMS Detector is described in detail elsewhere [9], and the key components for this anal-ysis are listed below. The main feature of the CMS detector is a superconducting solenoidal magnet with a length of 13 m and a diameter of 6 m which provides an axial magnetic field of 3.8 T. The bore of the solenoid contains various particle detection systems. Charged particle trajectories are recorded by the silicon pixel and strip tracker covering the region|η| < 2.5, where the pseudorapidity η is defined as η = −ln[tan(θ/2)], with θ the polar angle of the trajectory of the particle with respect to the anticlockwise beam direction. A crystal electro-magnetic calorimeter (ECAL) and a brass/scintillator hadronic calorimeter (HCAL) surround the tracking volume and extend to|η| <3.0. A quartz-fibre and steel absorber Cherenkov-light hadron forward detector extends the calorimeter coverage to|η| <5.0. Muons are detected in gas-ionization detectors embedded in the steel return yoke outside the solenoid. The detector is nearly hermetic, which permits good energy balance measurements in the plane transverse to the beam line.
3
Collision Data and Simulation
The present analyses use data sets collected during 2011 corresponding to integrated luminosi-ties of 1.17 and 1.56 fb−1for the muon and electron channels, respectively.
Single-top-quark t-channel signal events from Monte Carlo (MC) simulation used in this study have been generated with the next-to-leading-order (NLO) MC generatorPOWHEG[10–13] in-terfaced to PYTHIA 6.4.24 [14] for the parton showering simulation. This ensures good mod-elling of the 2→2 (Fig. 1, left) process and all NLO contributions, in particular of the 2→3 diagram (Fig. 1, right). Signal events have also been generated using COMPHEP [15] to study systematic uncertainties related to the MC generator. A top-quark mass of 172.5 GeV/c2 has been assumed in the simulations.
Several SM processes are taken into account as background to the analysis. ThePOWHEG gen-erator interfaced withPYTHIAis used to model the single-top-quark tW and s-channel events, which are considered as background in this analysis. The tree-level matrix-element generator MADGRAPH[16] interfaced toPYTHIAis used for top-quark pair (tt) production and for inclu-sive single boson production V + X, where V = W or Z, and X can indicate one or more light or heavy partons. In the following, we will explicitly distinguish the processes with V+light par-tons, Wc, and VQQ, with Q = b or c. A procedure implemented during the event generation and based on the “MLM prescription” [17] avoids double counting between matrix element and parton shower generated jets. The remaining background samples are simulated using PYTHIA. These include diboson production (WW, WZ, ZZ), γ+jets, and multijet QCD enriched events with electrons or muons coming from the decays of b and c quarks, as well as muons from the decay of long-lived hadrons. TheCTEQ6 [18] parton distribution functions are used for all simulated samples.
All generated events undergo a full simulation of the detector response according to the CMS implementation of GEANT4 [19], and are processed by the same reconstruction software used for collision data.
4
Event Selection and Reconstruction
Events are characterized by a single isolated muon or electron and momentum imbalance due to the presence of a neutrino, with one central b jet from the top-quark decay. An additional light-quark jet from the hard-scattering process is often present in the forward direction. A second b jet produced in association with the top quark can also be present (Fig. 1, right), although it yields a softer pT spectrum with respect to the b jet coming from the top-quark
decay.
The trigger used for the online selection of the analysed data for the muon channel is based on the presence of at least one isolated muon with a transverse momentum pT >17 GeV/c. For the
electron channel, an isolated electron trigger with a transverse momentum pT >27 GeV/c was
used for the initial data-taking period, corresponding to an integrated luminosity of 216 pb−1. For the remaining data-taking period, a trigger selecting at least one electron with pT >25 GeV/c
and a jet with pT>30 GeV/c was used. The jet is identified in the trigger processing as coming
from a fragmentation of a b quark using the Track Counting High-Efficiency (TCHE) b-tagging algorithm described in Ref. [20].
At least one primary vertex is required, reconstructed from a minimum of four tracks, with a longitudinal distance of less than 24 cm, and a radial distance of less than 2 cm from the nominal interaction point. To select good muon and electron candidates, the same lepton iden-tification as described in Ref. [21] is applied. Electrons, muons, photons, and charged and neutral hadron candidates are reconstructed and identified using the CMS particle-flow (PF) algorithm [22]. The missing transverse momentum vector p/ is reconstructed from the mo-~T
mentum imbalance of PF particle candidates in the plane transverse to the beams direction. The magnitude ofp/ is the missing transverse energy E/~T T. The presence of exactly one isolated
muon or electron candidate originating from the primary vertex is required in the event. Muon candidates are selected by requiring a transverse momentum pT > 20 GeV/c and a
pseudora-pidity|η| < 2.1. Electron candidates must have a transverse momentum pT > 30 GeV/c and
|η| <2.5. Lepton isolation Irel` is defined as the sum of the transverse energy deposited by
sta-ble charged hadrons, neutral hadrons, and photons in a cone of∆R= p(∆η)2+ (∆φ)2 = 0.4
around the charged-lepton track, divided by the transverse momentum of the lepton. Muon isolation is ensured by requiring Irel` < 0.15, while the isolation requirement is tightened to 0.125 for electrons. An electron candidate is rejected if it is identified as originating from the conversion of a photon into an electron–positron pair or if it fails the identification criteria de-scribed in Ref. [21]. Events are also rejected if an additional muon candidate is present that passes looser quality criteria, namely, pT > 10 GeV/c,|η| < 2.5, and Irel` < 0.2. For additional electrons, the required transverse momentum is pT>15 GeV/c.
Jets are defined by clustering PF candidates according to the anti-kTalgorithm [23] with a
dis-tance parameter of 0.5. The analysis considers jets whose calibrated transverse momentum is greater than 30 GeV/c for|η| < 4.5. An event is accepted for further analysis only if at least two such jets are reconstructed. A jet is identified as coming from a b-quark fragmentation if it passes a tight threshold on the Track Counting High-Purity (TCHP) b-tagging algorithm [20] corresponding to a misidentification probability of 0.1%. The difference between simulated and measured b-tagging efficiencies, for true and misidentified b jets, is corrected by scaling
4 4 Event Selection and Reconstruction
the simulated event yields according to pT-dependent scale factors determined from control
samples from the data [20].
Events with a muon that is not from a leptonic decay of a W boson are suppressed by requiring a reconstructed transverse W boson mass mT =
q
2pTE/T(1−cos(∆φ`,p/~T )) >40 GeV/c2, where
∆φ`,p/~T is the azimuthal angle between the muon and thep/ directions and p~T Tis the transverse
momentum of the muon. For the electron channel, where the QCD multijet contamination is larger, the requirement E/T >35 GeV is applied instead of the mTselection.
To classify signal and control samples, different event categories are defined and denoted as “n-jets m-btags”, where n is the number of selected jets (2, 3, or 4) and m is the number of se-lected b-tagged jets (0, 1, or≥2). The single-top-quark t-channel signal is primarily contained in the category “2-jets 1-btag”, followed by “3-jets 1-btag”, as the second b jet, which is pro-duced in association with the top quark, is mostly out of acceptance. The other categories are dominated by background processes with different compositions. In particular, the “2/3-jets 0-btags” categories are enriched in events with a W boson produced in association with light partons (u, d, s, g). The “3-jets 2-btags” and “4-jets 0/1/2-btags” categories are enriched in tt events.
To extract the signal content, the NN and BDT analyses utilize the following six categories si-multaneously for the measurement of the signal cross section: “2-jets 1-btag”, “3-jets 1-btag”, “4-jets 1-btag”, “2-jets 2-btags”, “3-jets 2-btags”, and “4-jets 2-btags”. The latter four categories are used to constrain nuisance parameters (e.g. the b-tagging efficiency or background normal-isation). Besides these six categories, the three 0-tag categories are used to check the modelling of input variables. The|ηj0|analysis extracts the signal content from the “2-jets 1-btag” cate-gory only, but uses the “2-jets 0-btags” and “3-jets 2-btags” categories to check the modelling of backgrounds.
The reconstruction of the top quark from its decay products leads to multiple choices of pos-sible top-quark candidates. In the first step, the W-boson candidate is reconstructed from the charged lepton and fromp/ following the procedure described in Ref. [4]. In the second step,~T
the top-quark candidate is reconstructed by combining the W-boson candidate with a jet iden-tified as coming from a b quark, and its mass m`νb is calculated. Depending on the analysis
category, the ambiguity in the choice of the b-quark jet from the top-quark decay and the re-coiling light quark has to be resolved. Events in the “2-jets 1-btag” category have no ambiguity: the b-tagged jet is associated with the top-quark decay, and the other jet is considered to be a light-quark jet.
In the other categories, the top quark and light-quark jet reconstruction has been optimized for the purpose of each analysis and differs among them. In the NN and BDT analyses, the most forward jet is chosen to be the light-quark jet in categories where two jets and zero or two b tags are required. The other jet is associated with the top-quark decay. In categories where three or more jets are required, in the case of one or two required b tags, the jet with the lowest value of the TCHP discriminator is assumed to originate from the light quark. If no b tag is required, the most forward jet is associated with the light quark. From the remaining jets, the one which together with the reconstructed W boson has a reconstructed top-quark mass m`νbclosest to mt = 172.5 GeV/c2 is chosen as the b jet coming from the top-quark decay. In
the|ηj0|analysis, the jet with the highest value of the TCHP discriminator is used for the top-quark reconstruction in the “2-jets 0-btags” and “3-jets 2-btags” categories. The inclusive |η| distribution of both jets is used in “2-jets 0-btags”, while for the “3-jets 2-btags” category the
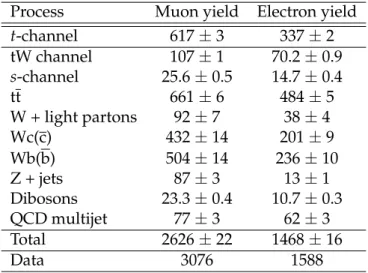
In the |ηj0|analysis the invariant mass m`νb of the reconstructed top quark is used to further divide the “2-jets 1-btag” category into a t-channel enriched signal region (SR), defined by selecting events within the mass range 130<m`νb<220 GeV/c2, and a W boson and tt enriched
sideband region (SB), defined by selecting events that are outside this m`νbmass window. The
event yield in the SR is summarised in Table 1 for the muon and electron channels, together with expectations from simulated signal and backgrounds, and for QCD multijet events, which are determined from control samples of data, as described in Section 5.1.
Table 1: Event yield with statistical uncertainties of the|ηj0|analysis for the signal and main background processes in the signal region, after applying the m`νbmass requirement for the µ
and e channels. The yields are taken from simulation except for the QCD multijet yield, which is obtained from control samples of data as described in Section 5.1. The normalisation of the Wc(¯c) and Wb( ¯b) processes is further discussed in Section 5.2.
Process Muon yield Electron yield
t-channel 617±3 337±2 tW channel 107±1 70.2±0.9 s-channel 25.6±0.5 14.7±0.4 tt 661±6 484±5 W + light partons 92±7 38±4 Wc(c) 432±14 201±9 Wb(b) 504±14 236±10 Z + jets 87±3 13±1 Dibosons 23.3±0.4 10.7±0.3 QCD multijet 77±3 62±3 Total 2626±22 1468±16 Data 3076 1588
5
Background Estimation and Control Samples
Several control data samples are used for two main purposes:
• to check the distributions of variables used as inputs to the analyses and the agree-ment between data and simulation;
• to determine from data the yields and distributions of variables of interest for the main background processes.
All the analyses use rate and shape determinations from QCD multijet background data. The
|ηj0|analysis also determines the yields and distributions of the background processes by us-ing W boson production in association with jets from light quarks as well as c and b quarks. The NN and BDT analyses take the shape of the W+jets background from MC simulation, but consider the impact of shape uncertainties in the evaluation of the systematic uncertainties. In all three analyses the rate of the W+jets background is determined “in situ” by the signal extraction method as described in Section 9.
5.1 QCD Multijet Background Estimation
The yield of the QCD multijet background in the different categories is measured by perform-ing fits to the distributions of the transverse W boson mass mT in the muon channel and E/Tin
6 5 Background Estimation and Control Samples
the electron channel. A maximum-likelihood fit to the distribution of mT or E/T is performed
assuming the following parameterisation: F(x) = a·S(x) +b·B(x), where x is mT or E/T for
the muon and electron channels, respectively, and S(x)and B(x)are the expected distributions for the sum of all processes including a W boson in the final state and for QCD multijet events, respectively. The function S(x)is taken from simulation, while B(x)is extracted directly from data. The parameters a and b are determined from the fit. The QCD multijet background yield is estimated to be the area of the fitted curve b·B(x)in the range mT >40 GeV/c2for the muon
channel and E/T >35 GeV for the electron channel, as mentioned in Section 4.
QCD multijet enriched samples from data are used to model the distributions B(x)of mT and
E/T. For the muon channel, this sample is selected by inverting the isolation requirement. For
the electron channel, the selected electron is required to fail at least two of the three following quality requirements: Irel` < 0.1, the distance of closest approach to the primary vertex on the x-y plane δxy <0.02 cm, and the electron identification criteria given in Ref. [21]. It was verified
by simulation that the mTand E/Tdistributions for QCD multijet like events are not significantly
affected by this altered event selection.
In the|ηj0|analysis the fits to the mT and E/T distributions cannot be performed reliably in the SR and SB separately due to the limited size of the simulated samples, which would introduce large uncertainties in the signal modelling. For this reason, the fit is performed on the entire “2-jets 1-btag” sample. The number of QCD multijet events in the SB and SR regions is deter-mined by scaling the total QCD multijet yield, obtained from the fit, by the fraction of events in the two regions (SB and SR) of the m`νbdistribution, as determined from the QCD multijet
enriched region. In the simulation, the distributions of the relevant variables obtained from the QCD multijet enriched sample are consistent with the ones in the SR. The QCD multijet yields restricted to the SR are reported in Table 1.
For all three analyses, the relative uncertainties on the QCD multijet yield estimates are taken to be±50% for the muon channel and±100% for the electron channel. Several cross checks have been performed; for example, the same fits have been repeated taking B(x)from simulation for both channels. Moreover, the choice of x = mT or E/T has been inverted for the muon and
electron channels, in this way performing fits on mT for the electron channel and E/T for the
muon channel. The results in each case are in agreement with the previous estimate within the assumed uncertainties.
5.2 W+jets Background Estimation and Other Control Samples
A check of the modelling for the W+jets background is carried out for each of the three analyes in the 0-tag control regions. In particular, the “2-jets 0-btags” category is highly enriched in W+light jet events. The modelling of tt background is checked in the “3-jets 2-btags” as well as the “4-jets” categories. In general, the event yields are reasonably well reproduced by the simulation within the systematic uncertainties. The shapes of the relevant variables, |ηj0|and m`νb, and the input variables of the NN and BDT analyses show good agreement between data
and simulation.
Table 1 shows a difference between the total observed and expected yields for the|ηj0|analysis. This difference can be attributed to excesses in data for the Wb+X and Wc+X processes. The ATLAS collaboration reported in Ref. [24] that the fiducial W+b-jet cross section in the lepton and one or two jets final state is a factor of 2.1 larger than the NLO prediction, but is still consistent at the level of 1.5 standard deviations with this SM prediction.
anal-ysis determines the W+jets background yield and|ηj0|distribution from data. The|ηj0| distribu-tion for W+jets process is extracted from the SB by subtracting the|ηj0|distribution of all other processes from the data. The event yield and|ηj0|distributions used for these subtractions are taken from simulations of tt, single-top-quark s- and tW- channels, and diboson production. The QCD multijet event yield and|ηj0|distribution are extracted from data and extrapolated to the SB as described in Section 5.1. The |ηj0| distribution for W+jets processes in the SB is therefore used in the SR for the signal extraction procedure (see Section 6), assuming that the shapes in the SB and SR are compatible with each other. For the muon channel, the compati-bility of the distributions in the two regions has been verified through a Kolmogorov–Smirnov compatibility test, yielding a p-value of 0.47, and a χ2test, yielding a p-value of 0.63. For the electron channel, the Kolmogorov–Smirnov compatibility test has a p-value of 0.51 and the χ2 test a p-value of 0.60. The stability of the extracted shape has been tested by varying the sample composition in terms of tt and signal fractions by 20% and 100%, respectively. The extracted shapes are compatible with a p-value greater than 0.9 in both cases.
6
The
|
η
j0|
Analysis
The signal yield is extracted using a maximum-likelihood fit to the observed distribution of
|ηj0|. The signal distribution for the fit is taken from simulation. The W/Z+jets component of the background is normalised to the value obtained from the extraction procedure described in Section 5.2, and then added to the diboson processes, resulting in the electroweak component of the background for the fit. The signal and the electroweak components are unconstrained in the fit, whereas the QCD multijet component is fixed to the result determined in Section 5.1. A Gaussian constraint is applied to tt and other top-quark backgrounds. Figure 2 shows the distribution of|ηj0|obtained from the fit. Figure 3 shows the distribution of the reconstructed
| j' η | 0 0.5 1 1.5 2 2.5 3 3.5 4 4.5 5 Events 0 50 100 150 200 250 300 350 Data t-channel , s-channel, tW t t W/Z + jets, Diboson QCD multijet Muon -1 = 7 TeV L = 1.17 fb s CMS | j' η | 0 0.5 1 1.5 2 2.5 3 3.5 4 4.5 5 Events 0 50 100 150 200 250 300 350 400 Data t-channel , s-channel, tW t t W/Z + jets, Diboson QCD multijet Electron -1 = 7 TeV L = 1.56 fb s CMS
Figure 2: Result of a simultaneous fit to |ηj0| in the muon (left) and electron (right) decay channels.
top-quark mass m`νbnormalised to the fit results, restricting to the highly enriched region of
single-top-quark events for|ηj0| >2.8.
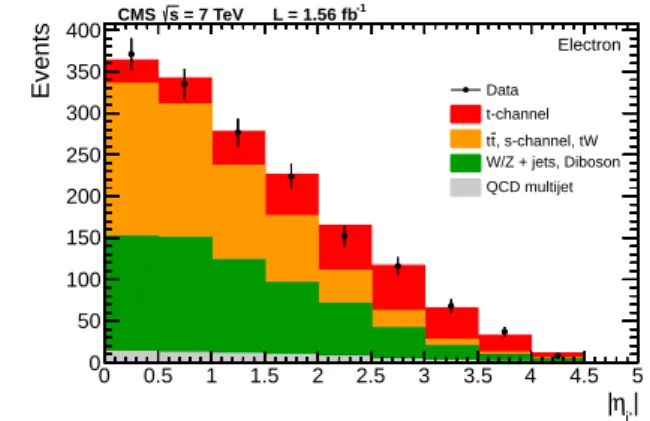
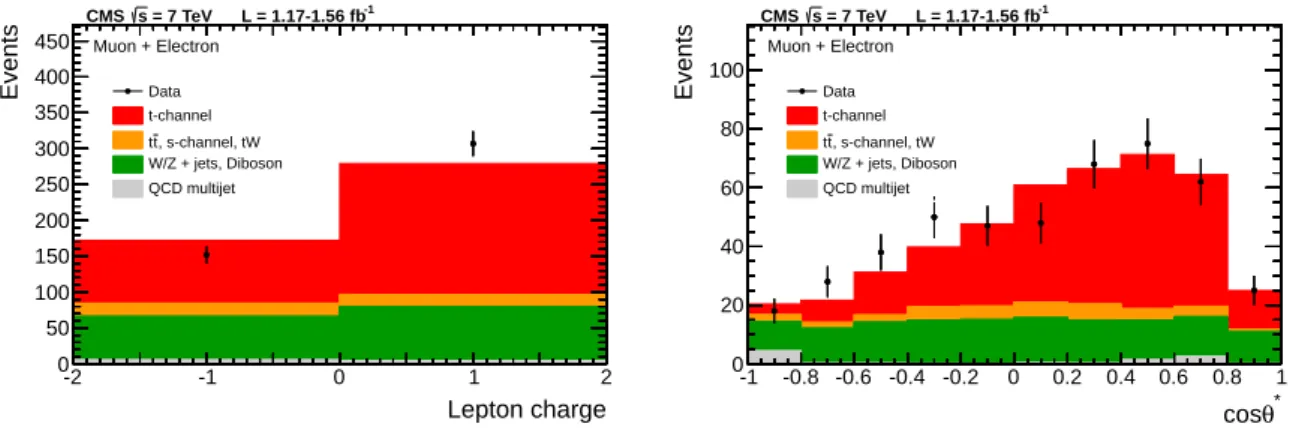
Single-top-quark t-channel production at the LHC is expected to be characterised by two fea-tures. First, the top-quark cross section is about a factor two larger than the top-anti-quark cross section [7]. This can be experimentally accessed via the charge of the muon or electron. Second, top quarks are almost 100% polarised with respect to a certain spin axis due to the V–A nature of the couplings. This can be studied via the cos θ∗distribution [25], where θ∗is defined as the angle between the charged lepton and the non-b-tagged jet, in the reconstructed top-quark rest
8 7 Neural Network Analysis ) 2 (GeV/c b ν l m 100 120 140 160 180 200 220 240 260 280 300 Events 0 10 20 30 40 50 60 70 Data t-channel , s-channel, tW t t W/Z + jets, Diboson QCD multijet Muon -1 = 7 TeV L = 1.17 fb s CMS ) 2 (GeV/c b ν l m 100 120 140 160 180 200 220 240 260 280 300 Events 0 10 20 30 40 50 Data t-channel , s-channel, tW t t W/Z + jets, Diboson QCD multijet Electron -1 = 7 TeV L = 1.56 fb s CMS
Figure 3: Distributions of m`νbrequiring|ηj0| >2.8, for muons (left) and electrons (right),
ob-tained by normalising each process yield to the value from the fit. Because of limited simulated data, the background distribution is smoothed by using a simple spline curve.
Lepton charge -2 -1 0 1 2 Events 0 50 100 150 200 250 300 350 400 450 Data t-channel , s-channel, tW t t W/Z + jets, Diboson QCD multijet Muon + Electron -1 = 7 TeV L = 1.17-1.56 fb s CMS * θ cos -1 -0.8 -0.6 -0.4 -0.2 0 0.2 0.4 0.6 0.8 1 Events 0 20 40 60 80 100 Data t-channel , s-channel, tW t t W/Z + jets, Diboson QCD multijet Muon + Electron -1 = 7 TeV L = 1.17-1.56 fb s CMS
Figure 4: Distinct single-top-quark t-channel features in the SR for|ηj0| >2.8, for the electron and muon final states combined. The charge of the lepton (left) and cos θ∗(right). All processes are normalised to the fit results. Because of limited simulated data, the background distribution is smoothed by using a simple spline curve (right).
frame. The observed charge asymmetry and the cos θ∗ distribution are presented in Fig. 4 for muon plus electron events in the SR, for|ηj0| >2.8.
7
Neural Network Analysis
In the NN analysis, several kinematic variables, which are characteristic of SM single-top-quark production, are combined into a single discriminant by applying an NN technique. The NEU -ROBAYESpackage [26, 27] used for this NN analysis combines a three-layer feed-forward NN with a complex, but robust, preprocessing. To reduce the influence of long tails in distributions, input variables are transformed to be Gaussian distributed. In addition, a diagonalisation and rotation transformation is performed such that the covariance matrix of the transformed vari-ables becomes a unit matrix. To obtain good performance and to avoid overtraining, the NN uses Bayesian regularisation techniques for the training process. The network input layer con-sists of one input node for each input variable plus one bias node. The hidden layer is adapted to this particular analysis and consists of one more node than the input layer. The output node gives a continuous discriminator output in the interval [−1, 1]. For the training of the NN,
after applying the full event selection as described in Section 4, simulated samples of signal t-channel single-top-quark events and background events from tt, W+jets, and Z+jets samples are used. The ratio of signal to background events in the training is chosen to be 50:50 and the background processes are weighted according to the SM prediction, as outlined in Section 5. The NN is trained such that t-channel single-top-quark events tend to have discriminator val-ues close to 1, while background events tend to have discriminator valval-ues near−1. Because of their different event selections, separate neural networks are trained for muon and electron events.
During the preprocessing, the training variables are ranked by the significance of their correla-tion to the target discriminator output. The correlacorrela-tion matrix of all training variables and the target value is calculated. The variable with the smallest correlation to the target is removed and the loss of correlation is calculated. This is repeated until the correlation of all variables with the target is determined. The significance of a variable is calculated by dividing the loss of correlation with the target by the square root of the sample size. In order to select variables which contain information that is not already incorporated by other variables, a selection cri-terion of≥3 σ on the significance has been chosen. A set of 37 variables remains for the muon channel when applying this selection criterion. For the electron channel, a set of 38 variables remains. The validity of the description of these input variables and the output of the NN dis-criminant is confirmed in data with negligible signal contribution. Furthermore, it is verified with a bootstrapping technique [28] that the bias of the cross section measurement due to a possible overtraining of the NN is negligible.
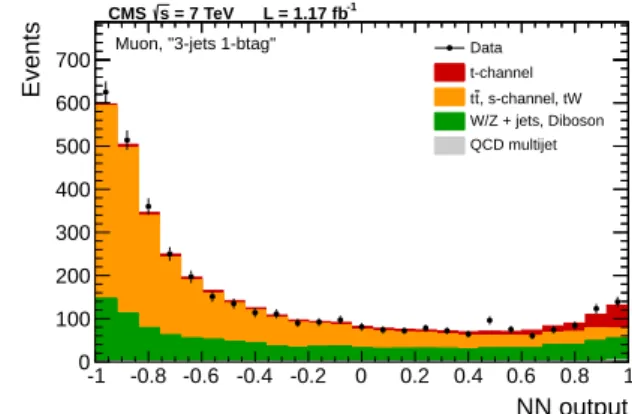
NN output -1 -0.8 -0.6 -0.4 -0.2 0 0.2 0.4 0.6 0.8 1 Events 0 100 200 300 400 500 600 -1 = 7 TeV L = 1.17 fb s CMS Data t-channel , s-channel, tW t t W/Z + jets, Diboson QCD multijet Muon, "2-jets 1-btag"
NN output -1 -0.8 -0.6 -0.4 -0.2 0 0.2 0.4 0.6 0.8 1 Events 0 100 200 300 400 500 600 700 -1 = 7 TeV L = 1.17 fb s CMS Data t-channel , s-channel, tW t t W/Z + jets, Diboson QCD multijet Muon, "3-jets 1-btag"
Figure 5: Distributions of the NN discriminator output in the muon channel for the “2-jets 1-btag” (left) and “3-jets 1-btag” (right) categories. Simulated signal and background contribu-tions are scaled to the best fit results.
The variables with the highest ranking in both networks are|ηj0|, mT, the invariant mass of the two leading jets, and the total transverse energy of the event.
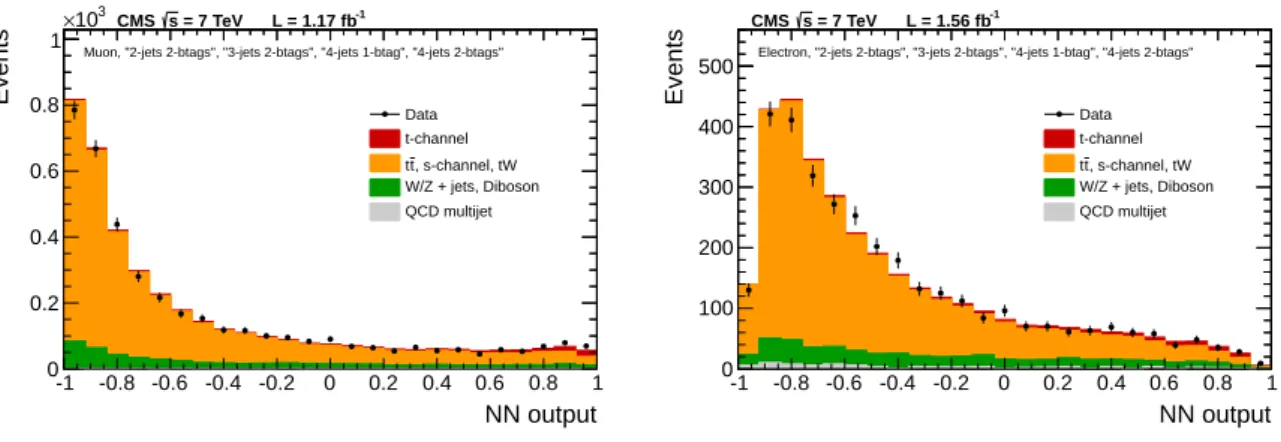
The distributions of the NN discriminator in the “2-jets 1-btag” and “3-jets 1-btag” signal cate-gories are shown in Fig. 5 for the muon channel and in Fig. 6 for the electron channel. For the remaining categories “2-jets 2-btags”, “3-jets 2-btags”, “4-jets 1-btag”, and “4-jets 2-btags”, the events are combined into one plot in Fig. 7 for the muon channel on the left and for the electron channel on the right.
8
Boosted Decision Trees Method
The BDT method was previously used in the first CMS measurement of the t-channel cross section [4]. The current analysis uses a significantly larger data sample. It has been optimised
10 8 Boosted Decision Trees Method NN output -1 -0.8 -0.6 -0.4 -0.2 0 0.2 0.4 0.6 0.8 1 Events 0 20 40 60 80 100 120 140 160 180 200 -1 = 7 TeV L = 1.56 fb s CMS Data t-channel , s-channel, tW t t W/Z + jets, Diboson QCD multijet Electron, "2-jets 1-btag"
NN output -1 -0.8 -0.6 -0.4 -0.2 0 0.2 0.4 0.6 0.8 1 Events 0 50 100 150 200 250 300 350 -1 = 7 TeV L = 1.56 fb s CMS Data t-channel , s-channel, tW t t W/Z + jets, Diboson QCD multijet Electron, "3-jets 1-btag"
Figure 6: Distributions of the NN discriminator output in the electron channel for the “2-jets 1-btag” (left) and “3-jets 1-btag” (right) categories. Simulated signal and background contribu-tions are scaled to the best fit results.
NN output -1 -0.8 -0.6 -0.4 -0.2 0 0.2 0.4 0.6 0.8 1 Events 0 0.2 0.4 0.6 0.8 1 3 10 × -1 = 7 TeV L = 1.17 fb s CMS Data t-channel , s-channel, tW t t W/Z + jets, Diboson QCD multijet
Muon, "2-jets 2-btags", "3-jets 2-btags", "4-jets 1-btag", "4-jets 2-btags"
NN output -1 -0.8 -0.6 -0.4 -0.2 0 0.2 0.4 0.6 0.8 1 Events 0 100 200 300 400 500 -1 = 7 TeV L = 1.56 fb s CMS Data t-channel , s-channel, tW t t W/Z + jets, Diboson QCD multijet
Electron, "2-jets 2-btags", "3-jets 2-btags", "4-jets 1-btag", "4-jets 2-btags"
Figure 7: Distributions of the NN discriminator output in the background dominated region. All events from the signal depleted categories “2-jets 2-btags”, “3-jets 2-btags”, “4-jets 1-btag”, and “4-jets 2-btags” are combined for the muon channel (left) and the electron channel (right). Simulated signal and background contributions are scaled to the best fit results.
using a “blind” analysis with the optimisation based exclusively on regions where the signal contribution is negligible and all the selections frozen before the signal region has been looked at. It further provides an increase of the measurement sensitivity and a reduction of systematic uncertainties. The BDT analysis was designed following Ref. [29].
The adopted BDT algorithm constructs 400 decision trees using the Adaptive Boosting algo-rithm as implemented in Ref. [30]. The BDT training is carried out separately for the electron and muon final states, for each of the single-top-quark “2-jets 1-btag” and “3-jets 1-btag” signal-enriched regions, to provide a total of four BDTs. The background processes are input to the training according to their theoretical cross section predictions as outlined in Section 5. One third of the simulated signal and background samples are used for the training, one third are used to verify the performance of the trained BDT, while the remaining simulated data provide an unbiased sample used for the cross section evaluation.
Eleven observables reconstructed in the detector are chosen based on their power to discrimi-nate between signal and background events.
The adopted variables are the lepton transverse momentum; the pseudorapidities of the most forward non-b-tagged jet and of the jet with the highest transverse momentum; the invariant mass of all reconstructed jets in the event; the angular separation between the two leading jets; the sums of the hadronic energy and of the hadronic transverse energy; the reconstructed top-quark mass using the jet with the highest b-tag discriminator; the reconstructed top-quark mass using the jet giving the reconstructed top-quark mass closest to 172 GeV/c2; the cosine of the angle between the reconstructed W boson, in the rest frame of the sum of four-vectors of the W boson and leading jet, and the sum of four-vectors of the W boson and leading jet; and the sphericity of the event. The validity of the description of these input variables and the output of the BDT classifiers is confirmed in data with negligible signal contribution using a Kolmogorov–Smirnov test.
The QCD multijet background evaluation is described in Section 5. The determination of the single-top-quark production cross section in the t-channel, including the treatment of statistical and systematic uncertainties, is performed by using the classifier distributions in all 12 analysis categories simultaneously.
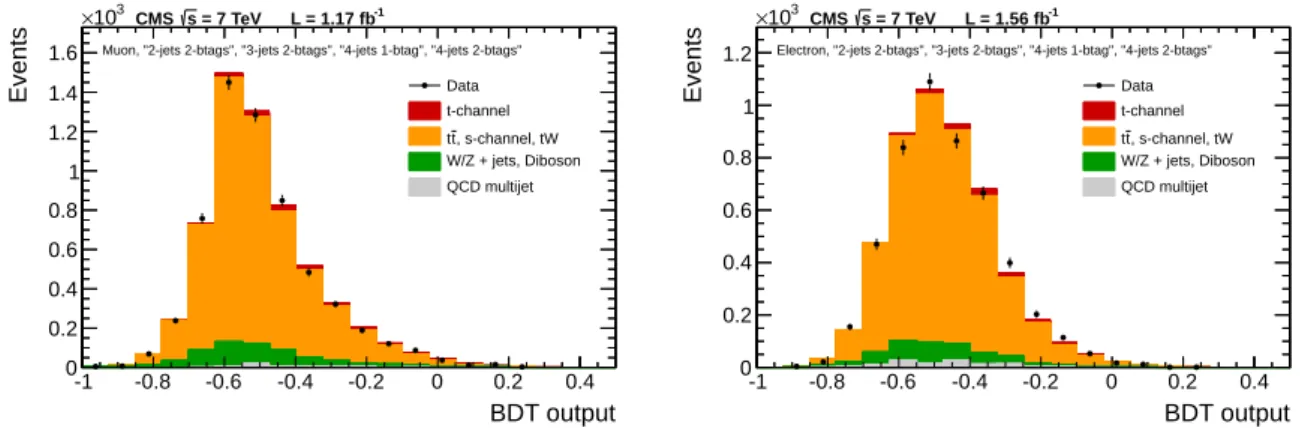
The measured distributions of the classifier outputs in the ”2-jets 1-btag” and ”3-jets 1-btag” signal enriched categories are shown separately for the muon and electron channel in Figs. 8 and 9. The measured distributions of the classifier outputs in the ”jets btags”,”3-jets 2-btags”, ”4-jets 1-btag”, and ”4-jets 2-btags” signal depleted categories are shown separately for the muon and electron channels in Fig. 10.
9
Determination of the Cross Section with Multivariate Analyses
The NN and BDT analyses employ a Bayesian approach [31] to measure the single-top-quark production cross section. The signal cross section is determined simultaneously from the data distributions of the corresponding multivariate discriminator, modelled as 1-dimensional his-tograms, in the different categories. The distributions for signal and backgrounds are taken from simulation, except for the QCD multijet distribution, which is derived from data. The signal yield is measured in terms of the signal strength µ which is defined as the actual cross section divided by the SM prediction. The probability to observe a certain dataset p(data|µ)is related to the posterior distribution p(µ|data)of µ by using Bayes’ theorem
12 9 Determination of the Cross Section with Multivariate Analyses BDT output -1 -0.8 -0.6 -0.4 -0.2 0 0.2 0.4 Events 0 100 200 300 400 500 Data t-channel , s-channel, tW t t W/Z + jets, Diboson QCD multijet -1 = 7 TeV L = 1.17 fb s CMS
Muon, "2-jets 1-btag"
BDT output -1 -0.8 -0.6 -0.4 -0.2 0 0.2 0.4 Events 0 100 200 300 400 500 600 Data t-channel , s-channel, tW t t W/Z + jets, Diboson QCD multijet -1 = 7 TeV L = 1.17 fb s CMS
Muon, "3-jets 1-btag"
Figure 8: Distributions of the BDT discriminator output in the muon channel for the “2-jets 1-btag” (left) and “3-jets 1-btag” (right) categories. Simulated signal and background contribu-tions are scaled to the best fit results.
BDT output -1 -0.8 -0.6 -0.4 -0.2 0 0.2 0.4 Events 0 50 100 150 200 250 300 Data t-channel , s-channel, tW t t W/Z + jets, Diboson QCD multijet -1 = 7 TeV L = 1.56 fb s CMS
Electron, "2-jets 1-btag"
BDT output -1 -0.8 -0.6 -0.4 -0.2 0 0.2 0.4 Events 0 50 100 150 200 250 300 350 400 Data t-channel , s-channel, tW t t W/Z + jets, Diboson QCD multijet -1 = 7 TeV L = 1.56 fb s CMS
Electron, "3-jets 1-btag"
Figure 9: Distributions of the BDT discriminator output in the electron channel for the “2-jets 1-btag” (left) and “3-jets 1-btag” (right) categories. Simulated signal and background contribu-tions are scaled to the best fit results.
BDT output -1 -0.8 -0.6 -0.4 -0.2 0 0.2 0.4 Events 0 0.2 0.4 0.6 0.8 1 1.2 1.4 1.6 3 10 × Data t-channel , s-channel, tW t t W/Z + jets, Diboson QCD multijet -1 = 7 TeV L = 1.17 fb s CMS
Muon, "2-jets 2-btags", "3-jets 2-btags", "4-jets 1-btag", "4-jets 2-btags"
BDT output -1 -0.8 -0.6 -0.4 -0.2 0 0.2 0.4 Events 0 0.2 0.4 0.6 0.8 1 1.2 3 10 × Data t-channel , s-channel, tW t t W/Z + jets, Diboson QCD multijet -1 = 7 TeV L = 1.56 fb s CMS
Electron, "2-jets 2-btags", "3-jets 2-btags", "4-jets 1-btag", "4-jets 2-btags"
Figure 10: Distributions of the BDT discriminator output in the signal depleted categories for the muon channel (left) and electron channel (right). Simulated signal and background contri-butions are scaled to the best fit results.
where π(µ)denotes a uniform prior distribution of the signal strength.
Experimental uncertainties and cross-section uncertainties are included by introducing addi-tional parameters~θ in the statistical model, extending the probability to observe a certain dataset to p0(data|µ,~θ), which depends on the nuisance parameters~θ. This approach allows the nuisance parameter values to be constrained by data, thus reducing the respective uncer-tainties.
The m systematic uncertainties are included via nuisance parameters~θ = (θ1,· · · , θm), which
contain k normalisation parameters and m−k parameters influencing the shape of the sim-ulated distributions. For normalisation uncertainties i = 1,· · · , k, the priors πi(θi) are
log-normal distributions. The medians are set to the corresponding cross sections and the widths to their uncertainties. The priors for shape uncertainties are normal distributions. For each shape uncertainty, two shifted simulated discriminator distributions are derived, varying the corresponding uncertainty by±1σ. Here, the parameter θi is used to interpolate between the
nominal and shifted histograms.
The posterior distribution for the signal strength µ, p(µ|data), is obtained by integrating the
(m+1)-dimensional posterior in all nuisance parameters~θ: p(µ|data)∝
Z
p0(data|µ,~θ) ·π(µ)π(~θ)d~θ.
This integration, also called marginalisation, is performed using the Markov chain MC method as implemented in the package THETA[32]. The central value is extracted from this distribution and used as µ. The central 68% quantile is taken as the total marginalised uncertainty in the measurement. It includes the statistical uncertainty and the m systematic uncertainties.
An estimate of the statistical uncertainty is taken from the total marginalised uncertainty after subtracting, in quadrature, the individual contributions of marginalised uncertainties. To ob-tain the individual contribution of each systematic uncerob-tainty, the signal extraction procedure is repeated with signal and background contributions changed according to the systematic un-certainty. The mean shift of the cross section estimate, with respect to the value obtained in the nominal scenario, is taken as the corresponding impact on the signal cross section measure-ment.
However, modelling the systematic uncertainties as nuisance parameters requires an assump-tion for the dependence of p0on θi. This dependence is often unknown for theoretical
uncertain-ties, in particular if they have an effect on the shape of the discriminator distribution. Therefore, such uncertainties are not included via additional nuisance parameters. Instead, their effect on the cross section measurement is estimated by performing pseudo-experiments as explained above, and their impact is added in quadrature to the total marginalised uncertainty.
In conclusion, systematic uncertainties are included with two different methods. Experimental uncertainties and cross-section uncertainties are included as additional parameters in the statis-tical model and marginalised. Theorestatis-tical uncertainties are not included as additional param-eters in the statistical model, but their impact is added in quadrature to the total marginalised uncertainty.
10
Systematic Uncertainties and Measurement Sensitivity
For the|ηj0|analysis, each systematic uncertainty is evaluated by generating pseudo-experiments, which take into account the effect of the corresponding systematic source on the distribution
14 10 Systematic Uncertainties and Measurement Sensitivity
of|ηj0|and on the event yield of the physics processes. Pseudo-experiments are generated sep-arately with templates varied by ±1 σ of the corresponding uncertainty. A fit to |ηj0| is then performed on each pseudo-experiment. The mean shift of the fit results, with respect to the value obtained in the nominal scenario, is taken as the corresponding uncertainty.
In the BDT and NN analyses the experimental systematic uncertainties (excluding the lumi-nosity) are marginalised with the Bayesian method. Theoretical uncertainties, however, are not marginalised, but are estimated by generating pseudo-experiments using separate templates, varied by ±1 σ for the corresponding uncertainty, for each source of systematic uncertainties, and repeating the signal extraction procedure.
A particular uncertainty, which is only present for the|ηj0|analysis, concerns the extraction of W+jets from data. It is evaluated by generating pseudo-experiments in the SB and repeating the signal extraction procedure and fit to|ηj0|. This method exploits the ansatz that the distribution of|ηj0|is the same in both the SR and SB. The uncertainty is taken as the root mean square of the distribution of fit results obtained in this way. This uncertainty depends on the amount of available data in the SB and is uncorrelated between the muons and electron samples. In addition, alternative|ηj0|shapes are derived in the simulation by varying the Wb+X and Wc+X fractions of the background by factors of±30% independently in the SR and SB regions. The fit procedure is repeated using the new shapes and the maximum difference in the result with respect to the central value is added in quadrature to the other uncertainties.
The following sources of systematic uncertainties are considered in all three analyses. Differ-ences in the|ηj0|and the two multivariate analyses are remarked upon where relevant:
• Jet energy scale (JES). All reconstructed jet four-momenta in simulated events are simultaneously varied according to the η and pT-dependent uncertainties on the
jet energy scale [33]. This variation in jet four-momenta is also propagated to E/T.
For multivariate analyses, the complete parameterisation of JES as in [33] is consid-ered and all parameters are considconsid-ered as nuisance parameters and included in the marginalisation procedure described in Section 9.
• Jet energy resolution. A smearing is applied to account for the known difference in jet energy resolution with respect to data [34], increasing or decreasing the extra resolution contribution by the uncertainty on the resolution.
• b tagging. Both b tagging and misidentification efficiencies in the data are estimated from control samples [20]. Scale factors are applied to simulated samples to repro-duce the measured efficiencies. The corresponding uncertainties are propagated as systematic uncertainties. For multivariate analyses, b tagging average scale factors are constrained using the marginalisation procedure described in Section 9. The effect of any remaining, unconstrained, b tagging modelling is determined by mod-elling possible variations of the b tagging scale factors as a function of pT and|η|, using different degrees (from one to five) of Chebyshev polynomials. The largest observed variation with respect to the nominal result is taken as the systematic un-certainty, and is found to be negligible.
• Trigger. Single lepton trigger efficiencies are estimated with a “tag and probe” method [35] from Drell–Yan data. The efficiencies of triggers requiring a lepton plus a b-tagged jet are parameterised as a function of the jet pTand the value of the TCHP
b-tag discriminator. The selection efficiencies have been validated using a reference trigger. The uncertainties of the parameterisation and an additional flavour depen-dency is propagated to the final result.
• Pileup. The effect of multiple interactions (pileup) is evaluated by reweighting sim-ulated samples to reproduce the expected number of pileup interactions in data, properly taking into account in-time and out-of-time pileup contributions. The un-certainty on the expected number of pileup interactions (5%) is propagated as a sys-tematic uncertainty to this measurement.
• Missing transverse energy. The E/Tmodelling uncertainty is propagated to the cross
section measurement. The effect on E/Tmeasurement of unclustered energy deposits
in the calorimeters is included.
• Luminosity. The luminosity is known with a relative uncertainty of±2.2% [36].
• Background normalisation. The uncertainties on the normalisation of each back-ground source are listed below. They are propagated as systematic uncertainties in the |ηj0|analysis only for dibosons and s- and tW-channel single-top-quark pro-cesses. The remaining backgrounds are estimated from data. The uncertainty on tt is used as a Gaussian constraint in the signal-extraction fit. In the multivariate anal-yses, normalisation uncertainties are accounted for as a prior probability density function for the Bayesian inference using a log-normal model.
• tt:±15%, based on the statistical uncertainties in Ref. [37].
• Dibosons, single-top-quark s- and tW-channels: ±30%,±15%,±13%, re-spectively, based on theoretical uncertainties.
• W/Z+jets: ±100%, ±50%, and ±30% are taken for W+b/c flavour jets, W+light flavour jets, and Z+jets, respectively, consistent with previous estimates [37]. In the multivariate analyses, the various W+jets processes are considered to be uncorrelated, as are the different jet categories, in order to avoid too many model assumptions.
• QCD multijet: the normalisation and the corresponding uncertainty is determined from data (see Section 5).
• Limited MC data. The uncertainty due to the limited amount of MC data in the tem-plates used for the statistical inferences is determined by using the Barlow–Beeston method [38, 39].
• Scale uncertainty. The uncertainties on the renormalisation and factorisation scales are studied with dedicated single-top-quark and background samples of W+jets, Z+jets, and tt events. They are generated by doubling or halving the renormalisation and factorisation scale with respect to the nominal value equal to the Q2in the hard-scattering process.
• Extra parton modelling (matching). The uncertainty due to extra hard parton ra-diation is studied by doubling or halving the threshold for the MLM jet matching scheme [40] for W+jets, Z+jets, and tt from its default.
• Signal generator. The results obtained by using the nominal POWHEG signal sam-ples are compared with the result obtained using signal samsam-ples generated by COMPHEP. In general, the largest model deviations occur in the kinematic distri-butions of the spectator b quark [41]. The differences in the transverse momentum distribution of the spectator b quark, at the generator level, between 4-flavour and 5-flavour scheme (FS) POWHEG [42] are more than a factor two smaller than the differences betweenPOWHEG-5FSand COMPHEP over the whole pTrange.
Pseudo-experiments with simulated COMPHEP events are generated and the nominal signal extraction procedure withPOWHEG-5FStemplates is repeated. Half of the observed shift of the cross section measurement is taken as the systematic uncertainty due to
16 10 Systematic Uncertainties and Measurement Sensitivity
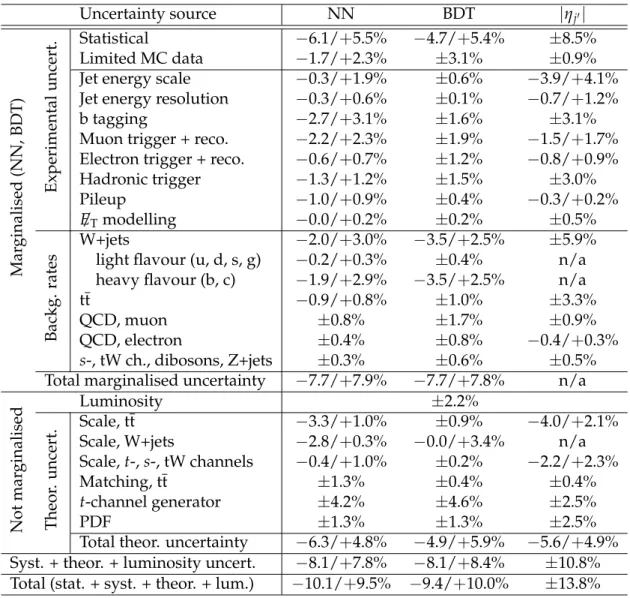
Table 2: Sources of uncertainty on the cross section measurement.
Uncertainty source NN BDT |ηj0| Mar ginalised (NN, BDT) Experimental uncert. Statistical −6.1/+5.5% −4.7/+5.4% ±8.5% Limited MC data −1.7/+2.3% ±3.1% ±0.9%
Jet energy scale −0.3/+1.9% ±0.6% −3.9/+4.1% Jet energy resolution −0.3/+0.6% ±0.1% −0.7/+1.2%
b tagging −2.7/+3.1% ±1.6% ±3.1%
Muon trigger + reco. −2.2/+2.3% ±1.9% −1.5/+1.7% Electron trigger + reco. −0.6/+0.7% ±1.2% −0.8/+0.9% Hadronic trigger −1.3/+1.2% ±1.5% ±3.0% Pileup −1.0/+0.9% ±0.4% −0.3/+0.2% E/Tmodelling −0.0/+0.2% ±0.2% ±0.5% Backg. rates W+jets −2.0/+3.0% −3.5/+2.5% ±5.9%
light flavour (u, d, s, g) −0.2/+0.3% ±0.4% n/a heavy flavour (b, c) −1.9/+2.9% −3.5/+2.5% n/a
tt −0.9/+0.8% ±1.0% ±3.3%
QCD, muon ±0.8% ±1.7% ±0.9%
QCD, electron ±0.4% ±0.8% −0.4/+0.3%
s-, tW ch., dibosons, Z+jets ±0.3% ±0.6% ±0.5% Total marginalised uncertainty −7.7/+7.9% −7.7/+7.8% n/a
Not mar ginalised Luminosity ±2.2% Theor . uncert. Scale, tt −3.3/+1.0% ±0.9% −4.0/+2.1%
Scale, W+jets −2.8/+0.3% −0.0/+3.4% n/a Scale, t-, s-, tW channels −0.4/+1.0% ±0.2% −2.2/+2.3%
Matching, tt ±1.3% ±0.4% ±0.4%
t-channel generator ±4.2% ±4.6% ±2.5%
PDF ±1.3% ±1.3% ±2.5%
Total theor. uncertainty −6.3/+4.8% −4.9/+5.9% −5.6/+4.9% Syst. + theor. + luminosity uncert. −8.1/+7.8% −8.1/+8.4% ±10.8% Total (stat. + syst. + theor. + lum.) −10.1/+9.5% −9.4/+10.0% ±13.8%
signal generator modelling.
• Parton distribution functions. The uncertainty due to the choice of the parton dis-tribution functions (PDF) is estimated using pseudo-experiments, reweighting the simulated events with each of the 40 eigenvectors of the CTEQ6 [18] PDF set and the central set of CTEQ10 [43], and repeating the nominal signal extraction procedure. For reweighting the simulated events, theLHAPDF[44] package is used.
The jet energy scale and jet energy resolution are fully correlated across all samples. The match-ing and scale uncertainties are fully correlated between W+jets and Z+jets, but are uncorrelated with tt.
Table 2 summarises the different contributions to the systematic uncertainty on the combined (muon and electron) cross section measurement in the three analyses. For the multivariate anal-yses, experimental uncertainties and background rates are constrained from the marginalisa-tion procedure (except for the luminosity), as described in Secmarginalisa-tion 9. The remaining theoretical and luminosity uncertainties are added separately in quadrature to the total uncertainty.
11
Results
11.1 Individual analyses
The |ηj0|analysis yields the following cross section measurements for the muon and electron channels:
σt-ch. =73.3±10.4 (stat. + syst. + lum.) ±4.0 (theor.) pb (muons),
σt-ch. =61.6±13.9 (stat. + syst. + lum.) ±3.5 (theor.) pb (electrons).
The two measurements are compatible, taking into account correlated and uncorrelated un-certainties. The uncorrelated uncertainties include the W+jets and QCD extraction procedure, lepton reconstruction and trigger efficiencies, and the hadronic part of the trigger.
Combining the muon and electron measurements gives
σt-ch. =70.0±6.0 (stat.)±6.5 (syst.)±3.6 (theor.)±1.5 (lum.) pb.
The Bayesian inference is performed with the data samples and the 50% quantile is calculated as the best parameter estimate for the signal strength µ. The 84% and 16% quantiles are quoted as upper and lower boundaries for the 1σ credible interval.
The measured single-top-quark t-channel production cross section in the NN analysis is
σt-ch. =69.7+−7.27.0(stat. + syst. + lum.)±3.6 (theor.) pb (muons),
σt-ch. =65.1+−9.28.9(stat. + syst. + lum.)±3.5 (theor.) pb (electrons).
The quoted errors are the total uncertainties including marginalised, unmarginalised, and lu-minosity uncertainties. The two measurements are compatible within the uncertainties, after properly taking into account the correlated contributions. The combination of the muon and electron measurements gives
σt-ch. =68.1±4.1 (stat.)±3.4 (syst.)+−3.34.3(theor.)±1.5 (lum.) pb.
The measured single-top-quark t-channel production cross section in the BDT analysis is
σt-ch.=66.6+−7.06.6(stat. + syst. + lum.)+−6.43.5(theor.) pb (muons),
σt-ch.=66.4+−8.47.9(stat. + syst. + lum.)+−5.45.4(theor.) pb (electrons),
and their combination gives
σt-ch. =66.6±4.0 (stat.)±3.3 (syst.)+−3.93.3(theor.)±1.5 (lum.) pb.
18 11 Results
11.2 Combination
The results of the three analyses are combined using the BLUE method.The statistical cor-relation between each pair of measurements is estimated by generating dedicated pseudo-experiments. The correlation is 60% between NN and |ηj0|, 69% between BDT and|ηj0|, and 74% between NN and BDT. Correlations for the jet energy scale and resolution, b tagging, and E/Tmodelling between|ηj0|and the two multivariate analyses are expected to be small. This is because the determination of the corresponding nuisance parameters, from the marginalisation adopted in the BDT and NN analyses, is dominated by in-situ constraints from data samples independent of those used to determine uncertainties in the|ηj0|analysis. The assumed corre-lation for those uncertainties is taken to be 20%. The correcorre-lation has, nevertheless, been varied from 0% to 50%, with a corresponding variation of the central value by−0.03 pb, and no appre-ciable variation has been observed for the combined uncertainty. For trigger uncertainties, the correlation between|ηj0|and the two multivariate analyses is more difficult to ascertain. Vary-ing the correlations in the combination from 0% to 100% results in a variation of the central value of 0.03 pb, with no appreciable variation of the combined uncertainty. All other uncer-tainties are determined mostly from the same data samples used by the two analyses, hence 100% correlation is assumed.
The BLUE method is applied iteratively, as previously carried out in Ref. [4]. In each iteration, the absolute uncertainty is calculated by scaling the relative uncertainties given in Table 2 with the combined value from the previous iteration. This is repeated until the combined value remains constant. There are no appreciable changes with respect to the non-iterative BLUE method. The 0.03 pb variation in the central value, due to changes in correlation coefficients, is added in quadrature to the total uncertainty. However, this results in a negligible additional contribution.
The χ2 obtained by the BLUE combination of the three analyses is 0.19, corresponding to a p-value of 0.90. The results of the individual analyses are consistent with each other.
The combined result of the measured single-top-quark t-channel production cross section at
√
s=7 TeV is
σt-ch. =67.2±6.1 pb=67.2±3.7 (stat.)±3.0 (syst.)±3.5 (theor.)±1.5 (lum.) pb
for an assumed top-quark mass of 172.5 GeV/c2. 11.3
|
Vtb|
ExtractionThe absolute value of the CKM element|Vtb|is determined in a similar fashion to Ref. [4], as-suming that|Vtd|and |Vts|are much smaller than |Vtb|, as |Vtb| =
q
σt-ch./σt-ch.th , where σt-ch.th is the SM prediction calculated assuming |Vtb| = 1 [7]. If we take into account the possible presence of an anomalous Wtb coupling, this relation modifies taking into account an anoma-lous form factor fLV [45–47], which is not necessarily equal to 1 in beyond-the-SM models. We
determine |fLVVtb| = s σt-ch. σt-ch.th =1.020±0.046 (meas.)±0.017 (theor.) ,
where the first uncertainty term contains all uncertainties of the cross section measurement including theoretical ones, and the second is the uncertainty on the SM theoretical prediction. From this result, the confidence interval for|Vtb|, assuming the constraint|Vtb| ≤1 and fLV =1,
is determined using the unified approach of Feldman and Cousins [48] to be
12
Conclusions
The cross section of t-channel single-top-quark production has been measured in pp collisions using 2011 data in semileptonic top-quark decay modes with improved precision compared to the previous CMS measurement. Two approaches have been adopted. One approach has been based on a fit of the characteristic pseudorapidity distribution of the light quark recoiling against the single top quark in the t-channel with background determination from data. The other has been based on two multivariate discriminators, a Neural Network and Boosted De-cision Trees. The multivariate analyses reduce the impact of systematic uncertainties by simul-taneously analysing phase space regions with substantial t-channel single-top-quark contribu-tions, and regions where they are negligible. The results are all consistent within uncertainties. As a consequence, all three analyses have been combined with the Best Linear Unbiased Esti-mator method to obtain the final result.
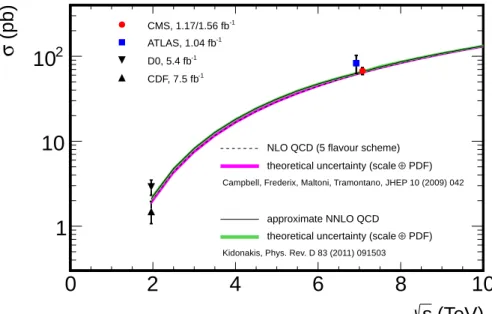
The combined measurement of the single-top-quark t-channel cross section is 67.2±6.1 pb. This is the first measurement with a relative uncertainty below 10%. It is in agreement with the approximate NNLO standard model prediction of 64.6+−2.10.7+−1.51.7pb [7]. Figure 11 compares this measurement with dedicated t-channel cross section measurements at the Tevatron [49, 50], ATLAS [5], and with the QCD expectations computed at NLO with MCFM in the 5-flavour scheme [51] and at approximate NNLO [7]. The absolute value of the CKM matrix element Vtb
is measured to be|fLVVtb| =
q
σt-ch./σt-ch.th = 1.020±0.046 (meas.)±0.017 (theor.). Assuming
fLV =1 and|Vtb| ≤1, we measure the 95% confidence level interval 0.92< |Vtb| ≤1.
(TeV)
s
0
2
4
6
8
10
(pb)
σ
1
10
210
-1 CMS, 1.17/1.56 fb -1 ATLAS, 1.04 fb -1 D0, 5.4 fb -1 CDF, 7.5 fbNLO QCD (5 flavour scheme) PDF)
⊕
theoretical uncertainty (scale
Campbell, Frederix, Maltoni, Tramontano, JHEP 10 (2009) 042
approximate NNLO QCD
PDF)
⊕
theoretical uncertainty (scale
Kidonakis, Phys. Rev. D 83 (2011) 091503
Figure 11: The single-top-quark cross section in the t-channel vs. centre-of-mass energy. The error band (width of the curve) of the SM calculation is obtained by varying the top-quark mass within its current uncertainty [3], estimating the PDF uncertainty according toHEPDATA recommendations [52], and varying the factorisation and renormalisation scales coherently by a factor of two up and down. The central values of the two SM predictions differ by 2.2% at
√
20 References
Acknowledgements
We congratulate our colleagues in the CERN accelerator departments for the excellent per-formance of the LHC machine. We thank the technical and administrative staff at CERN and other CMS institutes, and acknowledge support from BMWF and FWF (Austria); FNRS and FWO (Belgium); CNPq, CAPES, FAPERJ, and FAPESP (Brazil); MES (Bulgaria); CERN; CAS, MoST, and NSFC (China); COLCIENCIAS (Colombia); MSES (Croatia); RPF (Cyprus); MEYS (Czech Republic); MoER, SF0690030s09 and ERDF (Estonia); Academy of Finland, MEC, and HIP (Finland); CEA and CNRS/IN2P3 (France); BMBF, DFG, and HGF (Germany); GSRT (Greece); OTKA and NKTH (Hungary); DAE and DST (India); IPM (Iran); SFI (Ireland); INFN (Italy); NRF and WCU (Korea); LAS (Lithuania); CINVESTAV, CONACYT, SEP, and UASLP-FAI (Mexico); MSI (New Zealand); PAEC (Pakistan); MSHE and NSC (Poland); FCT (Portugal); JINR (Armenia, Belarus, Georgia, Ukraine, Uzbekistan); MON, RosAtom, RAS and RFBR (Rus-sia); MSTD (Serbia); SEIDI and CPAN (Spain); Swiss Funding Agencies (Switzerland); NSC (Taipei); TUBITAK and TAEK (Turkey); NASU (Ukraine); STFC (United Kingdom); DOE and NSF (USA).
Individuals have received support from the Marie-Curie programme and the European Re-search Council (European Union); the Leventis Foundation; the A. P. Sloan Foundation; the Alexander von Humboldt Foundation; the Austrian Science Fund (FWF); the Belgian Federal Science Policy Office; the Fonds pour la Formation `a la Recherche dans l’Industrie et dans l’Agriculture (FRIA-Belgium); the Agentschap voor Innovatie door Wetenschap en Technolo-gie (IWT-Belgium); the Council of Science and Industrial Research, India; the Compagnia di San Paolo (Torino); and the HOMING PLUS programme of Foundation for Polish Science, co-financed from European Union, Regional Development Fund.
References
[1] CDF Collaboration, “Observation of single top quark production and measurement of
|Vtb|with CDF”, Phys. Rev. D 82 (2010) 112005, doi:10.1103/PhysRevD.82.112005,
arXiv:1004.1181.
[2] D0 Collaboration, “Measurements of single top quark production cross sections and|Vtb|
in pp collisions at√s=1.96 TeV”, Phys. Rev. D 84 (2011) 112001, doi:10.1103/PhysRevD.84.112001, arXiv:1108.3091.
[3] CDF and D0 Collaborations, “Combination of CDF and D0 measurements of the single top production cross section”, (2009). arXiv:0908.2171.
[4] CMS Collaboration, “Measurement of the t-channel single top quark production cross section in pp collisions at√s =7 TeV”, Phys. Rev. Lett. 107 (2011) 091802,
doi:10.1103/PhysRevLett.107.091802, arXiv:1106.3052.
[5] ATLAS Collaboration, “Measurement of the t-channel single top-quark production cross section in pp collisions at√s =7 TeV with the ATLAS detector”, Phys. Lett. B 717 (2012) 330, doi:10.1016/j.physletb.2012.09.031, arXiv:1205.3130.
[6] ATLAS Collaboration, “Evidence for the associated production of a W boson and a top quark in ATLAS at√s=7 TeV”, Phys. Lett. B 716 (2012) 142,
[7] N. Kidonakis, “Next-to-next-to-leading-order collinear and soft gluon corrections for t-channel single top quark production”, Phys. Rev. D 83 (2011) 091503,
doi:10.1103/PhysRevD.83.091503, arXiv:1103.2792.
[8] L. Lyons, D. Gibaut, and P. Clifford, “How to combine correlated estimates of a single physical quantity”, Nucl. Instr. and Meth. A 270 (1988) 110,
doi:10.1016/0168-9002(88)90018-6.
[9] CMS Collaboration, “The CMS experiment at the CERN LHC”, JINST 03 (2008) S08004, doi:10.1088/1748-0221/3/08/S08004.
[10] E. Re, “Single-top Wt-channel production matched with parton showers using the POWHEG method”, Eur. Phys. J. C 71 (2011) 1547,
doi:10.1140/epjc/s10052-011-1547-z, arXiv:1009.2450.
[11] S. Alioli et al., “A general framework for implementing NLO calculations in shower Monte Carlo programs: the POWHEG BOX”, JHEP 06 (2010) 043,
doi:10.1007/JHEP06(2010)043, arXiv:1002.2581.
[12] S. Alioli et al., “NLO single-top production matched with shower in POWHEG: s- and t-channel contributions”, JHEP 09 (2009) 111,
doi:10.1088/1126-6708/2009/09/111, arXiv:0907.4076.
[13] S. Frixione, P. Nason, and C. Oleari, “Matching NLO QCD computations with parton shower simulations: the POWHEG method”, JHEP 11 (2007) 070,
doi:10.1088/1126-6708/2007/11/070, arXiv:0709.2092.
[14] T. Sj ¨ostrand, S. Mrenna, and P. Z. Skands, “PYTHIA 6.4 physics and manual”, JHEP 05 (2006) 026, doi:10.1088/1126-6708/2006/05/026, arXiv:hep-ph/0603175. [15] E. E. Boos et al., “CompHEP - computer system for calculation of particle collisions at
high energies ”, Preprint 89-63/140, Moscow State University, Institute for Nuclear Physics, (1989).
[16] J. Alwall et al., “MadGraph 5: going beyond”, JHEP 06 (2011) 128, doi:10.1007/JHEP06(2011)128, arXiv:1106.0522.
[17] J. Alwall et al., “Comparative study of various algorithms for the merging of parton showers and matrix elements in hadronic collisions”, Eur. Phys. J. C 53 (2008) 473, doi:10.1140/epjc/s10052-007-0490-5, arXiv:0706.2569.
[18] J. Pumplin et al., “New generation of parton distributions with uncertainties from global QCD analysis”, JHEP 07 (2002) 012, doi:10.1088/1126-6708/2002/07/012, arXiv:hep-ph/0201195.
[19] S. Agostinelli et al., “Geant4—a simulation toolkit”, Nucl. Instrum. Meth. A 506 (2003) 250, doi:10.1016/S0168-9002(03)01368-8.
[20] CMS Collaboration, “b-Jet Identification in the CMS Experiment”, CMS Physics Analysis Summary CMS-PAS-BTV-11-004, (2011).
[21] CMS Collaboration, “Measurement of the charge asymmetry in top-quark pair production in proton-proton collisions at√s=7 TeV”, Phys. Lett. B 709 (2012) 28, doi:10.1016/j.physletb.2012.01.078, arXiv:1112.5100.
22 References
[22] CMS Collaboration, “Particle–Flow Event Reconstruction in CMS and Performance for Jets, Taus, and E/T”, CMS Physics Analysis Summary CMS-PAS-PFT-09-001, (2009).
[23] M. Cacciari, G. P. Salam, and G. Soyez, “The anti-ktjet clustering algorithm”, JHEP 04
(2008) 063, doi:10.1088/1126-6708/2008/04/063, arXiv:0802.1189. [24] ATLAS Collaboration, “Measurement of the cross section for the production of a W
boson in association with b-jets in pp collisions at√s =7 TeV with the ATLAS detector”, Phys. Lett. B 707 (2012) 418, doi:10.1016/j.physletb.2011.12.046,
arXiv:1109.1470.
[25] P. Motylinski, “Angular correlations in t-channel single top production at the LHC”, Phys. Rev. D 80 (2009) 074015, doi:10.1103/PhysRevD.80.074015,
arXiv:0905.4754.
[26] M. Feindt, “A neural bayesian estimator for conditional probability densities”, (2004). arXiv:physics/0402093.
[27] M. Feindt and U. Kerzel, “The NeuroBayes neural network package”, Nucl. Instrum. Meth. A 559 (2006) 190, doi:10.1016/j.nima.2005.11.166.
[28] B. Efron and R. J. Tibshirani, “An Introduction to the Bootstrap”. Chapman & Hall, New York, 1993.
[29] H.-P. Bretz et al., “A development environment for visual physics analysis”, JINST 07 (2012) T08005, doi:10.1088/1748-0221/7/08/T08005, arXiv:1205.4912. [30] A. Hoecker et al., “TMVA: Toolkit for Multivariate Data Analysis”, (2007).
arXiv:physics/0703039.
[31] E. T. Jaynes, “Probability Theory: The Logic of Science”. Cambridge University Press, Cambridge, 2003.
[32] T. M ¨uller, J. Ott, and J. Wagner-Kuhr, “THETA– a framework for template-based statistical modeling and inference”, Preprint CMS/2012-1, (2012).
[33] CMS Collaboration, “Determination of jet energy calibration and transverse momentum resolution in CMS”, JINST 06 (2011) 11002,
doi:10.1088/1748-0221/6/11/P11002, arXiv:1107.4277.
[34] CMS Collaboration, “Jet Energy Resolution in CMS at√s=7 TeV”, CMS Physics Analysis Summary CMS-PAS-JME-10-014, (2010).
[35] CMS Collaboration, “Measurements of inclusive W and Z cross sections in pp collisions at√s=7 TeV”, JHEP 01 (2011) 080, doi:10.1007/JHEP01(2011)080,
arXiv:1012.2466.
[36] CMS Collaboration, “Absolute Calibration of the Luminosity Measurement at CMS: Winter 2012 Update”, CMS Physics Analysis Summary CMS-PAS-SMP-12-008, (2012). [37] CMS Collaboration, “Measurement of the tt production cross section in pp collisions at 7
TeV in lepton + jets events using b-quark jet identification”, Phys. Rev. D 84 (2011) 092004, doi:10.1103/PhysRevD.84.092004, arXiv:1108.3773.
[38] R. J. Barlow and C. Beeston, “Fitting using finite Monte Carlo samples”, Comput. Phys. Commun. 77 (1993) 219, doi:10.1016/0010-4655(93)90005-W.