The Fair Value of Forestry Assets: Analysis of Precious
Woods and Green Resources
Diogo Macedo
Supervisor:
Paulo Azenhas
Dissertation submitted in partial fulfilment of requirements for the degree of MSc in Business Administration, at the Universidade Católica Portuguesa, September 2012
2
Abstract:
The purpose of this dissertation is to explore the Fair Value concept in the context of biological assets, more precisely forestry assets. In order to evaluate how Fair Value has been employed in the forestry assets field, I first approach the Fair Value in general terms in the Literature Review, and the Fair Value in the specific context of biological assets (IAS 41). Further, I develop an analysis of two standing timber
companies, namely Precious Woods and Green Resources. This analysis encompasses both the methodologies undertaken by each company to value its forestry assets and the impacts on the Financial Statements of changes in fair value of biological assets performed by each company in each year under analysis. Based on the results obtained, both Precious Woods and Green Resources use the Income approach to value its forestry assets and these assets have an overall heavy weight on the financial statements of both companies. Besides, throughout the study one can notice that slight shifts in judgement concerning one or more variables relevant for the DCF model to measure forestry assets can have significant impacts on Financial
Statements. Moreover, one can conclude that there is room for improvement not only in the disclosures but also in the accuracy and reliability of financial information reported in the Annual Reports of Precious Woods and Green Resources.
3
Table of Contents:
Introduction:... 5
Literature Review: ... 6
Fair Value Definition: ... 6
Application of Fair Value to Liabilities: ... 8
Fair Value Measurement Approaches: ... 9
Cost Approach: ... 9
Market Approach: ... 10
Income Approach: ... 11
Critical analysis and Limitations: ... 12
Fair Value and the Financial Crisis: ... 13
Introduction: ... 13
Was Fair Value the main responsible for the financial crisis? ... 14
Financial Crisis and Volatility: ... 16
Pros and Cons of Fair Value Accounting:... 17
Recommendations: ... 19
Accounting for Biological Assets: ... 21
Introduction:... 21
IAS 41: ... 21
Historical Cost Versus Fair Value in Biological Assets: ... 24
Biological Assets: An international analysis ... 26
Fair Value of Standing Timber: ... 28
Precious Woods ... 31
Company Presentation: ... 31
Analysis of the period between 2006 and 2008:... 36
Methodology and Assumptions ... 36
Changes in Fair Value of Biological Assets and its impacts ... 37
Analysis of the Year 2009: ... 41
Methodology and Assumptions ... 41
Changes in Fair Value of Biological Assets and its impacts ... 43
Green Resources ... 46
Company Presentation: ... 46
4
Changes in Fair Value of Biological Assets and its impacts: ... 54
Impact in the Financial Statements: ... 54
Analysis of the caption in the Income Statement related to Changes in Fair Value of Biological Assets:... 55
Case Study Conclusion:... 57
General Conclusion: ... 60
5
Introduction:
This dissertation is divided in 3 main topics:
Firstly, I address Fair Value definition, the three approaches to Fair Value, the arguments concerning the responsibility of fair value in the financial crisis, its relation with volatility, arguments in favour and against the use of Fair Value accounting and some recommendations.
Secondly, I present a section relative to biological assets and its guiding rule IAS 41 and also a narrow subsection concerning forestry assets, which are a type of biological assets. According to IAS 41, biological assets should be measured at fair value and the suitable basis for ascertaining the fair value of a biological asset is the quoted price in an active market, followed by the most recent market transaction price and sector benchmarks. If active markets are not available (especially during the growth period, for biological assets with a long growth cycle), the entity should base its analysis on discounted cash-flow methods.
Thirdly, I apply the theory absorbed in the two previous sections to analyse the application of Fair Value in two standing timber Companies: Precious Woods and Green Resources. These two companies measure their biological assets at Fair Value using DCF models, which imply several assumptions, and during the years under analysis, these companies performed changes in assumptions used to to measure their biological assets at Fair Value, which had relevant impacts on the Financial Statements. These changes in assumptions reveal both the vulnerability of the DCF models and the concern to disclose more accurate and consistent valuation methods.
6
Literature Review:
Fair Value Definition:
According to IFRS 13, Fair value is defined as “the price that would be received to sell an asset or paid to transfer a liability in an orderly transaction between market
participants at the measurement date” (IASB, 2012).
It is an exit price because it is the price that would be received if the asset was sold or paid if the liability was transferred, which is different from the amount of money paid when the asset was purchased, or received when the liability was created. Fair value therefore differs from Historical Cost, which is an entry price. When measuring fair value, it is assumed that buyers and sellers are independent and that information is available to them to support wise decisions in a hypothetical transfer of liabilities or sale of assets (Zyla, 2010).
By considering “orderly transaction”, Fair Value implies that the hypothetical sale does not correspond to a forced liquidation or distress sale. It rather assumes that the asset or liability is present in the market before the measurement date so that
marketing activities create enough competitive tension (IASB, 2012).
If possible, fair value measurements should be based on the principal market, which is the “market with the greatest volume and level of activity for the asset or liability” (IasPlus). In the absence of this market, the most advantageous market should be considered, that is, the “market that maximises the amount that would be received to sell the asset or minimises the amount that would be paid to transfer the liability, after taking into account transaction costs and transport costs” (IasPlus).
Transaction costs are solely relevant to identify the most advantageous market. Actually, to estimate the fair value of assets and liabilities, the price under estimation should not take into account transaction costs. The idea behind this stance is that transaction costs are “typically unique to a specific transaction and may differ depending on the transaction, not the asset or liability” (Zyla, 2010). As for transportation costs, these may be included in the fair value estimates.
7
As far as market participants are concerned, to be considered as such, they need to present four characteristics: be “independent of each other” (IASB, 2012),
knowledgeable, by undertaking “efforts, such as normal due diligence, to become knowledgeable about the asset or liability” (KPMG, 2011), be “able to enter into a transaction for the asset or liability” (IASB, 2012), and be “willing to enter into a transaction” (IASB, 2012).
Fair value considers that market participants deal with assets at their highest and best use. Highest and best use is the “use of a non-financial asset by market participants that would maximise the value of the asset or the group of assets and liabilities within which the asset would be used” (IasPlus). “Highest and best use” requires the use of the asset to be “physically possible, legally permissible and financially feasible” (IASB, 2012). It must also maximise its value.
As an example, let’s suppose one reporting entity acquires a telecommunications company in a business combination. This telecommunications company developed a certain technology that is outside its core business so that technology was not
implemented in the telecommunications company’s current services. Let’s also suppose that the reporting entity (acquirer) doesn’t intend to use that technology in its operations either. The point is not on whether the acquirer intends or not to exploit the technology in its business, as “if the technology would be exploited by other market participants, the fair value of the technology would be based on its highest and best use” (Zyla, 2010). Accordingly, the fair value reported in the acquirer financial statements should be estimated as if the technology would be utilized (by other market participants) (Zyla, 2010).
8 Application of Fair Value to Liabilities:
The relevance of this specific topic is due to the fact that the way liabilities are accounted for financial reporting purposes can be misleading. Liabilities reported at fair value have to be adjusted for credit risk changes. If the credit risk of the liabilities measured at fair value decreases, the fair value of the liability increases. This increase in the liability, seen as an improvement in the credit risk of the company (because it decreased), leads to a loss in the income statement. In pure financial accounting terms, there is a Debit in Expenses and Credit in Liabilities. On the other hand, if the credit risk deteriorates (increases), the fair value of liabilities decreases, in which case there is a debit in liabilities and a credit in Revenues, leading to a fair value gain.
Gaynor performed a research where the participants were financial-statement users, to test them in this topic. “The majority of participants incorrectly associated gains (losses) arising from a change in a liability’s fair value with a (n) decrease (increase) in credit risk” (Gaynor et al, 2011). Besides this first experiment, they performed another one with relational disclosures that “stated the directional effect of the change in the company’s credit risk on the income statement” (Gaynor et al, 2011). Better results were achieved in this second experience.
Having said that, and bearing in mind that Certified Public Accountants were the participants of this research, it is clear that this topic is not still a comfortable one in the accounting area, but it is also clear that better disclosures improve the knowledge or at least the ability to understand financial statements.
Besides the counter- intuitive effect, these gains or losses can be seen as somewhat artificial because the responsibility of the company to its creditors remains the same, due to the fact that the face value of the debt and its prospective debt service remain unchanged.
9
Fair Value Measurement Approaches:
Three approaches may be used by management, and then audited by certified professionals, to estimate the fair value of assets and liabilities: Cost, Income and Market Approach.
Cost Approach:
The cost approach “asks what it would cost today to acquire the same or similar assets” (King, 2006). This approach is not usually used concerning financial assets. It is more common in real estate, machinery and equipment assets (King, 2006). According to IFRS 13, the current replacement cost method (the usual method to calculate fair value under the cost approach) reflects how much it would cost to reproduce the service capacity of an asset of comparable utility, adjusting for physical, functional and economic obsolescence(IASB, 2012).
Physical obsolescence can have two causes that can be intertwined: the higher the age of the asset and/or the use of the asset, the higher the obsolescence. Functional
obsolescence means that the asset is no longer able to perform the activity it is intended to. This happens a lot due to technological obsolescence, which is a type of functional obsolescence. Concerning economic obsolescence, it means that the asset is still able to perform its required function, but it is no longer profitable (Zyla, 2010).
One shortcoming that is associated with the cost approach is that opportunity cost of capital (incentive to invest in this asset in detriment of other choices) and profit percentages (incentive to stay in business) are not taken into account, although they should be included to reflect the true fair value amount (King, 2006).
10 Market Approach:
The market approach, as the name dictates, applies when a market exists where it is possible to observe the prices of the same asset or similar assets (King, 2006). “It is not ordinarily utilized by appraisers for intangible assets” (King, 2006) because “intangibles, due to their unique characteristics, have virtually no market
participants” (Catty, 2010). This is the most reliable approach, because it is not a product of judgemental values performed by management, which can lead into frauds; and the valuation approaches that are used should always aim to “maximize the use of relevant observable inputs and minimise the use of unobservable inputs” (KPMG, 2011).
Regarding stocks, there are two methods worth to be mentioned, as far as the market approach is concerned: the “Guideline Public Company method” and the “Guideline Transaction Method” (Zyla, 2010). The former “uses multiples derived from the market trading price of similar publicly trading companies, while the latter derives multiples from the acquisition price of similar companies that were recently
acquired” (Zyla, 2010). The same reasoning behind these two methods regarding shares can be applied to other kinds of assets with a market, such as machinery or land.
The market approach may also present drawbacks, namely if the market for the asset is not fully liquid, possibly causing bias in fair value calculations.
11 Income Approach:
The income approach “asks what investors are willing to pay for an asset with a given income stream in the future” (King, 2006). To value these assets one needs to
forecast future cash-flows provided by the asset and use discount rates to reach the present value. Several valuation techniques are used concerning the Income
Approach: Present Value Techniques, Option Pricing Models (Black-Scholes-Merton formula or binomial model) and Multi-Period Excess Earnings Method (used to calculate Intangible Assets such as customer relationships or technology) (IASB, 2012).
Concerning the Present Value Techniques, IFRS 13 mentions two: the discount rate adjustment technique and the expected present value technique. “The discount rate adjustment technique uses a risk-adjusted discount rate and contractual, promised or most likely cash flows” (IASB, 2012). The expected present value technique has two possible methods. It can adjust for risk in the cash-flows, which are then discounted at the risk-free rate, or it can use a risk-adjusted discount rate with expected cash-flows, which are probability weighted (IASB, 2012).
12 Critical analysis and Limitations:
Despite the fact that it is relevant for financial statement users to acknowledge the approaches used by firms when valuing assets, it is also mandatory, according to IFRS 7, to classify assets and liabilities according to inputs. Level 1 concerns
unadjusted quoted prices in active markets for similar instruments, which is the most reliable input. Level 2 inputs are relative to directly observable (prices) or indirectly (derived from prices) market inputs other than Level 1 inputs. Finally, level 3 inputs are basically mark-to model, because they are unobservable inputs, which mean that they are not based on market data, which implies immediately that they are less trustworthy (IASB, 2012).
The company Ernst & Young goes even further in its analysis of Level 3, mark-to-model assets and liabilities, stating that “the IASB has placed too much emphasis on its view of what constitutes relevant information and has given insufficient
consideration to the other attributes, in particular reliability and understandability” (Ernst & Young, 2005).
Having said that, the question posed next is how to improve Level 3 information. Song and Yi find not only that companies with stronger corporate governance mechanisms increase the accuracy of Level 3 assets and liabilities estimates
compared to companies with weaker corporate governance mechanisms, but also that “the impact of corporate governance on the value relevance of fair values is greater for Level 3 assets compared to Level 1 and Level 2 assets” (Song and Yi, 2010). By value relevance, the authors refer to fair value information that more accurately reflects real volatility, therefore subject to less estimation errors by management and prone to less managerial manipulation.
13
Fair Value and the Financial Crisis:
Introduction:
In order to better understand the impact of fair value in the Financial Crisis that started in 2008, and because this crisis started in the banking sector, I will first provide a brief explanation of the role of banks in the economy. Casu, Girardone and Molyneux (2006) identify three transformation functions performed by banks: size transformation, maturity transformation and risk transformation. Size
transformation occurs because banks collect small deposits and lend higher amounts of money. This can happen because banks benefit from economies of scale, because of the huge amount of deposits they collect in the market. Maturity transformation occurs because banks borrow short-period amounts of cash and lend with a bigger time frame. With this maturity transformation the liquidity risk emerges, which is the risk of not receiving cash from whom they lent money as fast as it is needed by the depositors. Finally, risk transformation occurs because there is a credit risk, which is the risk that the institutions or people to whom the bank lent money, will default. On the other side of the balance sheet, liabilities, banks cannot default on their commitments, because it would generate loss of confidence in the banking system. Therefore, banks reduce the risk of defaulting in their liabilities through
diversification and through capital buffers. The amount of capital required to cushion against asset impairments is not only based on the assets values overall, but mainly on the risk-weighted assets. Capital requirements are a pillar issue in banking,
materialized in Basel agreements, which are given such an importance because higher capital buffers trade-off with higher return on equity (Casu, Girardone and Molyneux, 2006).
Concerning the financial crisis itself, what happened, for accounting purposes, was the following: with the rise in the interest rates, subprime homeowners were not able to pay their mortgages, which led to impairment on banks assets, and therefore to reductions in capital (because liabilities couldn’t suffer from these impairments, or it would reduce banking confidence levels). However, Basel rules implied that banks maintained a certain level of capital, so to keep up with these capital requirements, banks sold assets. These asset sales were considered distressed transactions, in which
14
the “seller is forced to accept the best price offered in the shortened time available” (KPMG, 2011).
Was Fair Value the main responsible for the financial crisis?
Some authors argue that fair value accounting is not the main responsible for the financial crisis. “The subprime crisis was caused by firms, investors, and households making bad operating, investing, and financing decisions, managing risks poorly, and in some instances committing fraud, not by accounting” (Ryan,2008).
Besides, “banks failed not because of fair value accounting but due to a loss of investor confidence and their inability to attract funding and liquidity” (Harris and Kutasovic, 2010) and also due to “loose credit policies, poor internal controls and bad business judgment” (Harris and Kutasovic, 2010).
On the other hand, fair value accounting is blamed by some authors to be responsible for the financial crisis.
“FVA has accelerated and amplified the current financial crisis” (Magnan, 2009). Indeed, “marking to market pushed many banks toward insolvency and forced them to unload assets at fire-sale prices, which then caused values to fall even further” (Pozen,2009).
SEC performed a study in late 2008 across the banking sector, which reached the conclusion that only approximately 22% of financial assets were both reported at fair value and had a direct impact in regulatory capital and net income in 2008,
concerning the banks included in the study (Pozen, 2009).
However, this argument solely pinpoints that there were few assets recorded at fair value that impacted regulatory capital in a direct way. If there were more assets recorded at fair value, maybe the crisis would have been even deeper. In fact, with IFRS 9 (already published and being used by some banks, but mandatory only from 2015 onwards), more financial assets will be recorded at fair value, and only if this IASB standard was applied in 2008 it would be possible to ascertain credible conclusions.
15
Some authors blame the regulatory bodies instead of accounting itself: “FVA-based financial reporting is only the messenger that a firm’s solvency is undermined by its financial strategies or lending practices, but it is up to regulators to figure out how to use such information” (Magnan, 2009). Therefore, “this is simply a case of blaming the Messenger. Fair value accounting is not the cause of the current crisis. Rather, it communicated the effects of such bad decisions as granting subprime loans and writing credit default swaps” (Pozen, 2009).
To sum up, opinions diverge concerning the impact of fair value in the financial crisis. The debate over the impact of fair value in the financial crisis is the debate over the alternatives, mainly historical cost. If fair value was the responsible for the crisis, could the alternative, historical cost, have prevented this crisis? Considering a recent situation, what would investors prefer regarding banks with Greek debt in their assets? Not to perform mark-to-market valuations and therefore not present their losses? Isn’t it better to be transparent, by recognizing their losses and consequently be required to increase capital buffers?
On the one hand, “we do not want banks to become insolvent because of short-term declines in the prices of mortgage-related securities” (Pozen, 2009). But on the other hand, reporting financial assets at historical cost may ignore reality, as happened in Japan after 1990, where bank losses were hidden and the cleanup of toxic assets was delayed (Pozen, 2009).
16 Financial Crisis and Volatility:
The use of mark-to-market techniques to measure the value of financial assets can have two different impacts. On the one hand, mark-to-market correctly gives insights about fundamental volatility. On the other hand, this fundamental volatility
influences financial institutions actions, which are then reflected in prices again. This is called artificial volatility, reflected into prices (Sapra, 2010).
There is “the possibility of the emergence of a feedback loop whereby anticipation of short-term price movements may change the behaviour of financial institutions in such a way as to further amplify these price movements” (Sapra, 2010).
This feedback effect is higher if banks are more sensitive to short-term price changes, which occurs with fair value option. These shocks inside the system are due to
endogenous risk. If it resulted from a feedback loop outside the system, we would be in the presence of exogenous risk (Sapra, 2010).
If these feedback loops generate strong effects, banks decision makers base their guesses on other financial institutions decisions, instead of fundamentals (of prices) themselves. This is what happened in the financial crisis. Eventually, “prices spiralled down even further, which led more banks to sell their loans, and so on” (Sapra, 2010).
17
Pros and Cons of Fair Value Accounting:
Before entering in the subject, fair value accounting, and accounting itself, wouldn’t be of relevance if markets were completely liquid, if there was no private information, and if decision makers had no distorted incentives. “Accounting measurement is relevant only because we live in an imperfect world” (Sapra, 2010).
Arguments against Fair Value:
Starting with the critics against fair value accounting, “when banks and insurance companies complain about fair value accounting, they don't have liquid assets such as currency futures in mind” (Sapra, 2010). Having said that, “the damage done by marking-to-market is greatest when claims are long – lived, illiquid, and senior. These are precisely the attributes of the key balance sheet items of banks and
insurance companies” (Plantin, Sapra and Shin, 2008). This is the reason why banks and insurance companies were not the main apologists of the introduction of fair value in accounting rules. While for banks these claims appear in the asset side, for insurance companies it appears on the liabilities side (Plantin, Sapra and Shin, 2008).
Another disadvantage is relative to artificial volatility, mainly focused on assets that are market-to-model, “driven by short-term fluctuations in financial market
valuations, or caused by market imperfections or by inadequate development of valuation techniques” (Enria, Cappiello et al, 2004).
Another drawback, also related to market-to-model assets, is the reduction in the comparability and reliability of financial reports in different companies. When no markets exist, models are developed, and despite the attempt by IASB and FASB to seek convergence in the model assumptions and inputs, there is room for
manipulation or inaccuracy. In fact, Michel Magnan advocates that unverifiable future cash flows, reached through inaccurate capitalizations, lead to “managerial opportunities to make strategic valuation choices” (Magnan, 2009) and “introduce significant noise into the financial reporting process that may be costly to investors” (Magnan,2009).
18
Another disadvantage relative to managerial behaviour is also pinpointed by Michel Magnan, and advocates that corporate management can postpone asset impairments by avoiding the day the impairment should be recognized. This leads into lack of transparency and relevance of financial reporting (Magnan, 2009).
Arguments for Fair Value:
Concerning the advantages of fair value accounting, not only it gives a better insight about the accuracy of the risk profile of banks, but also contributes to more financial stability to shareholders and depositors, by readily identifying “a deterioration in the safety and soundness of a bank” (Enria, Cappiello et al, 2004).
Mary E. Barth advocates that fair value can reflect in a better way than Historical Cost the qualitative characteristics envisaged by the Conceptual Framework for the
Preparation and Presentation of Financial Statements. Firstly, investors are
concerned about the changes in fair value on a certain reporting period. “The fact that investors consider these changes to be relevant indicates that fair value must be somewhat effective at capturing timely information on fluctuating economic values” (Mary E. Barth, 2010). This is in accordance with “Timeliness”, one of the qualitative characteristics. Furthermore, “relevance” also perfectly matches fair value
idiosyncrasy, because the current (fair) value of assets and liabilities are “capable of making a difference in the decisions made by users” (IasPlus). Two other
characteristics, comparability and neutrality, fall into the fair value definition. Concerning comparability, “Fair value will differ for items that differ economically, and be the same for items that are the same economically” (Mary E. Barth, 2010), and concerning neutrality, “fair value is an unbiased measure of assets and liabilities” (Mary E. Barth, 2010).
19
Recommendations:
Fair Value enables investors to have access to more timely information than historical cost. Investors appreciate that possibility of having precise values for assets and liabilities. However, as seen before, this can lead to higher volatility. The solution was not through less use of fair value, according to IASB rules. Actually, fair value
application is increasing, followed closely by stricter capital rules in the banking sector according to Basel III to absorb the increased volatility. Therefore one
recommendation is, in the case of the financial sector, to deal with “the relevance of establishing a capital buffer that looks through the cycle, augmenting the capital position during boom cycles to withstand the burden on capital that stems from economic downturns” (Novoa, Scarlata and Solé, 2009).
Stronger capital concerns to mitigate possible impacts in crisis situations don’t confine to fair value assets and liabilities. One interesting point is relative to provisions. “Broadening the current narrow concept of provisions to incorporate additional methods of retaining income in upswings could provide a way of better offsetting balance sheets’ procyclical effects, for not-fair-valued assets” (Novoa, Scarlata and Solé, 2009). Provisions are “liabilities of uncertain timing or amount” (IasPlus) where payment is probable and the obligation event is part of the past, therefore they can be seen as expected losses, unlike regulatory capital that is needed to face unexpected losses. If provision amounts were estimated with the best possible link to “expected volatility, higher risks and potentially larger losses of an asset” (Novoa, Scarlata and Solé, 2009), they could prevent negative shocks of the business cycle in a more accurate way. “Coordination between accounting standard setters and supervisors would be needed to effect such changes” (Novoa, Scarlata and Solé, 2009).
Due to lack of accuracy in certain mark-to-model assumptions, Novoa, Scarlata and Solé, in their study concerning financial instruments of banks, advocate that the register of assets at fair value “should be supplemented by information on a financial instrument’s price history, the variance around the FV calculations, and
management’s forward-looking view of asset price progression”. (Novoa, Scarlata and Solé, 2009) This approach would help clarify the volatility impacts in such
20
recurring fair value measurements (which are relative to assets measured at fair value at each reporting date, which doesn’t necessarily imply that appraiser valuations are performed every year, because it would be too costly), of financial assets and
liabilities accounted for at fair value and that fall into the Level 3 of fair value hierarchy, imply that such measurements should be accompanied by narrative and quantitative sensitivity analysis of changes in unobservable inputs.
Concerning truthful information, it would be possible to achieve higher transparency by increasing, in a compulsory way, the frequency of financial statements available to the public (Sapra, 2010). These reports could focus on more relevant information, with a particular section addressing risk analysis in depth (Novoa, Scarlata and Solé, 2009). Besides, this increased timely information would minimize informational mismatches across financial investors in the stock market, increasing price efficiency, and could improve corporate governance mechanisms (Sapra, 2010).
However, the same question raised before emerges in this argument: we can have more frequent reports that improve financial information to stakeholders and shareholders, but does the relevance of these reports improve with or without more assets and liabilities reported at fair value? Maybe to add to these more frequent reports, the reports themselves could publish for example “two versions of its
earnings per share (EPS) each quarter – one calculated with fair value accounting and the other without” (Pozen,2009). This could be one step to overcome volatility.
21
Accounting for Biological Assets:
Introduction:
Despite the fact that nowadays agriculture has been given its due importance in the accounting world, it has not always been like this, although agriculture has always been a cornerstone of many economies in several countries. Traditionally,
agricultural companies were of small size, family held businesses, not obliged to produce financial statements, and only performed some kind of accounting activity to comply with tax and subsidy requirements (Argilés and Slof, 2001). “Also, grantors of farm credit have historically looked to the character of the borrower, usually a long time resident with deep roots in the community, rather than to financial statements” (Epstein and Jermakowicz, 2010).
Another factor possibly contributing to the scant attention given to agriculture by standard setters around the world is based on the fact that the main regulatory bodies have been based in the US or UK, and in these economies agriculture is not given such importance as in less developed countries. Besides, singular characteristics of this industry, such as biological transformation like growth, production, degeneration and procreation, which cannot be accounted with traditional accounting classification schemes, postponed its concern by financial reporting rules (Epstein and
Jermakowicz, 2010).
IAS 41:
In this section I will provide a summary of IAS 41 implications based on the standard provided by the European Commission website (www.ec.europa.eu). IAS 41 effective date was 1 January 2003, although the IASB encouraged earlier application.
According to IAS 41, biological assets are living animals or plants. This standard deals not only with biological assets but also with agricultural produce at the point of
harvest, where agricultural produce is the harvested product of the entity’s biological assets.
22
After the point of harvest, agricultural produce is no longer ruled by IAS 41, but instead by IAS 2 (Inventories) or another applicable standard. For example, sheeps and dairy cattle are biological assets; wool and milk are their agricultural produce, respectively. But the process of converting wool into yarn and carpet or of converting milk into cheese, are no longer relevant for IAS 41, because these are products that are the result of processing after harvest. Similarly, and with greater relevance for this study, trees in a plantation forest are biological assets, felled trees are
agricultural produce, and logs/lumbers are products that are the result of processing after harvest.
Harvest is the detachment of produce from a biological asset or the cessation of a biological asset’s life processes. The “cessation of a biological asset’s life” is concerned with consumable biological assets, which are those that are to be harvested as
agricultural produce or sold as biological assets. Examples of consumable biological assets are livestock intended for the production of meat, livestock held for sale, fish in farms, crops such as maize and wheat, and trees being grown for lumber. The
“detachment of produce from a biological asset” is concerned with bearer biological assets, which are for example livestock from which milk is produced, grape vines, fruit trees, and trees from which firewood is harvested while the tree remains.
According to IAS 41, biological assets can be grouped into mature and immature. This distinction enables stakeholders to analyze future impacts of these biological assets in P&L and balance sheet, in terms of the future economic benefits that will be
generated in the short-term (mature biological assets) or in the long-term period (immature biological assets) (Costa, 2011). Mature ones can still be divided between those that have attained “harvestable specifications (for consumable biological assets) and those that are able to sustain regular harvests (for bearer biological assets)” (www.ec.europa.eu).
Concerning the recognition and measurement of biological assets, according to IAS 41, these are to be measured at its fair value less costs to sell, on initial recognition and at the end of each reporting period, except for the cases where fair value cannot be measured reliably. Costs to sell are the “incremental costs directly attributable to the disposal of an asset, excluding finance costs and income taxes”
23
The quoted price in an active market or in the most relevant market if the entity has access to different active markets, which exists for a biological asset or agricultural produce, is the suitable basis for ascertaining the fair value of that asset. If these active markets don’t exist, the company bases its evaluation on the following 3 alternatives: the most recent market transaction price, if there have not been
considerable changes in the economic environment since the date of the transaction until the end of the reporting period; “market prices for similar assets with
adjustment to reflect differences” (www.ec.europa.eu); and sector benchmarks. Sector benchmarks are for example “the value of an orchard expressed per export tray, bushel, or hectare, and the value of cattle expressed per kilogram of meat” (www.ec.europa.eu).
If market based prices are not available, the entity bases its analysis on discounted cash-flow methods. The calculation of cash-flows is based on what market
participants would expect the asset to reproduce in the most relevant market. Cash-flows for financing the asset, taxation and for re-establishing biological assets after harvest, “for example, the cost of replanting trees in a plantation forest after harvest” (www.ec.europa.eu), are not included.
According to IAS 41, gains and losses arising on initial recognition of a biological asset or of agricultural produce at fair value less costs to sell, and from changes in fair value less costs to sell of biological assets, should be reported in the income statement in the respective period.
Biological assets shall be measured at cost less accumulated depreciations and impairment losses, only on initial recognition, and only when neither market based prices are available or when alternative ways of accounting at fair value are clearly unreliable. Once the fair value calculation becomes an accurate estimate of the value of the asset, the entity shall value the asset at fair value less costs to sell until disposal (www.ec.europa.eu).
According to some authors, the fact that biological assets strengthen, mature or fatten over time, therefore changing its physical condition constantly, makes it inherently less reliable to value these assets at cost (Argilés and Slof, 2001).
However, the cost method may be a reasonable way to value biological assets, and it might be a good approach to estimate fair value, in two specific situations: if tree
24
seedlings are planted just before the end of the reporting period, or other situations where no relevant biological transformations have taken place, or in the case of a biological asset with a long life, like a pine plantation with a production cycle of 30 years, where in the initial growth phase the impact of the biological transformation on price is not considered to be relevant (www.ec.europa.eu).
Historical Cost Versus Fair Value in Biological Assets:
There are production periods for many crops that are so long that impose the need to account the fair value changes in operating profit every period, otherwise gross distortions would be made, because with cost methods the entire earnings of a long production process would be reported only at distant intervals, “which would not faithfully represent the underlying economic activities being carried out” (Epstein and Jermakowicz, 2010). This can be compared with long-term construction
undertakings, which are commonly accounted for as percentage-of-completion, for the same reasons. Beyond these periodic distortions that would be committed by cost methods, it is relevant to stress that each stage of the biological transformation process (growth, degeneration, procreation and production) has significance and contributes to the expected economic benefits coming from biological assets. If the cost model would be the norm, “there would be a lack of explicit recognition (in effect, no matching) of the benefits associated with each of these discrete events” (Epstein and Jermakowicz, 2010). These biological transformations, reflected in financial statements, represent two kinds of changes in the fair value of biological assets, physical changes and price changes.
When market prices are not available, and biological assets are valued with a discounted cash flow approach, the discount rate chosen should reflect the risks inherent to the future cash-flows. However, these risks are not only those concerned with the entity, but also with the biological transformation itself, which the company doesn’t fully control, and even more important with the high risk of the agricultural activity, such as climate changes, price volatility and the possibility of adverse meteorological conditions (frosts, hail, persistent rain, natural disasters).
25
Another factor contributing to the difficulty to measure biological assets at fair value is the lack of active markets, especially during the growth period, for biological assets with a long growth cycle (like pine trees with 30 years of growth until harvest).
Besides, there can be also a lack of match between fair market prices and selling prices, because the selling price can be regulated by contracts, like exclusive contract deals bargained with cooperatives (Costa, 2011). But even if these active markets do exist, their access conditions can imply high and discouraging costs to agricultural companies, especially to small-sized ones, where the information cost may not offset the generated benefits (Mendes, 2010).
Still, some authors advocate that it is difficult to reliably ascertain the production cost of biological assets. One of the biggest barriers to use the cost method binds with the presence of joint costs in agriculture, and the frequent lack of analytical accounting systems in agricultural companies able to deal and analyze these data to elaborate correct estimations (Mendes, 2010).
Concerning the fact that a change in the fair value of biological assets is reported in the income statement in the period when it occurs, even if the objective is to improve the relevance of accounting information available to investors, it is nevertheless a solution that can mislead shareholders expectations about the future value to be distributed as dividends (Mendes, 2010). “Consequently, financial statements users can develop unrealistic expectations of distributable profits, creating pressure for entities to declare and pay dividends for which no funds are available” (Elad and Herbohn, 2011). To deal with this situation, some authors propose that financial statements should separately present the “obtained and distributable income” and the earnings that have not been transacted yet (González and Lauro, 2007).
26
Biological Assets: An international analysis
Some authors developed a study concerning fair value in the agricultural sector based on a survey and an analysis of annual reports in France, Australia and UK (Elad and Herbohn, 2011).
The main objective of the study is to investigate in an empirical way the application of IAS 41 in these countries, and ascertain about harmonization practices in farm
accounting. It is relevant to state that in Australia IAS 41 is not applicable. Instead, Australian companies apply the AASB 141, which resembles IAS 41 as regards fair value measurements.
In France (that possesses the largest agricultural share in Europe, with more than 20% of the European Union agricultural output), more than 50% of the companies analyzed used historical cost method under IAS 41. Therefore, the weak impact of the standard is explained by the fact that the “Plan Comptable Général Agricole” remains the regulatory guidance in most agricultural entities in France.
Furthermore, as far as small and medium-sized agricultural entities are concerned, IAS 41 is not expected to have a significant impact on these companies, both in France and in Australia and UK, because not only there is an option to use historical cost when fair value cannot be determined reliably, but also because the IASB itself recommends that these companies don’t use fair value unless it implies minimized cost or effort.
In their annual report analysis, that relates to the financial year 2006-2007, these authors found on the one hand that the option to use historical cost under IAS 41 is more common in France than in Australia or UK. On the other hand, the present value method is the more commonly used in Australia and UK (when using the Fair Value approach), where the valuations were usually undertaken by independent external appraisers, mainly in the plantation and forestry area.
These same authors found in their study that discount rates estimated in net present value methods, besides being subject to judgement and assumptions, are difficult to determine in less developed capital markets, particularly the risk free rate. In the 3 countries analyzed, it is difficult to establish risk premium for forestry assets, that’s why some companies present sensitivity analysis in their financial reports.
27
These difficulties in reaching an accurate value for the discount rate can lead into problems with auditors and regulatory bodies. It happened with Touchwood Ltd (Sri Lankan company), its auditor (KPMG) and the local stock exchange regulator. At the date of the book (Elad and Herbohn, 2011), it was subject of a pending court case between Touchwood, the Sri Lankan Accounting and Auditing Standards Monitoring Board, and the local stock exchange regulators. The company advocated a discount rate of 12%, whereas the auditors advocated that the appropriate discount rate was of 17%, which would decrease the value of the forest.
Another case, where a company was embroiled in a major dispute with their auditors, occurred in a French biological company, whose accounts were subject to a
qualification by their auditors. The company mentioned is DUC SA, specialized in poultry farming. In the aftermath of an avian influenza epidemic, concerning the financial year ending 2006, the auditors, Synergie – Audit and Mazars & Guerard, advocated that the company didn’t use effective strategies to assess future cash-flows, taking into account the uncertainties of these cash-flows generated by lack of
consumer confidence in the safety of poultry goods.
Lastly, this study denotes that IAS 41 may promote social conflict in some countries (mainly tropical ones), “where stakeholder advocacy organisations have argued that fair values established by market forces do not reflect the real value of tropical agricultural commodities such as coffee, tea, banana, or cocoa” (Elad and Herbohn, 2011).
Some stakeholder advocacy groups and human rights activists don’t accept the fair value, stating that the minimum fair trade price is higher than the fair market value. Therefore, by reporting these kinds of biological assets in financial statements at fair value, IAS 41 is promoting alienation of reality. This issue is behind global campaigns fostered by ethical investors, environmental non-governmental organizations and religious groups around the world, all united by the Fair-trade Foundation. This movement seeks to give a voice to disadvantaged agriculture workers in tropical countries, so that altruistic consumers in industrialised countries can “demonstrate empathy and solidarity by their willingness to pay a price premium (above the conventional market price) to alleviate the inequities of free trade” (Elad and Herbohn, 2011).
28
Likewise, in Europe, biological assets according to IAS 41 are subject to subsidised and politically mediated market prices, because of the vast impact of the European Union’s Common Agricultural Policy (CAP). To give an example, in 2009, 41 billion Euros were distributed to European farmers as subsidies, amounting to over 40% of the European Union’s budget.
Therefore, selling prices of farm goods that are transacted with developing countries are below production costs. “Such protectionist policies undermine the fair value model in IAS 41 which forges a tight link between heavily subsidised market prices and the value of biological assets” (Elad and Herbohn, 2011).
Fair Value of Standing Timber:
Several motivations led to a study of standing timber assets performed by PwC in 2009 (and also the update study in 2011). On the one hand, institutional investors support that these assets provide “an alternative and sustainable long-term
investment strategy” (PwC, 2009), thus legitimating the growing interest in forestry assets. On the other hand, “forestry is attracting new strategic investor interest as wood-based biomass is seen as a vital renewable energy resource” (PwC, 2009).
Standing timber active markets “are limited in comparison with the total volume of standing forest” (PwC, 2009) because most of these markets are solely available as regards the harvested products of forest, such as logs. Therefore, most companies in the PwC study use discounted cash-flow methods to value timber assets, “in
particular, all preparers with slow-growing forests located in the Nordic region apply DCF methods” (PwC, 2009). Companies that value their timber assets using active market prices, and consider these markets to be reliable, usually possess “plantations with relatively short rotation periods, typically between 5-20 years” (PwC, 2009). However, a few companies still apply historical cost approaches, where besides the lack of market-based prices, there is also a lack of growth rate patterns or physical volumes. Moreover, companies stick to historical cost for newly planted seedlings (immature forests) where few biological changes have taken place.
29
Climate change also affects growth patterns of timber assets and therefore it is relevant for valuation issues, because it impacts financial reports, “for example, the increasing role of woody biomass as a renewable energy source. There are nascent markets in forest carbon credits, which is seen as one way of monetising the
environmental contribution of forests” (PwC, 2009). This challenges the traditional valuation of timber assets that was headed towards log prices, because “biomass sourcing extends to the whole tree, potentially roots and all” (PwC, 2009).
According to this PwC study, the main assumptions undertaken by companies valuing their timber assets with net present value models comprise harvesting plans, growth rates, timber prices, discount rates and forestry costs. The main differences in the assumptions relate to obvious differences in the geographic location of the
plantations, rotation periods, silvicultural practices and idiosyncrasy of the species.
Regarding timber prices, companies either use current market prices or adjusted market prices. Adjusted prices are used by companies with longer growth cycles “and the adjustment is made to smooth out short term volatility in market prices for logs” (PwC, 2009). In regions where species present faster rotation patterns, current unadjusted prices are considered trustworthy to develop accurate fair value models.
Concerning harvest plans, it is considered the most important assumption for an accurate modelling. It “includes planned volumes to be harvested (both clear felling and thinning) over a foreseeable future, and related extrapolations of the remaining volumes for the period of time until harvest” (PwC, 2009). Usually, a harvest plan is one entire cycle from seedlings until the trees are harvested. However, if in the presence of plantations with short rotation periods, the harvest plan can include more than one cycle, “where trees are left to regenerate naturally after the first felling” (PwC, 2009).
Regarding growth rates, these are “dependent upon general climate conditions, soil, silvicultural practice and quality of genetic material” (PwC, 2009). Furthermore, forest management activities, such as “land preparation, nursing seedlings, planting, thinning, fertilizing, protecting from animals and insects” (PwC, 2009) generate expenses called forestry costs. These costs, such as felling costs, silvicultural costs,
30
point-of-sale costs, “costs incurred to protect from natural hazards, such as fires and hurricanes” (PwC, 2009) must be taken into account when developing net present value models for standing timber assets.
Finally, the last assumption worth to be mentioned is the discount rate. It is a very sensitive variable, because a small change in its estimation can misstate the value of the asset. That’s why companies are increasingly presenting in their financial reports sensitivity analysis with, among other variables, the discount rate. In the PwC study, some companies apply the same overall company’s WACC for all their Plantations; others differentiate rates for individual plantations. Besides, it is a common practice to use pre-tax cash-flows and pre-tax discount rates.
In the update study performed by PwC in 2011, it is shown that “many companies lack information regarding the rotation period, even though this information is key to determining the harvesting plan” (PwC, 2011). The discount rate is often not
disclosed as well. Furthermore, there is also limited information regarding growth assumptions and the variables that might cause them to fluctuate. This is particularly important for plantations with shorter growth cycles, because “broadly, the sensitivity of the valuation to changes in growth factors increases as the growth cycle for
standing timber reduces” (PwC, 2011).
Finally, the authors suggest that preparers of financial statements “disclose the assumptions used and estimates made in the valuation and provide explanations as to why it is difficult to make those assumptions” (PwC, 2011) and also encourage them to “consider including a discussion on when and how the values and related cash flows are expected to be realised” (PwC, 2011).
31
Case study:
In order to proceed with a practical perspective of the fair value changes and assumptions in biological assets, I selected two companies as groundwork for the analysis: Precious Woods and Green Resources.
I chose these companies not only because the annual reports present detailed information concerning the fair value method adopted by the company to measure biological assets (mainly Green Resources), but also because in some of the years under analysis these companies performed changes in the assumptions on how fair value is measured concerning standing timber assets (mainly Precious Woods). These are therefore very interesting cases, both from a practical and a conceptual
perspective. I will provide further explanations about this “change in assumptions” more thoroughly later in the course of the work.
Precious Woods
Company Presentation:
Precious Woods is a representative company of its sector. This can be observed in Figure 1, which is taken from the PwC study concerning Fair Value of Standing Timber. The data is relative to annual reports 0f 2009 or 2010. Figure 1 shows that Precious Woods is ranked the 6th company with the biggest Forest Land
(approximately 1 million hectares) out of a universe of 25 representative companies. It is also approximately ten times bigger than the Portuguese Psi 20 companies Portucel or Altri.
32
Figure 1:
Forest Land sizes of the most representative companies in the industry (PwC study)
Having in mind that my study will embrace the annual reports between 2006 and 2010, in this section it is useful to address the most recent annual report under analysis. In 2010, Precious Woods had its Holding located in Switzerland, with 14 employees performing functions concerning corporate services, emission rights business and timber trading. This last activity was also prosecuted in The
Netherlands by 32 employees. In Gabon, Precious Woods employed 638 people doing timber processing and forest operations in a forest area of 616700 ha. These two activities were also carried out in Brazil, more precisely in the Amazon State. Plus, in Brazil there was also electricity production. The forest area was 473000 ha and 718 employees were allocated to this region. Finally, in Central America (Costa Rica and Nicaragua), 155 employees dealt with reforestation and timber processing in a reforestation area of 6488 ha (Annual Report, 2010).
33
In order to better understand how the business activities of Precious Woods are connected, I present the Value Chain in Figure 2.
Figure 2:
Value Chain and Products (Annual Report, 2010)
However, not all the business segments have the same weight on the Total operating income generated by the company. The same happens to the different regions where Precious Woods is present. In Figure 3 one can observe that “Sustainable Forest Management” is the main business segment of the company, which relates to Brazil
34
Figure 3:
Revenues generated by Business Segments and Market Regions (Annual Report, 2010)
and Gabon where “no more timber is harvested than can simultaneously grow back” (Annual Report, 2010). Although the revenues provided by the “Sustainable Forest Management Segment” have reduced from 2009 to 2010, they still accounted for more than half of the Total Operating Income in 2010. As far as the Net Sales by market region are concerned, “Europe” has by far the most considerable share in the total amount, even though it has reduced its share in 2010 compared to 2009. “Latin America” and “Africa” increased their proportion in considerable amounts in 2010, mostly at the expense of “Other Countries”.
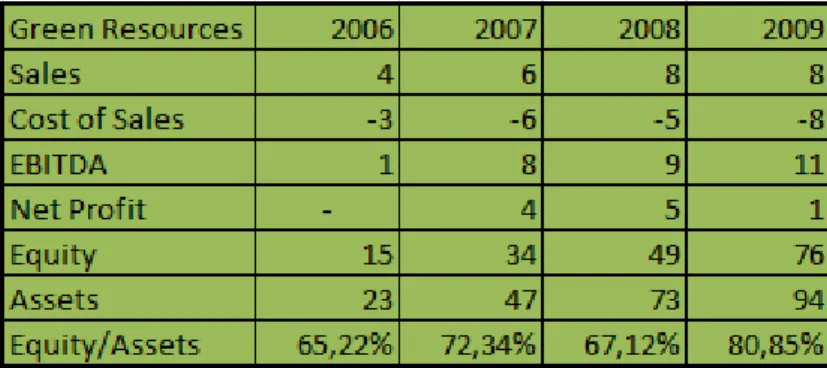
Regarding the Company as a whole, Figure 4 presents some key data essential to a brief analysis of the years I will address in this Case Study.
Figure 4:
35
Revenues almost doubled between 2006 and 2008 essentially due to increases in trading activities, but fell 18% in 2009 and 8% in 2010. EBITDA doubled in 2007 but more than halved in the following year, entering in the red in 2009. Reflecting this evolution, the EBITDA margin came down from 22% in 2006 to -7% in 2010. Consequently, the Net Income presents a negative trend, in this case from 2008 onwards.
As far as the Balance Sheet Analysis is concerned, one cannot conclude too much from the absolute values of Equity and Assets. Equity started a declining trend in 2008 reflecting the Group’s annual losses and the Assets have been going up and down between 2006 and 2010.
But an interesting case happens with the Equity/Assets ratio, which has been always decreasing between 2006 and 2010. This means that this company has been
increasing its leverage every year, and therefore the risk to the potential creditors has been increasing, possibly meaning future higher interest rates.
Three main shareholders in 2010 were: Baloise Holding (with 8, 88% of shares), Round Enterprises Ltd. (with 5, 85%) and Franke Artemis Holding AG (with 5, 52%) (Annual Report, 2010).
36
Analysis of the period between 2006 and 2008:
Methodology and Assumptions
The following information is based on the Annual Reports between 2006 and 2008. Precious Woods biological assets measured at fair value in 2006 were tree plantations in Central America. The methodology approach depends on the growth phase of the tree plantations. In the beginning of a plantation cycle the fair value is no more than the cost of arranging and sustaining the plantations so that they can grow according to the expectations. As the plantations start to grow, the fair value approach becomes the Income approach, in which plantations are valued according to discounted cash-flow methods. The cash-cash-flows are based on the estimated future harvest values of the plantations less the point-of-sale costs.
Having in mind that growth patterns differ by species and also within species of Plantations, Precious Woods, in order to achieve an accurate valuation of its biological assets, divided each species (Teak and Pochote) in five different growth classes ( Excellent, High, Average, Low, Marginal). The classes that grow faster have, consequently, a cash-flow stream (based on future income and costs) that is higher than the ones that grow slower. These growth classes are not tight, in other words, each year there is an appraisal in order to check how the Plantations are growing. If they are growing faster than expected, they can move on to a higher growth class. The same can happen the other way around. These appraisals and the definition of how to determine each growth class volumes and prices are based not only on Precious Woods professionals with vast experience in the area, but also on external estimates. As the Plantations’ valuation is grounded on a DCF method, a discount rate is put in place for each growth class of each species in order to discount expected estimated income. Besides, in the Teak species, there is also a distinction in the discount rate between regions (Costa Rica and Nicaragua). This further distinction is probably due to the fact that since 1995 Precious Woods has been planting mainly Teak, therefore the valuation gets more accurate each year.
However, there is a lack of accuracy for the particular case of the indigenous species’ valuation. In fact, for the indigenous species (ronron, almendro, caoba, cocobolo,
37
etc.), which sum up to more than twelve different kinds, there is no distinction in its valuation not only between species, but also between growth patterns, because of scarce trustworthy information is available. This is not a huge problem having in mind that the Total Value of Plantations (after discounting with the appropriate discount rate) concerning indigenous species in 2006 is not even 5% of the total (Figure 5).
Figure 5: (December 2006)
Values in Million USD of the different Plantation Species
Regarding the harvest period, between 2005 and 2008 Precious Woods considers that the final harvest shouldn’t take place before the Plantations are in their maximum potential of growth, which occur between 26 and 30 years (Figure 6). Concerning the weighted average discount rate (weighted by the different species and different growth classes in Central America), it has been similar between 2005 and 2008 (Figure 6).
Figure 6:
Harvest Period and Discount Rate between 2005 and 2008
Changes in Fair Value of Biological Assets and its impacts
As it is possible to observe in Figure 7, the caption in the Income Statement
concerning increases in Fair Value of Biological Assets reached an amount in the end of 2006 of about 5, 4 Million USD, which was slightly higher than the Profit before Tax itself (5, 35 Million USD), therefore contributing in a considerable way to the positive results of the Company in 2006. It is relevant to pinpoint that the value that
38
is exhibited in the Income Statement concerning changes in Fair Value of Biological Assets matches the difference in the value of biological assets between two
consecutive years in the Balance Sheet, for the years between 2005 and 2008, except in 2006, where the caption in the Income Statement was 353205 USD higher than the difference between the biological assets in the Balance Sheet between 31.12.2005 and 31.12.2006. In the annual report of 2006 no explanation was given regarding this difference.
Figure 7:
Decomposition of the caption in the Income Statement of 2006 concerning Changes in Fair Value of Biological Assets
In Figure 7 one can observe that more than the new Plantations implemented in 2006, what most impacted in a positive way the income statement was the growth of existing Plantations. The biological assets harvested refer to 44 hectares in Costa Rica. The change in valuation assumptions refer to a reduction in the market prices of Pochote in 2006 for the growth category “Excellent”. According to Precious Woods, market prices available for Pochote are not truly reliable. The reduction undertaken was from 240 USD to 200 USD. No more information is given in the 2006 Annual Report, but as Precious Woods chose the Income Approach, I assume these are average prices (because prices vary according to the diameter of the logs) at the expected year of harvest, per m^3, that are the basis for the cash-flow stream before discounting with the appropriate discount rate. The impact of this change in
assumptions was a reduction of about 11% in the Profit before Tax.
In spite of the fact that this study only embraces an analysis between 2006 and 2010, it was introduced in 2005 a GPS technology to measure the Plantation areas that brought a remarkable impact in the Income Statement (Figure 8). Before the GPS system was introduced, Plantations were measured through tape, which didn’t give accurate results, mainly in steep areas. GPS solves this problem by taking into
39
account “complex shapes and boundaries” (Annual Report, 2005). The impact of the new measurement procedure using GPS technology was a reduction of about 16% in the Profit before Tax.
Figure 8:
Decomposition of the caption in the Income Statement of 2005 concerning Changes in Fair Value of Biological Assets
Finally, the impact on the balance sheet of these two occurrences (change in valuation assumptions in 2006 and re-measurement through GPS technology in 2005) on total assets was not meaningful (Figure 9). In fact, the impact of these changes was less than 1% of the total assets, either in 2005 or in 2006.
Figure 9:
Impact on the Total Assets of the Biological Assets value presented in the Balance Sheet in 2005 and 2006 (Values in USD)
In 2007 and 2008 there were no changes in assumptions on how to measure biological assets. However, in 2007, 76 hectares which were until then classified as
40
biological assets, changed its classification to Investment Property. Figure 10 shows that both in 2007 and 2008 the biggest impact on the Increase of Biological Assets in the Income Statement is due to growth of previously plantations.
In 2007 the percentage of the growth of previously plantations in the total value concerning increases in fair value of biological assets in the Income Statement was bigger than 100% because the write-off with a value of 985 TUSD of certain biological assets that moved to Investment Property had a negative effect on the Increase of Biological Assets. Still in Figure 10, in 2007 the Increase of Biological Assets in the Income Statement had a positive impact in the Profit before Tax (around 50%), and in 2008 it helped to turn the Profit before Tax nearly 40% less negative. Finally, both in 2007 and 2008, approximately 5% of the Total Revenues (which also include trading and emission reduction activities besides Increases in Fair Value of Biological Assets) was due to Increase in Fair Value of Biological Assets. It is relevant to
mention that, in Figure 10, both the values regarding Total Revenues and Profit before Taxation are after adding the Increase in biological assets due to changes in Fair Value (4888 TUSD in 2007 and 6730 TUSD in 2008).
Figure 10:
Decomposition of the caption in the Income Statements concerning Changes in Fair Value of Biological Assets, PBT and Total Revenues (2007 and 2008)
Concerning the impact on the Balance Sheet (Figure 11), not only the percentage of the Biological Assets on Total Assets has increased from 2007 to 2008, but also the percentage of the increase in biological assets (value that goes every year to the Income Statement) on Total Assets. However, both in 2007 and 2008 the
percentages of the Biological Assets on Total Assets are lower than in 2005 or 2006 (compare with Figure 9).
41
Figure 11:
Impact on the Total Assets of both the Biological Assets value presented in the Balance Sheet and the value presented in the Income Statement concerning changes in Fair Value of Biological Assets (2007 and 2008)
Analysis of the Year 2009:
Methodology and Assumptions
The following information is based on the 2009 Annual Report. The year 2009 is being analysed in a different subchapter, not only because the year 2010 will not be analysed having in mind that in 2010 no changes were made to the assumptions on how to measure biological assets, but also because in 2009 several changes were made to the assumptions of the model in order to provide to the market a more accurate valuation.
The methodology to measure biological assets remained the discounted cash-flow method. However, starting in 2009, a current market-determined pre-tax rate was used to discount the cash-flows expected to be earned upon harvest of the
Plantations. Concerning the native species, only Mahogany was considered for the valuation in this year, due to the lack of growth of other native species that doesn’t justify its inclusion in the valuation.
42
Figure 12:
Changes in Valuation Parameters from 2008 to 2009
Figure 13:
43
Relative to the harvest cycle, major reductions were made in 2009 (Figure 12). Teak Plantations reduced its cycle from 3o to 20 years, Pochote reduced its cycle from 3o to 22 years, and Mahogany reduced its cycle from 36 to 30 years. The changes in the Teak Plantations’ harvest cycle were undertaken because “the incremental volume and price increases did not justify a prolonged growth period beyond 20 years” (Annual Report, 2009) because after 20 years of growth the discount rate “weighs more than the expected volume and price increases” (Annual Report, 2009). No explanations were given concerning the changes in harvest cycle of the remaining species (Pochote and Mahogany). In order to keep up with the best practices in the sector, Precious Woods used a 10-year average inflation rate (2, 5%) of the USD currency for revenues and costs used in the DCF model (Figure 12). Also, instead of discount rates that vary between species, a discount rate of 11% was used for all species categories to discount the estimated cash-flows. The remaining changes observed in the valuation parameters can also be observed in Figure 12.
Changes in Fair Value of Biological Assets and its impacts
The impact of changes in Fair Value of Biological Assets in the Income Statement in 2009 was an increase of 4840 TUSD (4572 TUSD due to changes of Fair Value and 268 TUSD due to new Plantations) (Figure 14). The harvested volume of 8515 m^3 of wood with a value of 678 TUSD didn’t count for the impact of Changes in Fair Value of Biological Assets in the Income Statement (as opposed to the practice undertaken in 2006, the last year where there was harvesting). No explanation is given in the Annual Report for this change of practice. However, the 678 TUSD in harvested area were subtracted to the 4840 TUSD when calculating the Balance Sheet Value of Biological Assets in 31.12.2009, being therefore 4162 (4840-678) TUSD higher than the value presented in the Balance Sheet at 31.12.2008.
It is possible to observe that the impact in the Income Statement (4840 TUSD) is equal to the “Total change in market value, net” (4, 2 million USD) plus 0, 7 million USD of “Reduction in harvest areas” (Figure 13). The difference (0, 06 million USD) is due to rounding issues.
Going deeper in the analysis of Figure 13, the caption “Increase due to the reduction of the forest cycle to 20 years” concerns Teak plantation species, and the increase was