arXiv:1109.0525v2 [hep-ex] 28 Dec 2011
CERN-PH-EP-2011-108
Measurements of the electron and muon inclusive
cross-sections in proton-proton collisions at
√
s = 7 TeV
with the ATLAS detector
The ATLAS collaboration
Abstract
This letter presents measurements of the differential cross-sections for inclu-sive electron and muon production in proton-proton collisions at a centre-of-mass energy of √s = 7 TeV, using data collected by the ATLAS detector at the LHC. The muon cross-section is measured as a function of pTin the range
4 < pT< 100 GeV and within pseudorapidity |η| < 2.5. In addition the
elec-tron and muon cross-sections are measured in the range 7 < pT < 26 GeV
and within |η| < 2.0, excluding 1.37 < |η| < 1.52. Integrated luminosities of 1.3 pb−1
and 1.4 pb−1
are used for the electron and muon measurements, respectively. After subtraction of the W /Z/γ∗
contribution, the differential cross-sections are found to be in good agreement with theoretical predictions for heavy-flavour production obtained from Fixed Order NLO calculations with NLL high-pT resummation, and to be sensitive to the effects of NLL
resummation.
Keywords: QCD, Heavy Flavour Production
1. Introduction
An understanding of electron and muon production in proton-proton (pp) collisions is a prerequisite for measurements and searches including these par-ticles in the final state. Moreover, the inclusive production of these parpar-ticles can be used to constrain theoretical predictions for heavy-flavour production, for which large uncertainties exist. At low transverse momentum (pT) the
beauty hadrons. The contribution from W and Z/γ∗
production, which dom-inates in the higher pT region, is well-understood [1] and may be subtracted
in order to obtain the heavy-flavour cross-section.
In measurements of b-quark production in p¯p collisions, an excess over the theoretical expectation was observed in earlier experiments [2, 3, 4, 5]. This discrepancy was later resolved by improved experimental measurements [6] and the use of Next to Leading Order (NLO) with Next to Leading Log (NLL) resummation theory applied to LEP data to extract the b-quark frag-mentation function [7, 8]. The Tevatron data were, however, not sensitive to the pT region where the deviation between the NLO and the NLO + NLL
perturbative QCD (pQCD) calculations becomes apparent. At the LHC, NLL resummation can be probed directly in the pQCD prediction for heavy-flavour production in hadron collisions for the first time.
In the analyses reported in this letter the pT spectra of inclusive electrons
and muons are measured using an integrated luminosity of 1.3 pb−1
and 1.4 pb−1
, respectively. A kinematic acceptance of 7 < pT < 26 GeV and
pseudorapidity1 |η| < 2.0 excluding 1.37 < |η| < 1.52 is considered for
electrons, and 4 < pT < 100 GeV and |η| < 2.5 for muons.
This letter is organised as follows. The experimental and theoretical methodology is outlined in Section 2. A short description of electron and muon reconstruction in the ATLAS detector is provided in Section 3, with the recorded and simulated data samples used in the analyses being discussed in Section 4. Sections 5 and 6 describe the cross-section measurements in the electron and muon channels respectively. For the muon analysis, the inclusive cross-section is compared to the most recent theoretical predictions in Section 6.6. Finally in Section 7, the electron and muon cross-sections from heavy-flavour hadron production are determined by subtracting the W /Z/γ∗
contributions. These results are compared to the predictions of NLO+NLL and NLO calculations using the program FONLL [9, 10]. Comparisons are also made to the NLO predictions from the POWHEG [11, 12] program and the Leading Order (LO) expectations from PYTHIA [13].
1ATLAS uses a right-handed coordinate system with its origin at the nominal interac-tion point (IP) in the centre of the detector and the z-axis coinciding with the axis of the beam pipe. The pseudorapidity is defined in terms of the polar angle θ as η = −ln tan(θ/2).
2. Cross-section measurement and theoretical predictions
The measured differential cross-section within the kinematic acceptance of the charged lepton is defined by
∆σi ∆pTi = Nsigi Γbini ·R Ldt · Cmigrationi ǫ(reco+PID)i · ǫtriggeri , (1)
where Nsigi is the number of signal electrons or muons with reconstructed pT in bin i of width Γbini,R Ldt is the integrated luminosity, ǫtriggeri is the trigger efficiency and ǫ(reco+PID)i is the combined reconstruction and identification
efficiency. Cmigrationi is the bin migration correction factor, defined as the ratio of the number of charged leptons in bin i of true pT and the number
in the same bin of reconstructed pT (transverse energy, ET, in the electron
case). The methods used to extract Nsigi from the total number of electron or muon candidates observed in each pTbin are explained in Sections 5.3 and
6.4. From the extracted signals, we subtract the contribution from W /Z/γ∗
production in order to obtain a cross-section corresponding to the decays of heavy-flavour hadrons produced in the pp collisions to electrons or muons. In the electron analysis, the W /Z/γ∗
accepted cross-section, σW/Z/γaccepted∗ i, is subtracted before applying the efficiency and migration correction factor, ǫ(reco+PID)i/Cmigrationi, which is specific to heavy-flavour electrons due to the dependence of the identification efficiency on isolation. In the muon analysis, the same correction factor applies for muons originating from both heavy-flavour and W/Z/γ∗
decays, allowing the subtraction to be performed at the cross-section level.
The spectrum of charged leptons from heavy-flavour decays is calculated in a theoretical framework, FONLL, permitting direct comparison with the data. FONLL is based on three main components: the heavy quark produc-tion cross-secproduc-tion calculated in pQCD by matching the Fixed Order NLO terms with NLL high-pT resummation, the non-perturbative heavy-flavour
fragmentation functions determined from e+e−
collisions and extracted in the same framework, and the decays of the heavy hadrons to leptons using decay tables and form factors from B-factories. The theoretical uncertainties associated with the FONLL prediction will be discussed in Section 7 when the comparisons to the measured cross-sections are made.
3. Electron and muon reconstruction in the ATLAS detector The ATLAS detector consists of three main components: an Inner De-tector (ID) tracking system immersed in a 2 T magnetic field, surrounded by electromagnetic (EM) and hadronic calorimeters and an outer muon spec-trometer (MS). A full description can be found in [14]. The ID provides precise track reconstruction within |η| < 2.5, employing pixel detectors close to the beam-pipe, silicon microstrip detectors (SCT) at intermediate radii and a Transition Radiation Tracker (TRT) at outer radii. Within |η| < 2.0 the TRT provides substantial discriminating power between electrons and pions over a wide energy range. The inner-most pixel layer (the B-layer) is located at a radius of 50 mm and provides precision vertexing and significant rejection of tracks produced by photon conversions.
Within |η| < 2.5, EM calorimetry is provided by the barrel and end-cap lead/Liquid-Argon (LAr) EM sampling calorimeters, and hadronic calorime-try by the three-part steel/scintillating tile barrel calorimeter plus the two copper/LAr end-caps. The EM calorimeter is segmented in the longitudi-nal and transverse directions, with fine granularity along the η direction in the first (strip) layer. The identification of electron candidates is seeded by a preliminary set of clusters in the EM calorimeter using a sliding window algorithm, with those clusters having a match to a suitable ID track being reconstructed [15]. In the transition region between the barrel and end-cap calorimeters at 1.37 < |η| < 1.52 the electron identification and energy reso-lution is degraded by the large amount of material in front of the first active layers, prompting the exclusion of this region from the electron analysis.
The MS comprises separate trigger and high-precision tracking chambers which measure the deflection of muons in a magnetic field generated by three super-conducting air-core toroids. The precision chamber system covers the region |η| < 2.7 with three layers of Monitored Drift Tube (MDT) chambers. In the forward region, 2.0 < |η| < 2.7, higher granularity Cathode Strip Chambers (CSCs) replace the first station of MDTs. The trigger chambers provide coverage within |η| < 1.05 using Resistive Plate Chambers (RPCs) and for 1.05 < |η| < 2.4 using Thin Gap Chambers (TGCs). The MDT chambers measure the coordinate in the bending plane, while the RPCs and TGCs measure the coordinate in the non-bending plane (φ) and provide a further hit in the bending plane.
Reconstruction of muon candidates begins with the reconstruction of track segments in the MS. Segment candidates formed from hits in the
pre-cision chambers are required to point loosely to the centre of ATLAS. A minimum of two track segments and one hit in each coordinate of the RPCs in the barrel and the TGCs in the end-caps are required to build an MS track. For |η| < 2.5 the track parameters are then back-extrapolated to the IP and matched to all tracks in the ID having hits in at least two ID sub-detectors. The ID track that best matches the MS track is retained, and the track pa-rameters are computed by the statistical combination of back-extrapolated MS parameters and ID track parameters, the resulting track being referred to as a combined muon in the following.
4. Data and simulated samples used
The analysis is based on a data sample collected at √s = 7 TeV during April-August 2010. Requirements were made on the detector conditions (no-tably the ID plus either the EM calorimeter or the MS) and data quality, yielding total integrated luminosities of 1.28 ±0.04 pb−1
and 1.42 ±0.05 pb−1
for the electron and muon analyses, respectively, the integrated luminosity being measured with an uncertainty of 3.4% [16].
For the electron analysis events were selected using the hardware-based first-level (L1) calorimeter trigger, which identifies EM clusters within |η| < 2.5 above a given energy threshold. The data were recorded under four dif-ferent trigger conditions, with a progressively higher minimum cluster trans-verse energy requirement applied as the instantaneous luminosity of the LHC increased. The bulk of the integrated luminosity (76%) was obtained with the L1 calorimeter trigger configured with an energy threshold of approxi-mately 15 GeV, with the remaining 14%, 9% and 1% recorded with 11, 6 and 3 GeV thresholds, respectively. The integrated luminosity available for the electron analysis is limited to these early data, since the Higher Level Trigger algorithms used in later periods of higher instantaneous luminosity are designed to be efficient only for isolated electrons.
In the muon channel, events were selected by one of two L1 muon triggers. The first 3.5% of the data were recorded under the loosest requirement of at least three trigger hits in time coincidence with the collision (referred to as the lower threshold trigger), while the remaining data were obtained with the further requirement that the hit pattern be compatible with a track with pT > 10 GeV. In the subsequent analysis it is required for muons with pT less
than 16 GeV to be triggered by the lower threshold trigger, while the 10 GeV trigger is required for muons with pT in the range 16-100 GeV.
Simulated data samples have been generated in order to estimate back-grounds and correct for the trigger and reconstruction efficiencies and the resolution of the detector. PYTHIA 6.421 was used to simulate samples of electrons and muons from heavy-flavour and W /Z/γ∗
decays. PYTHIA was also used to simulate all sources of background electrons and muons. Further samples of electrons from heavy-flavour decays were also gener-ated with POWHEG-hvq v1.0 patch 4, interfaced to either PYTHIA or HERWIG v6.510 [17]. In conjunction with HERWIG, JIMMY v4.31 [18] was used to model the underlying event. The POWHEG samples use PHOTOS v2.15 [19] to model final state QED radiation. The PDF set used was MRST LO* [20] for the PYTHIA samples and CTEQ6.6 [21] for the POWHEG samples. All signal and background samples were generated at √s = 7 TeV using the ATLAS MC09 tune [22], and passed through the GEANT4 [23] simulation of the ATLAS detector.
5. Electron analysis
5.1. Electron candidate selection
Events from pp collisions are selected by requiring a collision vertex with more than two associated tracks. From these events, reconstructed electron candidates are required to pass a minimum cluster ET cut between 7 and
18 GeV depending on the trigger condition, to lie within the pseudorapidity coverage of the TRT, |η| < 2.0, and to be outside the transition region between the barrel and end-cap calorimeters, 1.37 < |η| < 1.52. Candidate clusters with their energy-weighted centre close to problematic regions in the EM calorimeter are rejected, as are those with tracks passing through dead B-layer modules: the corresponding loss of acceptance varied by run period but amounted to no more than 7% and 3%, respectively.
Preselected candidates must be associated to tracks containing at least ten TRT and four silicon hits and are required to pass a minimum require-ment on the fraction of the raw energy deposited in the strip layer of the EM calorimeter. Candidate electrons are then selected from those passing the preselection by imposing further identification criteria [15] designed to suppress electron-like (fake) signatures from hadrons. These identification criteria comprise ET and |η| dependent cuts on the energy deposits in the
strip and middle layers of the EM calorimeter as well as on the track quality and track-cluster matching.
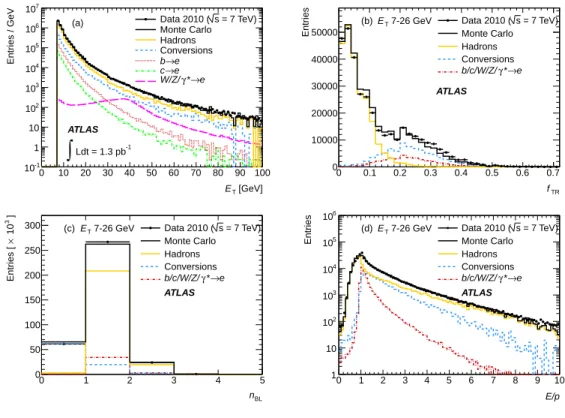
The cluster transverse energy spectrum for the selected electron candi-dates in the data and simulation is shown in Fig. 1(a), in which data with ET < 18 GeV have been rescaled to 1.3 pb
−1
from lower integrated lumi-nosities. The discontinuities in the spectrum at 10, 20 and 30 GeV corre-spond to boundaries in the ET-dependent identification cuts, which mainly
affect the yield of hadronic fakes. The candidates in the simulation are sub-divided according to their dominant origins, which for ET < 26 GeV are
non-isolated signal electrons from semi-leptonic decays of charm and beauty hadrons (∼10%), a background of secondary electrons, largely dominated by electrons from photon conversions (∼20%) and the dominant background of misidentified hadronic fakes. The fraction of isolated signal electrons from W /Z/γ∗
production is also shown. For ET > 26 GeV this contribution
starts to become significant, with the efficiency of the identification cuts be-ing higher for these isolated electrons, motivatbe-ing the choice of the restricted 7-26 GeV analysis region.
The signal purity could be improved through the application of further cuts on the fraction, fTR, of high-threshold (transition radiation) TRT hits
out of all TRT hits measured on the track, the number of hits in the pixel B-layer, nBL and the ratio of the measured energy of the EM cluster to the
track momentum, E/p. These variables offer excellent discriminating power against the hadronic fake (fTR) and photon conversion (nBL) backgrounds,
as illustrated in Fig. 1(b-d). Applying tighter cuts on these variables would increase the signal fraction to 50% in the range 7 < ET < 26 GeV but leave no
means of estimating the remaining background fraction from data. The cuts are therefore not applied, permitting the full distributions of the variables to be used in the fitting procedure described in Section 5.3.
5.2. Electron trigger efficiency measurement
The efficiency with which the signal electrons pass the L1 EM trigger is measured from the data in bins of cluster ET. For the 3 and 6 GeV threshold
triggers, the efficiencies are measured using events selected by an alternative, very inclusive minimum bias trigger, based on hit information in the Min-imum Bias Trigger Scintillator [24]. The efficiencies of the 11 and 15 GeV triggers are measured using events recorded by the 6 GeV trigger, which is fully efficient in the ET region for which the higher threshold triggers are
used. Since these data-derived measurements are performed on the selected electron candidates, dominated by the hadronic background, a systematic uncertainty is estimated by comparing the measured trigger efficiencies to
[GeV] T E 0 10 20 30 40 50 60 70 80 90 100 Entries / GeV -1 10 1 10 2 10 3 10 4 10 5 10 6 10 7 10 -1 Ldt = 1.3 pb
∫
= 7 TeV) s Data 2010 ( Monte Carlo Hadrons Conversions e → b e → c e → * γ W/Z/ ATLAS (a) TR f 0 0.1 0.2 0.3 0.4 0.5 0.6 0.7 Entries 0 10000 20000 30000 40000 50000 7-26 GeV T E Data 2010 (s = 7 TeV) Monte Carlo Hadrons Conversions e → * γ b/c/W/Z/ (b) ATLAS BL n 0 1 2 3 4 5 3 10 × Entries [ ] 0 50 100 150 200 250 300 7-26 GeV T E (c) Data 2010 (s = 7 TeV) Monte Carlo Hadrons Conversions e → * γ b/c/W/Z/ ATLAS E/p 0 1 2 3 4 5 6 7 8 9 10 Entries 1 10 2 10 3 10 4 10 5 10 6 10 7-26 GeV T E (d) Data 2010 (s = 7 TeV) Monte Carlo Hadrons Conversions e → * γ b/c/W/Z/ ATLASFigure 1: (a) Distribution of cluster transverse energy, ET, for the electron
candi-dates. The simulation uses PYTHIA with the W and Z/γ∗
components normalised to their NNLO total cross-sections and the heavy-flavour, conversion and hadronic components then normalised to the total expectation from the data. (b-d) PYTHIA simulations of the distributions of discriminating variables used to extract the
elec-tron heavy-flavour plus W /Z/γ∗
signal compared to data: (b) the ratio, fTR,
be-tween the number of high-threshold hits and all TRT hits on the electron track;
(c) the number of hits, nBL, on the electron track in the pixel B-layer; (d) the
ratio, E/p, between cluster energy and track momentum.
those expected in the simulation for heavy-flavour electrons. The trigger ef-ficiencies are measured to be between 92.1% and 100.0%, with a maximum uncertainty of 1.8%.
5.3. Electron signal extraction
In order to extract the heavy-flavour plus W /Z/γ∗
signal electrons from the selected candidates, a binned maximum likelihood method is used, based
on the distributions of fTR, nBL and E/p. From simulation, a twelve-bin
three-dimensional probability density function (pdf) in these variables is constructed for the signal and conversion components. For the hadronic background, the shapes of the three template distributions are described by additional free parameters (as in [25]) and are fitted to the data: in doing so, the method assumes no correlations exist between the three discriminating variables in the hadronic component. The likelihood fit is performed in bins of η (on which the discriminating distributions depend) and in ET in the
range 7-26 GeV, allowing the fraction of signal, conversion and hadronic fake candidates to be found in each ET bin.
The systematic uncertainty on the number of extracted signal electrons arising from the differences between the data and simulation in the discrimi-nating variables for the signal and conversion components is estimated to be less than 4%, evaluated by repeating the signal extraction with the signal and conversion templates adjusted within their systematic uncertainties. For fTR
and E/p, which have the largest effect, the differences were evaluated by com-paring the distributions in data and simulation for a pure sample of photon conversions, selected by imposing the additional requirements of nBL = 0 and
either E/p > 0.8 or fTR> 0.1, respectively. The impact of the finite
statis-tics of the simulated samples (< 2.5%) and any possible bias in the method (7.3%) arising from the assumption that the template distributions for the hadron background are uncorrelated were studied using pseudo-experiment techniques. The uncertainty associated with the electron energy scale (3.5%) has been assessed by varying the electron candidate cluster energy by 1% for |η| < 1.4 and by 3% for |η| > 1.4, these systematic effects having been eval-uated from Z → e+e−
events. Overall a statistical (systematic) uncertainty on the extracted signal component of approximately 3 (9) % is obtained. 5.4. Determination of the electron efficiency and migration correction
The overall efficiency and migration correction factor, ǫ(reco+PID)i/Cmigrationi, is determined from PYTHIA-simulated samples of heavy-flavour decays to elec-trons and varies between 0.6 and 0.7 as a function of the true electron pT.
Efficiencies of individual cuts were cross-checked on data control samples where possible, and a systematic uncertainty of 5-10% is estimated by re-calculating ǫ(reco+PID)i /Cmigrationi from simulated samples produced with an increase in the amount of material inside the EM calorimeter, corresponding to the estimated uncertainty on the material budget (see [26] and references
therein). The statistical uncertainty on ǫ(reco+PID)i/Cmigrationi is found to be between 0.4 and 3.5%.
Additionally, the efficiency of the electron identification cuts in the simu-lation is compared with a measurement made on data using a tag-and-probe (T&P) technique. The probe candidates, which must pass only the preselec-tion cuts of Secpreselec-tion 5.1, are taken from a sample of events enriched in heavy quark pair production where both heavy hadrons decay semi-leptonically. To select such events, the tag electron candidate is subject to more strin-gent identification cuts than those described in 5.1, including requirements on fTRand nBL, and the T&P candidate pair must have opposite charge and
an invariant mass below the Z mass window and outside of the J/ψ mass re-gion. The signal purity remains low after the T&P selection, being 9 (31) % for probe candidates before (after) applying the identification criteria. The signal component of the probe candidates before and after the identification cuts must therefore be extracted with a method similar to that described in Section 5.3. By comparing the measured identification efficiency of the ex-tracted probe electrons to that expected in simulation as a function of ET, an
uncertainty of 5% is obtained on the identification efficiency, with a further 7% systematic uncertainty coming from the T&P method itself.
Overall the uncertainty on ǫ(reco+PID)i/Cmigrationi is found to be 12-14%, depending on the true electron pT. Possible effects of the choice of
heavy-flavour hadron decay model and the prompt J/ψ contamination are found to be negligible.
5.5. Electron production cross-section result
The differential cross-section for electrons from heavy-flavour production is found from Eqn. 1 using a bin-by-bin unfolding method. Before apply-ing the efficiency and migration correction factor, ǫ(reco+PID)i/Cmigrationi, the theoretical prediction for the accepted electron cross-section from W /Z/γ∗
decays, σacceptedW/Z/γ∗, must first be subtracted.2 σW/Z/γ∗
accepted is obtained from PYTHIA,
with the high-mass W /Z contribution normalised to the NNLO total cross-section [27, 28]
The differential cross-section for electrons from heavy-flavour production within |η| < 2.0 (excluding 1.37 < |η| < 1.52) and 7 < pT < 26 GeV is plotted
2The uncertainty on the heavy flavour cross-section arising from the overall uncertainty
on σacceptedW/Z/γ∗ is negligible, reaching at most 1% in the highest pT bin where the W /Z/γ∗
in Fig. 4 (left) and reported in Table 3. The statistical uncertainty originates from the signal extraction procedure (Section 5.3), and the sources of system-atic uncertainty, as discussed in the preceding sub-sections, are summarised in Table 1. Correlations between the systematic uncertainties common to the signal extraction and the T&P efficiency measurement, such as discrep-ancies between the data and simulation in the signal and conversion pdfs and the energy scale uncertainty, are taken into account in the evaluation of the overall systematic uncertainty on the cross-section. To account for possible biases due to the pT distribution of the signal, the predictions of simulated
heavy-flavour samples from different programs (PYTHIA, POWHEG+PYTHIA and POWHEG+HERWIG) are compared and found to yield consistent results.
We obtain a fiducial heavy-flavour electron cross-section in the range 7 < pT < 26 GeV and within |η| < 2.0, excluding 1.37 < |η| < 1.52, of
σeHF= 0.946 ± 0.020(stat.) ± 0.146(syst.) ± 0.032(lumi.) µb.
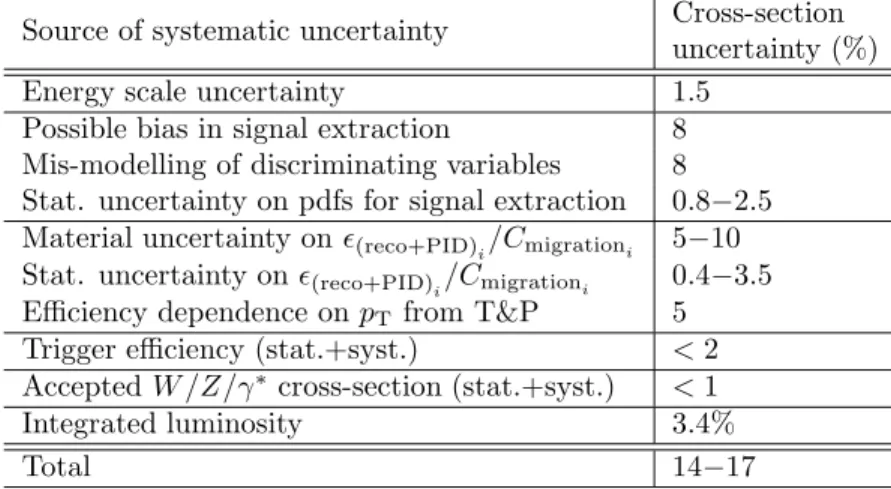
Table 1: Summary of systematic uncertainties on the electron heavy-flavour
cross-section. The uncertainties apply in the pT bins of the measurement; an interval or
upper limit is given where the uncertainty varies as a function of pT. Correlations
between the systematic uncertainties reported independently for the signal extrac-tion and the T&P efficiency measurement in Secextrac-tions 5.3 and 5.4 are taken into account.
Source of systematic uncertainty Cross-section
uncertainty (%)
Energy scale uncertainty 1.5
Possible bias in signal extraction 8
Mis-modelling of discriminating variables 8
Stat. uncertainty on pdfs for signal extraction 0.8−2.5 Material uncertainty on ǫ(reco+PID)i/Cmigrationi 5−10 Stat. uncertainty on ǫ(reco+PID)i/Cmigrationi 0.4−3.5
Efficiency dependence on pTfrom T&P 5
Trigger efficiency (stat.+syst.) < 2
Accepted W /Z/γ∗ cross-section (stat.+syst.) < 1
Integrated luminosity 3.4%
6. Muon analysis
6.1. Muon candidate selection
Muon candidates within a pseudorapidity of |η| < 2.5 are selected if they have at least two MDT segments and an ID track with hits in two different sub-detectors. In addition to signal muons from charm, beauty and W /Z/γ∗
decays, the selected candidates comprise a significant fraction of background muons from pion and kaon decays in flight (π/K) and misidentified muons from hadronic showers in the calorimeter that reach the MS and are wrongly matched to a reconstructed ID track (fakes). The π/K background is subdi-vided into those that decay close enough to the IP such that the majority of hits on the ID track come from the decay muon (early-π/K) and those that do not (late-π/K). The signal purity of the sample, determined using the method discussed in Section 6.4, ranges from 45% at pT= 4 GeV to 90% at
40 GeV in the region of the W /Z Jacobian peak. 6.2. Muon trigger efficiency measurement
The trigger efficiency for the muon candidates is evaluated using events recorded by an independent trigger based on calorimeter information alone. The efficiency for the lower threshold trigger is found to be 68% at pT = 4
GeV and to reach a plateau of 84% at 9 GeV. The 10 GeV threshold trigger efficiency is constant for pT > 16 GeV with a value of 74%. (The muon
trigger efficiency is dominated by the limited acceptance of the muon trigger chambers). The data samples used to compute the efficiency contain back-ground muons. In order to obtain the efficiencies for signal muons, correction factors of 1.04 for the low threshold trigger and 1.08 for the 10 GeV trigger are estimated from simulation. Systematic uncertainties on these correction factors come from the simulation statistics (0.5% and 0.7% for the lower threshold and 10 GeV triggers, respectively) and from the mis-modelling of the signal fraction by the simulation (0.7% and 0.2% for the two triggers), the latter being assessed by reweighting the simulated sample according to the measured signal fraction. Other sources of systematic uncertainty arise from the statistical fluctuations in the independent trigger sample (from 0.4% to 0.9% for the low threshold trigger, and 0.5% for the 10 GeV trigger) and from the bias introduced by the independent trigger (evaluated to be 2.3% for the 10 GeV trigger by comparing to events triggered by the low threshold trigger).
6.3. Muon reconstruction efficiency measurement
The combined muon reconstruction efficiency has three components: the ID efficiency (ǫID), the MS efficiency (ǫMS) and the matching efficiency (ǫMatch).
The overall efficiency has been determined from high-statistics simulated muon samples from heavy-flavour hadron and W /Z/γ∗
decays, with correc-tion factors for each component of the reconstruccorrec-tion, αx = ǫdatax /ǫsimulationx
(x = ID, MS, Match), being determined by comparing the simulation-derived efficiencies with those observed in data. The overall reconstruction efficiency is found to be 85% at pT = 4 GeV, reaching 95% at 7 GeV. The plateau
value of 95% is the same for both isolated and non-isolated muons.
The ID correction factor αID is evaluated with a T&P method on J/ψ
and Z events, using a combined muon track as a tag and an MS track as a probe. The fraction of ID tracks found over the number of probes has been computed and compared to the expectation in simulation, giving a value of αID = 1.000 ± 0.005, where the quoted uncertainty includes both the
statistical and systematic contributions.
The product αMS·αMatch is obtained with two methods. The first method
identifies single muon tracks in jets from energy deposits corresponding to minimum-ionising particles in calorimeter cells matched to extrapolated ID tracks. In order to reject the background from pions and kaons from the primary vertex, a cut on the impact parameter (d) to the primary vertex in the transverse plane is applied: |d/σd| > 3, where σd is the error on d
from the tracking algorithm. According to simulation this cut selects muons from beauty decays with a purity of 99%. The factor ǫdata
MS · ǫdataMatch is then
computed by evaluating the fraction of these tracks that are reconstructed in the MS and matched to the ID track. The second method identifies muons by matching ID tracks with hits in the MS trigger chambers. The trigger bias of this method has been evaluated with simulated data to be 2% for pT < 6 GeV and less than 0.2% at higher momenta. Overall a value of
αMS·αMatch = 0.986±0.003(stat.)±0.010(syst.) is obtained, the central value
being the average of the results from the two methods and the systematic uncertainty coming from the difference between the two. Both methods are sensitive up to pT = 30 GeV, in the region where the control sample is
dominated by the non-isolated muons. To take into account isolated muons and muons with pT > 30 GeV, the result has been compared with αMS·αMatch
computed from two other T&P techniques, using muons from J/ψ [29] and Z [30] decays. The T&P technique used here is the same as that used in the determination of ǫID but with the probe muon selected among the ID tracks,
and a full combined track being required in the numerator. The αMS· αMatch
scale factors obtained with the T&P methods are fully compatible with those obtained using the single muon track methods.
Overall the systematic uncertainty on the muon reconstruction efficiency is dominated by the uncertainties on the scale factors reported above and evaluates to 1.2%.
6.4. Muon signal extraction
The muon reconstruction provides independent information on the pT
of the track reconstructed in the ID and in the MS. The difference in pT,
∆pT = pIDT − pMST , where both momenta are extrapolated to the IP, is
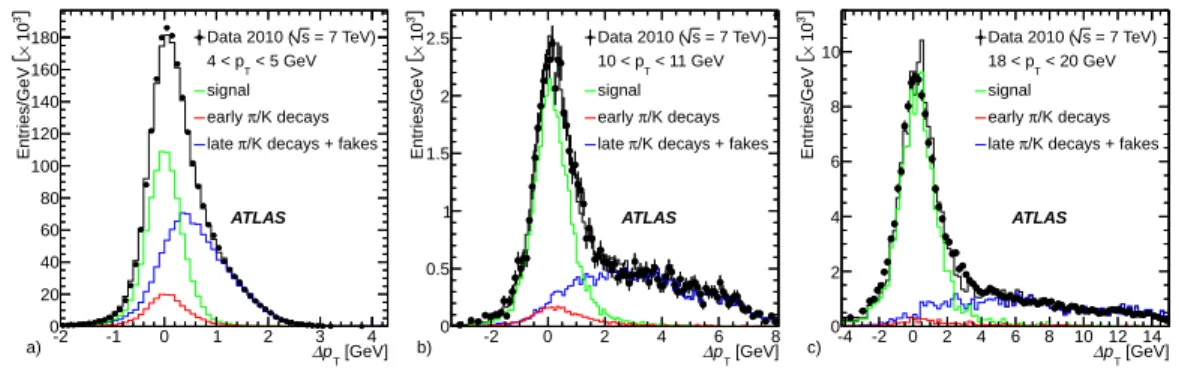
sen-sitive to the origin of the muons: signal, early-π/K, and late-π/K or fakes, as illustrated in Fig. 2 for three pT intervals. A fit to the data
distribu-tion is performed to extract the signal component using templates from the simulation. The early-π/K component template, like the signal, has a ∆pT
distribution peaked around zero, since the pT reconstructed in the ID for a
π/K that decays close to the IP is dominated by hits from the decay muon. The late-π/K component and the fake component may be described by a single template with a broader ∆pT distribution shifted towards higher
val-ues. Since the early-π/K component is significant only for pT < 10 GeV
and cannot be strongly discriminated from the signal, we fix the ratio of the early-π/K component to the late-π/K plus fakes component to its ex-pectation in the simulation and use only a single background template in the fit. A systematic uncertainty is assigned to cover the possible difference in the (early-π/K)/(late-π/K+fakes) ratio between data and simulation as explained below.
The fit is performed in pT bins over the whole range. For pT < 52 GeV
the template distributions are taken from a PYTHIA dijet sample with ˆpT >
15 GeV (where ˆpT is the pT of the primary parton) with the additional
requirement that at least one set of particles crossed a surface of ∆η × ∆φ = 0.12 ×0.12 with a total energy greater than 17 GeV. For pT > 52 GeV a dijet
sample with ˆpT > 280 GeV is used.
The systematic uncertainty on the extracted signal fraction arising from the difference in the ∆pT distributions between the simulated template
sam-ples and the expected data distributions is evaluated on simulated samsam-ples of QCD jets (light and heavy-flavour) and W /Z inclusive events that reproduce the expected composition of data. The maximum possible bias is found to be 3%. The effect of any mis-modelling of the background ∆pT template
is also checked by comparing the extracted signal fraction to that obtained when using a background template taken from a simulated sample whose pT spectrum is weighted to reproduce the spectrum observed in data before
the signal extraction. A difference of 1.5% is found, within the bias men-tionned above. Therefore we quote an overall 3% systematic uncertainty for the template modelisation. The systematic uncertainty on the signal frac-tion due to the finite statistics of the simulated samples used for the template distributions is found to be between 1% and 8%.
The accuracy of the assumption that the ratio of the early-π/K com-ponent to the combined late-π/K plus fakes comcom-ponent, r, is reproduced correctly by the simulation is tested by comparing the ∆pT distributions in
data and simulation as a function of the early-π/K fraction. A correction factor rdata/rsimulation is determined as 1.1 ± 0.1. This 10% uncertainty on r
corresponds to an uncertainty on the signal of 2% at pT = 4 GeV, rapidly
falling to zero for pT > 10 GeV.
[GeV] T p ∆ -2 -1 0 1 2 3 4 3 10 × Entries/GeV 0 20 40 60 80 100 120 140 160 180 Data 2010 (s = 7 TeV) < 5 GeV T 4 < p signal /K decays π early /K decays + fakes π late a) ATLAS [GeV] T p ∆ -2 0 2 4 6 8 3 10 × Entries/GeV 0 0.5 1 1.5 2 2.5 Data 2010 (s = 7 TeV) < 11 GeV T 10 < p signal /K decays π early /K decays + fakes π late ATLAS b) [GeV] T p ∆ -4 -2 0 2 4 6 8 10 12 14 3 10 × Entries/GeV 0 2 4 6 8
10 Data 2010 ( < 20 GeV s = 7 TeV)
T 18 < p signal /K decays π early /K decays + fakes π late ATLAS c)
Figure 2: The ∆pT distribution in the pT bins 4-5 GeV (a), 10-11 GeV (b) and
18-20 GeV (c) for muon combined track candidates. The signal, early-π/K and late-π/K plus fakes components from simulation are shown. The early-π/Ks are defined as those that decay close enough to the IP that the majority of hits on the ID track come from the decay muon.
6.5. Muon resolution and unfolding
The muon momentum resolution has been studied using tracks from the decays Z → µ+µ−
and J/ψ → µ+µ−
. With an iterative procedure, the sim-ulated muon track momenta are smeared and scaled as a function of pseudo-rapidity to reproduce the J/ψ and the Z invariant mass shapes measured in
[GeV] T p 10 20 30 40 50 60 70 80 90 100 b/GeV] µ [ T /dp σ d -7 10 -6 10 -5 10 -4 10 -3 10 -2 10 -1 10 1 -1 L dt = 1.4 pb
∫
ATLAS Data 2010 (bb+cc - FONLLs = 7 TeV)
- MC@NLO ν µ → W - MC@NLO µ µ → Z
Drell Yan - PYTHIA - PYTHIA ν τ → W - PYTHIA τ τ → Z - PYTHIA t t
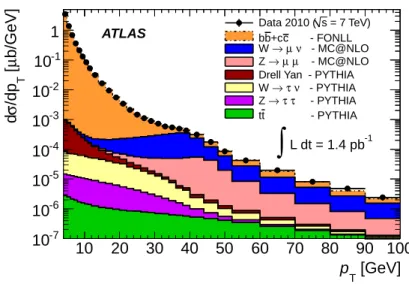
Figure 3: Muon differential cross-section as a function of the muon transverse
momentum for |η| < 2.5 compared to theoretical predictions. The Drell-Yan
com-ponent corresponds to the Z/γ∗
for Mµ+µ−< 60 GeV.
data [31]. A full set of smearing parameters for the MS and ID are obtained, and the corresponding effect on the combined muon derived. The corrected sample is used to obtain the unfolding coefficients Cmigrationi in Eqn. 1. The uncertainty on the unfolding coefficients is determined by varying indepen-dently the cross-section values of the heavy-flavour and W /Z components by 30% and 10% respectively. The associated systematic uncertainty is at the level of 0.1% over almost the whole spectrum with a maximum value of 1.2% around the W/Z Jacobian peak.
6.6. Muon production cross-section result
The signal fraction of the muon transverse momentum spectrum has been corrected for the trigger and reconstruction efficiencies and unfolded from the detector response. Figure 3 shows the resulting inclusive muon differential cross-section for muons within |η| < 2.5 as a function of pT, compared to the
overall theoretical expectation. The expected W /Z component comes from MC@NLO [32, 33] using the CTEQ6.6 PDFs, normalised to the cross-sections
for muons measured by ATLAS [28]3. The FONLL prediction is used for
the heavy-flavour component and the remaining, small contributions are ob-tained from PYTHIA simulation. The theoretical uncertainty is dominated by the heavy-flavour prediction, being approximately 20% and discussed in Section 7, and is not shown in the figure. The systematic uncertainties on the measurement are summarised in Table 2.
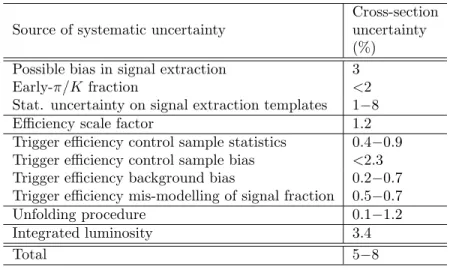
Table 2: Summary of systematic uncertainties on the muon cross-section
measure-ment. The uncertainties apply in the pT bins of the measurement; an interval or
upper limit is given where the uncertainty varies as a function of pT.
Cross-section
Source of systematic uncertainty uncertainty
(%)
Possible bias in signal extraction 3
Early-π/K fraction <2
Stat. uncertainty on signal extraction templates 1−8
Efficiency scale factor 1.2
Trigger efficiency control sample statistics 0.4−0.9
Trigger efficiency control sample bias <2.3
Trigger efficiency background bias 0.2−0.7
Trigger efficiency mis-modelling of signal fraction 0.5−0.7
Unfolding procedure 0.1−1.2
Integrated luminosity 3.4
Total 5−8
Integrating over the full 4-100 GeV pT range, in |η| < 2.5, we find a
fiducial cross-section for inclusive muons of
σµInc.= 6.55 ± 0.01(stat.) ± 0.37(syst.) ± 0.22(lumi.) µb.
In order to compare to the results of the electron analysis, the muon cross-section has been studied in the same acceptance region (7 < pT < 26 GeV
and |η| < 2.0, excluding 1.37 < |η| < 1.52) and with the subtraction of the
3σµ
W+ = 6.21 ± 0.02(stat.) ± 0.25(syst.) nb, σ µ
W− = 4.107 ± 0.02(stat.) ± 0.19(syst.) nb, σµZ = 0.941 ± 0.008(stat.) ± 0.038(syst.) nb, where the systematic uncertainty excludes contributions from the luminosity and acceptance which are fully correlated with those presented here.
W /Z/γ∗
contribution, giving a fiducial heavy-flavour muon cross-section of σµHF= 0.818 ± 0.003(stat.) ± 0.036(syst.) ± 0.028(lumi.) µb.
7. Comparison of electron and muon cross-sections with theoretical predictions for heavy-flavour production
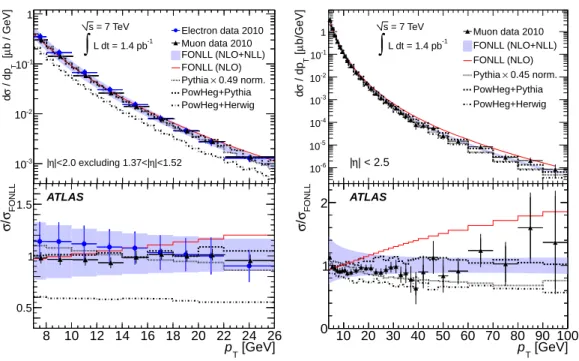
The results for both channels within the acceptance of the electron anal-ysis (7 < pT < 26 GeV, |η| < 2.0 excluding 1.37 < |η| < 1.52) are shown
in Fig. 4 (left) and summarised in Table 3. Additionally, the measured muon cross-section is given over the full pT (4-100 GeV) and pseudorapidity
(|η| < 2.5) range in Fig. 4 (right) and Table 4.4
In the electron analysis the W /Z/γ∗
contribution has been subtracted as described in Section 5.5 in order to obtain the heavy-flavour differen-tial cross-section; whereas, in the muon case the subtraction is made at the cross-section level from the fully inclusive measurement. The systematic uncertainties on the electron and muon results are independent except for that arising from the uncertainty on the total luminosity. In the common acceptance region, the two measurements are in good agreement with each other.
The measured heavy-flavour cross-sections are compared to the FONLL calculations, with a rigorous evaluation of the associated uncertainty shown as a band in Fig. 4. The theoretical uncertainties originate from several different sources. The dominant contribution comes from the renormalisa-tion and factorisarenormalisa-tion scales (up to 35% at low pT).5 The uncertainty on
the heavy quark masses contributes up to 9% at low pT6, and the
PDF-related uncertainty (taken from the CTEQ6.6 error set) is below 8% over the whole pT range. Uncertainties arising from the value of αs and on the
non-perturbative fragmentation function are found to be small, approximately 1% and less than 5% [9] respectively. The total uncertainty, dominated by
4The results as shown in Tables 3 and 4 are available in the HEPDATA database [34] and a Rivet [35] routine is provided.
5The renormalisation (µ
R) and factorisation (µF) scales are defined as µR,F = ξR,F
q p2
T+ m2Q. The central value is computed using ξR,F = 1 while the scale uncer-tainty is determined by changing the scales independently within 0.5 < ξR,F < 2.0 while keeping the ratio 0.5 < ξR/ξF< 2.0.
6The heavy quark masses are set to m
b / GeV] µ [ T / dp σ d -3 10 -2 10 -1 10 1 = 7 TeV s -1 L dt = 1.4 pb
∫
|<1.52 η |<2.0 excluding 1.37<| η | Electron data 2010 Muon data 2010 FONLL (NLO+NLL) FONLL (NLO) 0.49 norm. × Pythia PowHeg+Pythia PowHeg+Herwig [GeV] T p 8 10 12 14 16 18 20 22 24 26 FONLL σ / σ 0.5 1 1.5 ATLAS b/GeV] µ [ T / dp σ d -6 10 -5 10 -4 10 -3 10 -2 10 -1 10 1 s = 7 TeV -1 L dt = 1.4 pb∫
| < 2.5 η | Muon data 2010 FONLL (NLO+NLL) FONLL (NLO) 0.45 norm. × Pythia PowHeg+Pythia PowHeg+Herwig [GeV] T p 10 20 30 40 50 60 70 80 90 100 FONLL σ / σ 0 1 2 ATLASFigure 4: (Left) Electron and muon differential cross-sections from heavy-flavour production as a function of the charged lepton transverse momentum for |η| < 2.0 excluding the 1.37 < |η| < 1.52 region. (Right) Muon differential cross-section as a function of the muon transverse momentum for |η| < 2.5. The data points include statistical and systematic uncertainties. The ratio of the measured cross-section and the other predicted cross-sections to the FONLL calculation is given in the bottom of each plot. The PYTHIA (L0) cross-sections are normalised to the data in order to compare the shape of the spectra.
the renormalisation and factorisation scales, is in the approximate range 20-40%, decreasing with pT. The electron and muon results are seen to be fully
compatible with the overall FONLL uncertainty bands.
The results are also compared to the NLO predictions of the POWHEG program, interfaced to either PYTHIA or HERWIG for the parton shower sim-ulation, and to the LO plus parton shower predictions of PYTHIA. Whereas POWHEG+PYTHIA agrees well with the FONLL predictions, POWHEG+HERWIG predicts a significantly lower total cross-section. Less than half of this differ-ence may be accounted for by the different heavy-flavour hadron decay mod-els, checked by implementing a common decay simulation, EVTGEN [36], for both showering and hadronisation programs. PYTHIA (LO) describes the pT
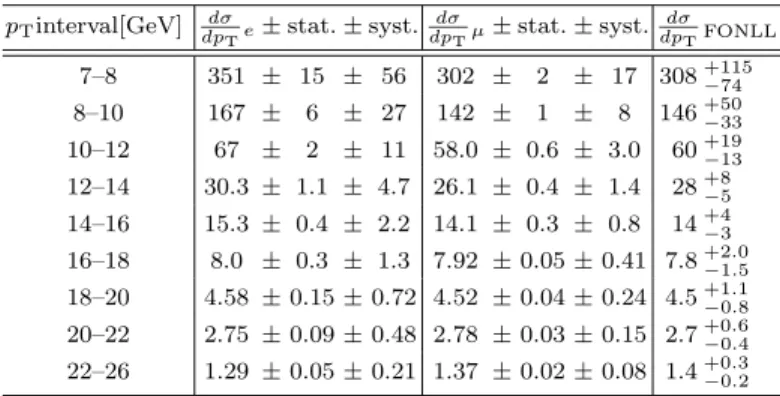
-Table 3: Differential cross-sections dσ/dpTe(µ) (in nb/GeV) for electron (muon) heavy-flavour production in the pseudorapidity region |η| < 2.0 (excluding 1.37 < |η| < 1.52), with statistical (stat.) and systematic (syst.) uncertainties. The 3.4% luminosity uncertainty is included in the latter. The predictions of FONLL are also given. pTinterval[GeV] dpdσ Te ±stat. ± syst. dσ dpTµ ±stat. ± syst. dσ dpTFONLL 7–8 351 ± 15 ± 56 302 ± 2 ± 17 308+115 −74 8–10 167 ± 6 ± 27 142 ± 1 ± 8 146+50 −33 10–12 67 ± 2 ± 11 58.0 ± 0.6 ± 3.0 60+19 −13 12–14 30.3 ± 1.1 ± 4.7 26.1 ± 0.4 ± 1.4 28+8−5 14–16 15.3 ± 0.4 ± 2.2 14.1 ± 0.3 ± 0.8 14+4 −3 16–18 8.0 ± 0.3 ± 1.3 7.92 ± 0.05 ± 0.41 7.8+2.0−1.5 18–20 4.58 ± 0.15 ± 0.72 4.52 ± 0.04 ± 0.24 4.5+1.1 −0.8 20–22 2.75 ± 0.09 ± 0.48 2.78 ± 0.03 ± 0.15 2.7+0.6−0.4 22–26 1.29 ± 0.05 ± 0.21 1.37 ± 0.02 ± 0.08 1.4+0.3−0.2
dependence well but predicts approximately a factor two higher total cross-section.
Comparisons are also made to the NLO central value expectation obtained from the FONLL program by excluding the NLL resummation part of the pQCD calculation. As shown in Fig. 4 (right), the data deviate significantly from the NLO prediction, showing sensitivity to the NLL resummation term in the pQCD calculation for the first time in heavy-flavor production at hadron colliders.
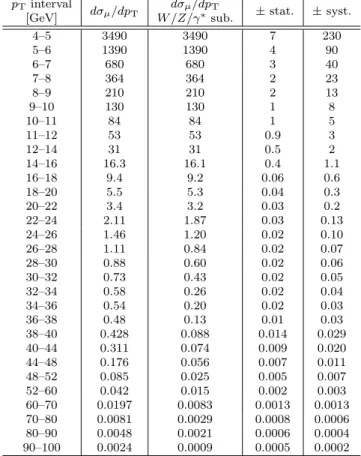
Table 4: Differential cross-sections dσµ/dpT (in nb/GeV) in the pseudorapidity
region |η| < 2.5, before and after subtraction of the W /Z/γ∗
component, with statistical (stat.) and systematic (syst.) uncertainties. The 3.4% luminosity
un-certainty is included in the latter. The unun-certainty on the W /Z/γ∗
component is not included and amounts to 4% of the subtraction, increasing the systematic error
by 5–10 % for pT> 32 GeV. pTinterval dσ µ/dpT dσµ/dpT ±stat. ±syst. [GeV] W /Z/γ∗sub. 4–5 3490 3490 7 230 5–6 1390 1390 4 90 6–7 680 680 3 40 7–8 364 364 2 23 8–9 210 210 2 13 9–10 130 130 1 8 10–11 84 84 1 5 11–12 53 53 0.9 3 12–14 31 31 0.5 2 14–16 16.3 16.1 0.4 1.1 16–18 9.4 9.2 0.06 0.6 18–20 5.5 5.3 0.04 0.3 20–22 3.4 3.2 0.03 0.2 22–24 2.11 1.87 0.03 0.13 24–26 1.46 1.20 0.02 0.10 26–28 1.11 0.84 0.02 0.07 28–30 0.88 0.60 0.02 0.06 30–32 0.73 0.43 0.02 0.05 32–34 0.58 0.26 0.02 0.04 34–36 0.54 0.20 0.02 0.03 36–38 0.48 0.13 0.01 0.03 38–40 0.428 0.088 0.014 0.029 40–44 0.311 0.074 0.009 0.020 44–48 0.176 0.056 0.007 0.011 48–52 0.085 0.025 0.005 0.007 52–60 0.042 0.015 0.002 0.003 60–70 0.0197 0.0083 0.0013 0.0013 70–80 0.0081 0.0029 0.0008 0.0006 80–90 0.0048 0.0021 0.0006 0.0004 90–100 0.0024 0.0009 0.0005 0.0002
8. Conclusions
The differential cross-sections of electrons and muons arising from heavy-flavour production have been measured and found to be in good agreement in the transverse momentum range 7 < pT < 26 GeV and pseudorapidity
region |η| < 2.0 (excluding 1.37 < |η| < 1.52). The inclusive differential cross-section of muon production has also been measured in the extended pT range 4 < pT < 100 GeV within |η| < 2.5.
The theoretical predictions for heavy-flavour production from the FONLL computation are in good agreement with the electron and muon measure-ments. Good agreement is also seen with the predictions of POWHEG+PYTHIA, although POWHEG+HERWIG predicts a significantly lower total cross-section. PYTHIA describes the pT-dependence well but predicts approximately a
fac-tor two higher total cross-section. For muons with pT > 25 GeV a deviation
from the NLO central prediction is seen, indicating sensitivity of the heavy-flavour production data to the NLL high-pT resummation terms.
9. Acknowledgments
We thank Matteo Cacciari for supplying the theoretical predictions from FONLL, within our acceptance cuts, and for many useful discussions.
We also thank CERN for the very successful operation of the LHC, as well as the support staff from our institutions without whom ATLAS could not be operated efficiently. We acknowledge the support of ANPCyT, Ar-gentina; YerPhI, Armenia; ARC, Australia; BMWF, Austria; ANAS, Azer-baijan; SSTC, Belarus; CNPq and FAPESP, Brazil; NSERC, NRC and CFI, Canada; CERN; CONICYT, Chile; CAS, MOST and NSFC, China; COL3 CIENCIAS, Colombia; MSMT CR, MPO CR and VSC CR, Czech Republic; DNRF, DNSRC and Lundbeck Foundation, Denmark; ARTEMIS, European Union; IN2P3-CNRS, CEA-DSM/IRFU, France; GNAS, Georgia; BMBF, DFG, HGF, MPG and AvH Foundation, Germany; GSRT, Greece; ISF, MINERVA, GIF, DIP and Benoziyo Center, Israel; INFN, Italy; MEXT and JSPS, Japan; CNRST, Morocco; FOM and NWO, Netherlands; RCN, Nor-way; MNiSW, Poland; GRICES and FCT, Portugal; MERYS (MECTS), Ro-mania; MES of Russia and ROSATOM, Russian Federation; JINR; MSTD, Serbia; MSSR, Slovakia; ARRS and MVZT, Slovenia; DST/NRF, South Africa; MICINN, Spain; SRC and Wallenberg Foundation, Sweden; SER, SNSF and Cantons of Bern and Geneva, Switzerland; NSC, Taiwan; TAEK,
Turkey; STFC, the Royal Society and Leverhulme Trust, United Kingdom; DOE and NSF, United States of America.
The crucial computing support from all WLCG partners is acknowledged gratefully, in particular from CERN and the ATLAS Tier-1 facilities at TRI-UMF (Canada), NDGF (Denmark, Norway, Sweden), CC3IN2P3 (France), KIT/GridKA (Germany), INFN-CNAF (Italy), NL-T1 (Netherlands), PIC (Spain), ASGC (Taiwan), RAL (UK) and BNL (USA) and in the Tier-2 facilities worldwide.
References
[1] ATLAS Collaboration, JHEP 1012 (2010) 060. [2] C. Albajar et. al., Phys. Lett. B 256 (1991) 121. [3] D0 Collaboration, Phys. Lett. B 487 (2000) 264.
[4] CDF Collaboration, Phys. Rev. Lett. 71 (1993) 2396–2400. [5] CDF Collaboration, Phys. Rev. Lett. 71 (1993) 500–504. [6] D. Acosta et. al., Phys. Rev. D71 (2005) 032001.
[7] M. Cacciari, P. Nason, Phys. Rev. Lett. 89 (2002) 122003. [8] M. Mangano, AIP Conf. Proc. 753 (2005) 247–260.
[9] M. Cacciari, M. Greco and P. Nason, JHEP 9805 (1998) 007.
[10] M. Cacciari, S. Frixione, M. L. Mangano, P. Nason and G. Ridolfi, JHEP 0407 (2004) 033.
[11] S. Frixione, P. Nason, C. Oleari, JHEP 0711 (2007) 070.
[12] S. Alioli, P. Nason, C. Oleari and E. Re, arXiv:1002.2581, JHEP 1006 (2010) 043.
[13] T. Sjostrand, S. Mrenna and P. Skands, JHEP 05 (2006) 026. [14] ATLAS Collaboration, JINST 3 (2008) S08003.
[15] ATLAS Collaboration, ATLAS-CONF-2010-005 (2010). [16] ATLAS Collaboration, ATLAS-CONF-2011-011 (2011).
[17] G. Corcella, I.G. Knowles, G. Marchesini, S. Moretti, K. Odagiri, P. Richardson, M.H. Seymour and B.R. Webber, JHEP 0101 (2001) 010. [18] J. M. Butterworth, J.R. Forshaw and M. H. Seymour, Z. Phys. C72
(1996) 637–646.
[20] A. Sherstnev and R.S. Thorne, Eur. Phys. J. C55 (2008) 553–575. [21] J. Pumplin, D.R. Stump, J. Huston, H.L. Lai, Pavel M. Nadolsky and
W.K. Tung, JHEP 0207 (2002) 012.
[22] ATLAS Collaboration, ATL-PHYS-PUB-2010-002 (2010).
[23] GEANT4 Collaboration, Nucl. Inst. and Meth. A506 (2003) 250. [24] ATLAS Collaboration, ATLAS-CONF-2010-069 (2010).
[25] ATLAS Collaboration, ATL-PHYS-PUB-2009-077 (2009).
[26] ATLAS Collaboration, arXiv:1110:3174 [hep-ex], submitted to Eur. Phys. J. C (2011).
[27] C. Anastasiou, L. J. Dixon, K. Melnikov, and F. Petriello, Phys. Rev. D69 (2004) 094008.
[28] ATLAS Collaboration, ATLAS-CONF-2011-041 (2011). [29] ATLAS Collaboration, ATLAS-CONF-2011-021 (2011). [30] ATLAS Collaboration, ATLAS-CONF-2011-008 (2011). [31] ATLAS Collaboration, ATLAS-CONF-2011-046 (2011). [32] S. Frixione, B.R. Webber, JHEP 0206 (2002) 029.
[33] S. Frixione, B. Weber amd P. Nason, Matching nlo qcd and parton showers in heavy flavour production, JHEP 0308 (2003) 007.
[34] The Durham HepData Project, http://durpdg.dur.ac.uk. [35] A. Buckley et al., arXiv:1003.0694 [hep-ph] (2010).
The ATLAS Collaboration
G. Aad48, B. Abbott111, J. Abdallah11, A.A. Abdelalim49,
A. Abdesselam118, O. Abdinov10, B. Abi112, M. Abolins88,
H. Abramowicz153, H. Abreu115, E. Acerbi89a,89b, B.S. Acharya164a,164b,
D.L. Adams24, T.N. Addy56, J. Adelman175, M. Aderholz99, S. Adomeit98,
P. Adragna75, T. Adye129, S. Aefsky22, J.A. Aguilar-Saavedra124b,a,
M. Aharrouche81, S.P. Ahlen21, F. Ahles48, A. Ahmad148, M. Ahsan40,
G. Aielli133a,133b, T. Akdogan18a, T.P.A. ˚Akesson79, G. Akimoto155,
A.V. Akimov 94, A. Akiyama67, M.S. Alam1, M.A. Alam76, J. Albert169, S. Albrand55, M. Aleksa29, I.N. Aleksandrov65, F. Alessandria89a,
C. Alexa25a, G. Alexander153, G. Alexandre49, T. Alexopoulos9,
M. Alhroob20, M. Aliev15, G. Alimonti89a, J. Alison120, M. Aliyev10,
P.P. Allport73, S.E. Allwood-Spiers53, J. Almond82, A. Aloisio102a,102b,
R. Alon171, A. Alonso79, M.G. Alviggi102a,102b, K. Amako66, P. Amaral29,
C. Amelung22, V.V. Ammosov128, A. Amorim124a,b, G. Amor´os167,
N. Amram153, C. Anastopoulos29, N. Andari115, T. Andeen34,
C.F. Anders20, K.J. Anderson30, A. Andreazza89a,89b, V. Andrei58a,
M-L. Andrieux55, X.S. Anduaga70, A. Angerami34, F. Anghinolfi29,
N. Anjos124a, A. Annovi47, A. Antonaki8, M. Antonelli47, A. Antonov96,
J. Antos144b, F. Anulli132a, S. Aoun83, L. Aperio Bella4, R. Apolle118,c,
G. Arabidze88, I. Aracena143, Y. Arai66, A.T.H. Arce44, J.P. Archambault28,
S. Arfaoui29,d, J-F. Arguin14, E. Arik18a,∗, M. Arik18a, A.J. Armbruster87,
O. Arnaez81, C. Arnault115, A. Artamonov95, G. Artoni132a,132b,
D. Arutinov20, S. Asai155, R. Asfandiyarov172, S. Ask27, B. ˚Asman146a,146b,
L. Asquith5, K. Assamagan24, A. Astbury169, A. Astvatsatourov52,
G. Atoian175, B. Aubert4, B. Auerbach175, E. Auge115, K. Augsten127,
M. Aurousseau145a, N. Austin73, G. Avolio163, R. Avramidou9, D. Axen168, C. Ay54, G. Azuelos93,e, Y. Azuma155, M.A. Baak29, G. Baccaglioni89a,
C. Bacci134a,134b, A.M. Bach14, H. Bachacou136, K. Bachas29, G. Bachy29,
M. Backes49, M. Backhaus20, E. Badescu25a, P. Bagnaia132a,132b, S. Bahinipati2, Y. Bai32a, D.C. Bailey158, T. Bain158, J.T. Baines129,
O.K. Baker175, M.D. Baker24, S. Baker77, F. Baltasar Dos Santos Pedrosa29,
E. Banas38, P. Banerjee93, Sw. Banerjee172, D. Banfi29, A. Bangert137,
V. Bansal169, H.S. Bansil17, L. Barak171, S.P. Baranov94, A. Barashkou65,
A. Barbaro Galtieri14, T. Barber27, E.L. Barberio86, D. Barberis50a,50b,
M. Barbero20, D.Y. Bardin65, T. Barillari99, M. Barisonzi174, T. Barklow143,
G. Barone49, A.J. Barr118, F. Barreiro80, J. Barreiro Guimar˜aes da Costa57,
P. Barrillon115, R. Bartoldus143, A.E. Barton71, D. Bartsch20, V. Bartsch149,
R.L. Bates53, L. Batkova144a, J.R. Batley27, A. Battaglia16, M. Battistin29,
G. Battistoni89a, F. Bauer136, H.S. Bawa143,f, B. Beare158, T. Beau78,
P.H. Beauchemin118, R. Beccherle50a, P. Bechtle41, H.P. Beck16,
M. Beckingham48, K.H. Becks174, A.J. Beddall18c, A. Beddall18c,
S. Bedikian175, V.A. Bednyakov65, C.P. Bee83, M. Begel24,
S. Behar Harpaz152, P.K. Behera63, M. Beimforde99,
C. Belanger-Champagne85, P.J. Bell49, W.H. Bell49, G. Bella153,
L. Bellagamba19a, F. Bellina29, M. Bellomo119a, A. Belloni57,
O. Beloborodova107, K. Belotskiy96, O. Beltramello29, S. Ben Ami152,
O. Benary153, D. Benchekroun135a, C. Benchouk83, M. Bendel81,
B.H. Benedict163, N. Benekos165, Y. Benhammou153, D.P. Benjamin44,
M. Benoit115, J.R. Bensinger22, K. Benslama130, S. Bentvelsen105,
D. Berge29, E. Bergeaas Kuutmann41, N. Berger4, F. Berghaus169,
E. Berglund49, J. Beringer14, K. Bernardet83, P. Bernat77, R. Bernhard48,
C. Bernius24, T. Berry76, A. Bertin19a,19b, F. Bertinelli29,
F. Bertolucci122a,122b, M.I. Besana89a,89b, N. Besson136, S. Bethke99,
W. Bhimji45, R.M. Bianchi29, M. Bianco72a,72b, O. Biebel98, S.P. Bieniek77,
J. Biesiada14, M. Biglietti134a,134b, H. Bilokon47, M. Bindi19a,19b, S. Binet115,
A. Bingul18c, C. Bini132a,132b, C. Biscarat177, U. Bitenc48, K.M. Black21, R.E. Blair5, J.-B. Blanchard115, G. Blanchot29, T. Blazek144a, C. Blocker22,
J. Blocki38, A. Blondel49, W. Blum81, U. Blumenschein54, G.J. Bobbink105,
V.B. Bobrovnikov107, S.S. Bocchetta79, A. Bocci44, C.R. Boddy118,
M. Boehler41, J. Boek174, N. Boelaert35, S. B¨oser77, J.A. Bogaerts29,
A. Bogdanchikov107, A. Bogouch90,∗, C. Bohm146a, V. Boisvert76,
T. Bold163,g, V. Boldea25a, N.M. Bolnet136, M. Bona75, V.G. Bondarenko96,
M. Boonekamp136, G. Boorman76, C.N. Booth139, S. Bordoni78, C. Borer16,
A. Borisov128, G. Borissov71, I. Borjanovic12a, S. Borroni132a,132b, K. Bos105,
D. Boscherini19a, M. Bosman11, H. Boterenbrood105, D. Botterill129,
J. Bouchami93, J. Boudreau123, E.V. Bouhova-Thacker71,
C. Boulahouache123, C. Bourdarios115, N. Bousson83, A. Boveia30,
J. Boyd29, I.R. Boyko65, N.I. Bozhko128, I. Bozovic-Jelisavcic12b,
J. Bracinik17, A. Braem29, P. Branchini134a, G.W. Brandenburg57,
A. Brandt7, G. Brandt15, O. Brandt54, U. Bratzler156, B. Brau84,
J.E. Brau114, H.M. Braun174, B. Brelier158, J. Bremer29, R. Brenner166,
S. Bressler152, D. Breton115, D. Britton53, F.M. Brochu27, I. Brock20,
G. Brooijmans34, W.K. Brooks31b, G. Brown82, H. Brown7,
P.A. Bruckman de Renstrom38, D. Bruncko144b, R. Bruneliere48,
S. Brunet61, A. Bruni19a, G. Bruni19a, M. Bruschi19a, T. Buanes13,
F. Bucci49, J. Buchanan118, N.J. Buchanan2, P. Buchholz141,
R.M. Buckingham118, A.G. Buckley45, S.I. Buda25a, I.A. Budagov65,
B. Budick108, V. B¨uscher81, L. Bugge117, D. Buira-Clark118, O. Bulekov96,
M. Bunse42, T. Buran117, H. Burckhart29, S. Burdin73, T. Burgess13,
S. Burke129, E. Busato33, P. Bussey53, C.P. Buszello166, F. Butin29,
B. Butler143, J.M. Butler21, C.M. Buttar53, J.M. Butterworth77,
W. Buttinger27, T. Byatt77, S. Cabrera Urb´an167, D. Caforio19a,19b,
O. Cakir3a, P. Calafiura14, G. Calderini78, P. Calfayan98, R. Calkins106,
L.P. Caloba23a, R. Caloi132a,132b, D. Calvet33, S. Calvet33,
R. Camacho Toro33, P. Camarri133a,133b, M. Cambiaghi119a,119b,
D. Cameron117, S. Campana29, M. Campanelli77, V. Canale102a,102b,
F. Canelli30, A. Canepa159a, J. Cantero80, L. Capasso102a,102b,
M.D.M. Capeans Garrido29, I. Caprini25a, M. Caprini25a, D. Capriotti99,
M. Capua36a,36b, R. Caputo148, C. Caramarcu25a, R. Cardarelli133a,
T. Carli29, G. Carlino102a, L. Carminati89a,89b, B. Caron159a, S. Caron48,
G.D. Carrillo Montoya172, A.A. Carter75, J.R. Carter27, J. Carvalho124a,h,
D. Casadei108, M.P. Casado11, M. Cascella122a,122b, C. Caso50a,50b,∗,
A.M. Castaneda Hernandez172, E. Castaneda-Miranda172,
V. Castillo Gimenez167, N.F. Castro124a, G. Cataldi72a, F. Cataneo29,
A. Catinaccio29, J.R. Catmore71, A. Cattai29, G. Cattani133a,133b,
S. Caughron88, D. Cauz164a,164c, P. Cavalleri78, D. Cavalli89a,
M. Cavalli-Sforza11, V. Cavasinni122a,122b, F. Ceradini134a,134b,
A.S. Cerqueira23a, A. Cerri29, L. Cerrito75, F. Cerutti47, S.A. Cetin18b,
F. Cevenini102a,102b, A. Chafaq135a, D. Chakraborty106, K. Chan2,
B. Chapleau85, J.D. Chapman27, J.W. Chapman87, E. Chareyre78,
D.G. Charlton17, V. Chavda82, C.A. Chavez Barajas29, S. Cheatham85,
S. Chekanov5, S.V. Chekulaev159a, G.A. Chelkov65, M.A. Chelstowska104,
C. Chen64, H. Chen24, S. Chen32c, T. Chen32c, X. Chen172, S. Cheng32a,
A. Cheplakov65, V.F. Chepurnov65, R. Cherkaoui El Moursli135e,
V. Chernyatin24, E. Cheu6, S.L. Cheung158, L. Chevalier136,
G. Chiefari102a,102b, L. Chikovani51, J.T. Childers58a, A. Chilingarov71,
G. Chiodini72a, M.V. Chizhov65, G. Choudalakis30, S. Chouridou137,
I.A. Christidi77, A. Christov48, D. Chromek-Burckhart29, M.L. Chu151,
J. Chudoba125, G. Ciapetti132a,132b, K. Ciba37, A.K. Ciftci3a, R. Ciftci3a,
M. Cirilli87, M. Ciubancan25a, A. Clark49, P.J. Clark45, W. Cleland123,
J.C. Clemens83, B. Clement55, C. Clement146a,146b, R.W. Clifft129,
Y. Coadou83, M. Cobal164a,164c, A. Coccaro50a,50b, J. Cochran64, P. Coe118,
J.G. Cogan143, J. Coggeshall165, E. Cogneras177, C.D. Cojocaru28, J. Colas4,
A.P. Colijn105, C. Collard115, N.J. Collins17, C. Collins-Tooth53, J. Collot55,
G. Colon84, P. Conde Mui˜no124a, E. Coniavitis118, M.C. Conidi11,
M. Consonni104, V. Consorti48, S. Constantinescu25a, C. Conta119a,119b,
F. Conventi102a ,i, J. Cook29, M. Cooke14, B.D. Cooper77,
A.M. Cooper-Sarkar118, N.J. Cooper-Smith76, K. Copic34,
T. Cornelissen50a,50b, M. Corradi19a, F. Corriveau85,j, A. Cortes-Gonzalez165,
G. Cortiana99, G. Costa89a, M.J. Costa167, D. Costanzo139, T. Costin30,
D. Cˆot´e29, R. Coura Torres23a, L. Courneyea169, G. Cowan76, C. Cowden27,
B.E. Cox82, K. Cranmer108, F. Crescioli122a,122b, M. Cristinziani20,
G. Crosetti36a,36b, R. Crupi72a,72b, S. Cr´ep´e-Renaudin55, C.-M. Cuciuc25a,
C. Cuenca Almenar175, T. Cuhadar Donszelmann139, M. Curatolo47,
C.J. Curtis17, P. Cwetanski61, H. Czirr141, Z. Czyczula117, S. D’Auria53,
M. D’Onofrio73, A. D’Orazio132a,132b, P.V.M. Da Silva23a, C. Da Via82,
W. Dabrowski37, T. Dai87, C. Dallapiccola84, M. Dam35, M. Dameri50a,50b,
D.S. Damiani137, H.O. Danielsson29, D. Dannheim99, V. Dao49,
G. Darbo50a, G.L. Darlea25b, C. Daum105, J.P. Dauvergne 29, W. Davey86,
T. Davidek126, N. Davidson86, R. Davidson71, E. Davies118,c, M. Davies93, A.R. Davison77, Y. Davygora58a, E. Dawe142, I. Dawson139, J.W. Dawson5,∗,
R.K. Daya39, K. De7, R. de Asmundis102a, S. De Castro19a,19b,
P.E. De Castro Faria Salgado24, S. De Cecco78, J. de Graat98,
N. De Groot104, P. de Jong105, C. De La Taille115, H. De la Torre80,
B. De Lotto164a,164c, L. De Mora71, L. De Nooij105, M. De Oliveira Branco29,
D. De Pedis132a, A. De Salvo132a, U. De Sanctis164a,164c, A. De Santo149,
J.B. De Vivie De Regie115, S. Dean77, D.V. Dedovich65, J. Degenhardt120,
M. Dehchar118, C. Del Papa164a,164c, J. Del Peso80, T. Del Prete122a,122b,
M. Deliyergiyev74, A. Dell’Acqua29, L. Dell’Asta89a,89b, M. Della Pietra102a,i,
D. della Volpe102a,102b, M. Delmastro29, P. Delpierre83, N. Delruelle29,
P.A. Delsart55, C. Deluca148, S. Demers175, M. Demichev65, B. Demirkoz11,k,
J. Deng163, S.P. Denisov128, D. Derendarz38, J.E. Derkaoui135d, F. Derue78,
P. Dervan73, K. Desch20, E. Devetak148, P.O. Deviveiros158, A. Dewhurst129,
B. DeWilde148, S. Dhaliwal158, R. Dhullipudi24,l, A. Di Ciaccio133a,133b,
L. Di Ciaccio4, A. Di Girolamo29, B. Di Girolamo29, S. Di Luise134a,134b,
A. Di Mattia88, B. Di Micco29, R. Di Nardo133a,133b, A. Di Simone133a,133b,