Design of a route-planner for urban
public transport, promoting social
inclusion
Rafael Marques Dias
Mestrado Integrado em Engenharia Eletrotécnica e Computadores
Advisor: Tânia Fontes (Prof.) Co-advisor: Teresa Galvão (Prof.)
promoting social inclusion
Rafael Marques Dias
Mestrado Integrado em Engenharia Eletrotécnica e Computadores
In information processing by communication and information systems, some information is cast aside and considered irrelevant. However, some groups of people that suffer from various lim-itations such as physical, sensory and cognitive impairment need specific information (that can be considered irrelevant) for their daily life, namely their mobility. Therefore, the primary objec-tive of this project is to design a framework and a user-interface of an inclusive inter-modal route planning application for public transportation. This was accomplished with the development of user-interfaces of an inclusive inter-modal route planning mobile application and a definition of a set of guidelines. These interfaces will deliver ready availability of information about infrastruc-tures and other journey related data.
With the finality of achieving the objectives proposed, a three-step methodology was followed: (i) Requirements elicitation; (ii) Interfaces development; (iii) and usability evaluation. The first phase consisted in to identify the social excluded groups and understanding their limitations and current needs, particularly, what information is lacking in route planners. Based on a literature review and the results of interviews and an inquiry, a set of requirements for design the user-interfaces were proposed and assembled. For this purpose, the elderly and the mobility reduced people were chosen as focus groups. The second phase consisted in developing the mock-ups. By trying to extract information and design ideas from current route-planners and then syncing them with the requirements once reached, the interfaces were developed. The third phase consisted in evaluation of the usability of the mock-ups. This was accomplished by conducting an evaluation of the interfaces by promoting another inquiry to the population and a 1 hour session with experts in application development for public transports. In this process, the difficulty in perceiving the information was evaluated.
The overall results demonstrate that the information provided to the users, especially to mo-bility reduce ones, was well handled and extremely accurate. Most people considered the design appealing and intuitive. Based on the findings, the study provides guidelines for software devel-opers and policy makers.
Alguma da informação que provém de sistemas de comunicação e informação é, por vezes, colo-cada de parte e considerada irrelevante. No entanto, alguns grupos de pessoas que sofrem de várias limitações como deficiências físicas, sensoriais e cognitivas, necessitam de informações específi-cas (que podem ser consideradas irrelevantes) para a sua vida diária, nomeadamente para a sua mobilidade. Assim, o objetivo principal deste projeto foi criar uma estrutura de uma interface de uma aplicação de planeamento de rotas intermodais e inclusivo para os grupos de pessoas supra-ditos, utilizadores de transportes públicos. Tal objetivo foi alcançado com o desenvolvimento de interfaces mock-up de uma aplicação móvel de criação de rota intermodal em concomitância com a definição de um conjunto de directrizes. Estas interfaces visam fornecer informação sobre as infraestruturas e outros dados relacionados com viagens.
Com o intuito de atingir os objetivos que foram propostos, foi implementada uma metodologia que consiste em três fases: (i) definição de requisitos; (ii) desenvolvimento das interfaces; (iii) validação. A primeira fase consistiu em identificar os grupos socialmente excluídos e entender suas limitações e necessidades atuais, no sentido de perceber quais as informações ausentes nos planeadores de rotas. Com base numa revisão de literatura e nos resultados de entrevistas e de um inquérito, foi proposto um conjunto de requisitos para o projeto de interfaces de utilizador. Os idosos e as pessoas de mobilidade reduzida foram escolhidos como o grupo de estudo deste projeto. A segunda fase consistiu no desenvolvimento dos mock-ups. Esse desenvolvimento foi realizado com base nos requisitos definidos e num estudo comparativo de outros planeadores de rota. A terceira fase consistiu na avaliação da usabilidade dos mock-ups. Para isso, foi efetuado um novo inquérito à população e marcada uma sessão com especialistas em desenvolvimento de aplicações móveis para transportes públicos. Em ambos os processos, foi avaliada a dificuldade em perceber as informações dos mock-ups.
Os resultados obtidos demonstraram que a informação integrada nas interfaces é precisa e estava bem tratada, especialmente tendo em conta pessoas com mobilidade reduzida. A grande maioria das pessoas considerou o design apelativo e intuitivo. Com base em estudos, este trabalho dita algumas guidelines para programadores de software.
This work is the final step of my academic career, and I would not have done it alone, therefore I would like to mention some people whom I am eternally grateful.
I’ll start by stating that my parents are most likely the best parents on the face of the earth. They supported me immensely throughout this tough process called university. Without their emotional and economic support I would not be able to accomplish any of this, and I will admit, they trusted me more than I trusted myself. So thank you dad, for your chill attitude and good mentoring, and thank you mom, for being extremely kind and always looking out for me. I hope I can be as great as both of you at parenting one day.
I’m very glad that my grandpa and grandma are able to see me finish this major, things have been quite rough for their end and I only wish them the best, they have been very supportive and kind to me, thank you so much, you will never be forgotten.
To every friend and colleague that I had the pleasure of meeting in this journey, I thank you, without your support I would have been lonely and uninspired to pursue this major. A humongous brofist and special thanks to João "Jals" Silva, Tiago "Twix" Fernandes, Miguel "Churi" Santos and Ricardo "anagke" Puga for being the best buddies I’ve ever met, you guys rock and it feels amazing to laugh with you, I hope we can continue to be friends for the rest of our lives.
I met this incredible girl two years ago and I’ve had the privilege of having her by my side, she supported me in every aspect of my life since then, and I cannot thank her enough for it. I hope I can repay the immense support you gave me when you reach the last year of your major. Until then I will be here for whatever you need, miss Luísa Faria. I love you.
A huge thank you to my supervisor, Eng. Tânia Fontes, for entrusting me this project and guiding me in the process. I am glad you approved the work that has been developed and I hope I met all expectations. The idea you came up with is great and will surely have some impact in future development of route planners.
To my co-supervisor Teresa Galvão and OPT, thank you very much for the opportunity of talking to you guys and receiving important feedback, I hope we can discuss some more about the work that has been done.
Finally, I would like to thank Associação Salvador for spreading my survey with their contacts and the people who participated in the interviews.
This work is partially financed by the ERDF - European Regional Development Fund through the Operational Programme for Competitiveness and Internationalisation - COMPETE 2020 Pro-gramme and by National Funds through the Portuguese funding agency, FCT - Fundacão para a Ciência e Tecnologia within project POCI-010145-FEDER-032053.
1 Introduction 1 1.1 Framework . . . 1 1.2 Objectives . . . 2 1.3 Motivation . . . 2 2 Literature review 3 2.1 Introduction . . . 3 2.2 Social exclusion . . . 4 2.2.1 Concept . . . 4
2.2.2 Mobility and transport related social exclusion . . . 5
2.2.3 Identification of socially excluded individuals . . . 7
2.3 Route planners . . . 10
2.3.1 Concept . . . 10
2.3.2 Existing work . . . 11
2.3.3 Conclusion . . . 18
3 Problem characterization and approach 19 3.1 Introduction . . . 19
3.2 Focus group . . . 20
3.3 Public transport information . . . 21
3.4 User-centered design . . . 22 3.5 Usability . . . 24 4 Requirements elicitation 27 4.1 Introduction . . . 27 4.2 Data collection . . . 28 4.2.1 Interviews . . . 28 4.2.2 Inquiry . . . 30 4.3 Data evaluation . . . 32 4.3.1 Interviews . . . 32 4.3.2 Inquiry . . . 36 5 Interfaces development 41 5.1 Tools . . . 41
5.2 Interfaces elements and concepts . . . 41
5.2.1 Elements . . . 42
5.2.2 Concepts . . . 43
6 Usability evaluation 57 6.1 Methodology . . . 57 6.1.1 Expert evaluation . . . 57 6.1.2 Inquiry . . . 58 6.2 Results . . . 58 6.2.1 Expert evaluation . . . 58 6.2.2 Inquiry . . . 60
7 Conclusions and future work 63 7.1 Conclusions . . . 63
7.2 Future work . . . 65
2.1 Differentiation of transport disadvantage, social disadvantage and social exclusion. 7
2.2 Google Maps Interfaces (Part 1) . . . 13
2.3 Google Maps Interfaces (Part 2) . . . 14
2.4 Citymapper Interfaces (Part 1) . . . 15
2.5 Citymapper Interfaces (Part 2) . . . 16
2.6 MOVE-ME Interfaces (Part 1) . . . 17
2.7 MOVE-ME Interfaces (Part 2) . . . 17
3.1 ISO 13407 interactive design process. . . 23
4.1 Porto.Bus interface when seeing the ETA of buses in a bus stop. . . 36
4.2 Age ranges of inquiry participants . . . 37
4.3 Number of people with and without deficiencies who answered the inquiry . . . . 37
4.4 How people gather information about the schedules . . . 38
4.5 Differences of importance between information according to the users . . . 39
5.1 Main page interface . . . 43
5.2 Main page - subway and bus buttons . . . 43
5.3 Main page - route planning button . . . 44
5.4 Main page - menu button . . . 44
5.5 Subway lines interfaces (Part 1) . . . 45
5.6 Subway lines interfaces (Part 2) . . . 46
5.7 Bus interfaces (Part 1) . . . 47
5.8 Bus interfaces (Part 2) . . . 48
5.9 Bus interfaces (Part 3) . . . 49
5.10 Route planner interfaces (Part 1) . . . 50
5.11 Route planner interfaces (Part 2) . . . 52
5.12 Route planner interfaces (Part 3) . . . 53
5.13 Menu and notifications interfaces (Part 1) . . . 54
5.14 Menu and notifications interfaces (Part 2) . . . 55
6.1 Likert scale used . . . 58
6.2 Age ranges of people who participated in the inquiry for the usability evaluation . 61
2.1 Groups at most risk of poverty in different countries. Source: (European
Comis-sion,2010) adapted . . . 9
2.2 Ranking table of various trip planning applications (Source: Manchester School of Architecture(2016)) . . . 12
4.1 Inquiry developed . . . 31
4.2 Interview summary of the first five interviewees . . . 33
4.3 Interview summary of the last five interviewees . . . 34
5.1 Main elements terminology . . . 42
6.1 Interface average scores obtained from the usability inquiry. . . 61
Introduction
1.1
Framework
In 2016, 23.5% of the European population was at risk of poverty of social exclusion, which means that 118 million people were living in either severe material deprivation, monetary poverty or were living in a household with very low work intensity. In 2017, this number lowered to 22.4%, however, the percentage of the population at risk of poverty or social exclusion in three EU Member states was more than a third: Romania (35.7%), Bulgaria (38.9%) and Greece (34.8%). Despite these numbers, some countries managed to grow and strengthen their economy; between 2016 and 2017, Romania, Cyprus, Poland, Slovakia and Portugal suffered a substantial decrease in the risk of poverty or social exclusion percentage, marking 35.7%, 25.2%, 19.5%, 16.3% and 23.3% respectively (EUROSTAT,2017).
Social inclusion is perhaps best explained in terms of its opposite – social exclusion. The term social exclusion was initially introduced in the European policy domain during the 1990s (Shortall,2008) and it was perceived as some sort of happening that stroke the poor exclusively. Moreover, in the literature, the terms poverty, deprivation and social exclusion have often been used interchangeably. The term social exclusion has been exhaustively discussed throughout these last decades, and, in its essence, it can be understood as the process whereby and individual be-comes deprived, and not the actual deprivation itself, and in fact, poverty and deprivation can be argued as the outcomes of that process (Kamruzzaman et al.,2016). This means that the socially excluded are the ones who are not only poor, but also those who lost their ability to get a job or pro-ceed education. The exclusion process covers various circumstances where individuals or groups of people are unable to participate in activities or to access certain goods (e.g. services, work, school, etc.) that are available to others as a fundamental part of belonging to society (Mackett and Thoreau,2015).
Public transports play a big role in today’s modern and non-modern society, specially because it facilitates the access to the goods that were referred previously; therefore, transport-related social exclusion is part of our reality, since individuals that do not have access to the transport system can be regarded as excluded.
1.2
Objectives
The primary objective of this project is to design a framework of a user-interface of an inclusive inter-modal route planning application. The main questions of this research are:
(i) What are the main current social excluded groups and why? (ii) Which necessities and limitations do those groups have?
(iii) What kind of information regarding mobility do they need the most? (iv) In what way should that information be organized and delivered?
To develop this work, firstly, a literature review was conducted in order to identify the main social excluded groups (e.g. blind, pregnant women) and its growth trends in the next few decades. Afterwards, the main limitations and needs of the citizens involved in those groups were inves-tigated (e.g. elevators, low passenger routes). Lastly, the framework and the user-interface was created considering those same limitations and needs, utilizing an iterative method and the par-ticipation of users. The project involved the development of a structured, comprehensive report, with the requirements specification of services the system is expected to provide as well as the specification of the guidelines that these process must be followed.
1.3
Motivation
There are various transport-related social exclusion parameters such as income, disability, age, gender, ethnicity, availability of transport, physical barriers, facilities, and information ( Mack-ett and Thoreau,2015). This last parameter is extremely important and will be one of the main focuses for this project. Information is sometimes inadequately and differently perceived by citi-zens, according to their socio-economic context and experience. This should have a strong impact on software applications that support choices in urban mobility. Generally, these applications adopt a standard approach, marginalizing, therefore, some population groups (e.g. the disabled, the elderly, children, pregnant women, people in poverty). In urban transport applications, this aspect is rather critical, as it can be quite important in ensuring that individuals and the different social groups can properly access work, schools, health care, services, social networks, etc, and consequently, promoting social inclusion.
Literature review
The first section of this chapter will cover the research regarding the state of the art of the social exclusion concept, social exclusion in public transports and an identification of socially excluded groups. The second section will be focused on studying the concept of route planners and the current work that has been developed in that area.
2.1
Introduction
The terms poverty, deprivation, and social exclusion have been used interchangeably in the litera-ture (Kamruzzaman et al.,2016). Bearing this in mind, it is plausible to say that social exclusion is often misunderstood, poorly defined and poorly measured construct. In order to solve this issue,
Kamruzzaman et al. (2016) explains that there is a need to properly identify the disadvantaged groups, or else the needs of these groups will remain unknown and the measures to prevent social exclusion from happening will not succeed.
Transport-related social exclusion has been a topic mentioned throughout the evolution of the term social exclusion itself. The key that mobility plays in social inclusion/exclusion is widely known (Lodovici and Torchio, 2015). Transports act as a middle link between the people and the opportunities that arise; therefore, it is well documented and accepted that transports have an extremely important role promoting social exclusion as well as inclusion.
Mackett and Thoreau (2015) reaffirm this idea by stating that an individual with access to the transport system may participate in many aspects of society. Lucas (2012) assert that transport and mobility inequality has been a topic mentioned in the transportation literature and that it has an important role determining social social outcomes in society.
There are different socio-economic groups that, nowadays, live in poverty and, consequently, suffer from social exclusion and transport disadvantage. In Europe, the percentages of each group differ but are quite alarming. For instance, the unemployed have a risk of poverty of 56%, the elderly have it at 42%, people with low training and education at 30%, disabled and long-term ill people at 30%, people in precarious work also at 30%, people suffering from addictions at 26%,
young adults, single parents and children at 23%, 22% and 20% respectively, and the list goes on (Lodovici and Torchio,2015).
An increase in population density creates an expansion in demands on urban infrastructures, including public transports. As a consequence to this growth, comes a need for cleaner, less congested cities and improved traffic flow, specially through the increase use of enhanced public mass systems and other alternatives to private vehicles (Houghton et al.,2009). This means that reducing the demand for private transports in urban zones is a key sustainability aim (Redman et al.,2013). A viable and sustainable alternative to private vehicles would be public transports (Holmgren,2007).
Journey planning is a vital process in public transports management. Travellers gain important information regarding the trip they wish to take by using journey/route planning apps although most of the algorithms underlying in these kinds of apps are deterministic, which means they do not cover in case of delay (i.e. traffic, red lights, etc.) (Bérczi et al.,2018). Decisions on the mode of transportation and potential routes to get to the destination are both cardinal aspects associated with journey planning. The most important factors to take into consideration in choosing routes are usually journey time and cost (Manchester School of Architecture,2016).
2.2
Social exclusion
2.2.1 Concept
Initially introduced in the French literature, social exclusion is a term that was coined by Lenoir (1974) and it has had various definitions over the history; its concept has been changing during the years (Schwanen et al.,2015) .
It is critical to establish a substantial difference between social exclusion, poverty (Kenyon et al.,2002) and deprivation. Kamruzzaman et al.(2016) clarify that poverty is generally under-stood as the lack of material resources such as income, and that people may be socially excluded without being poor. Deprivation, however, is a more diffuse concept that is related to the quality of life, and to the with lack of particular attributes, as the income, which contributes to some degree of suffering or relative disadvantage. Also,European Comission(2010) state that social exclusion is another potential consequence of poverty.Kamruzzaman et al.(2016) explain that social exclu-sion is not only a process but also an outcome and that deprivation and poverty are outcomes of that same process; this means that there is a clear connection between those three concepts.
It is crucial to comprehend that an excluded person can have good income, which means that the poor are not the only suffering from said exclusion. Education, health care, ability to get a job are all essential rights that an excluded individual may not have access to. Schwanen et al.
(2015) define the concept of social exclusion as polysemic and contested because of the diverse philosophical origins; what this means is that it has different meanings for different people and in different situations. Despite that,Schwanen et al.(2015) state that social exclusion inclines to be understood as various factors, ranging from a lack of participation in social, economic and political
life to a multidimensional and cumulative subject that tends to aggravate (low financial resources is mutually tied to lesser education skills, which will have a negative impact in the future).Mackett and Thoreau(2015) denote that the term social exclusion is directly related with participation in activities or the access of certain goods, services and opportunities that are vital for anyone that belongs in society. In correlation with what Mackett said,Burchardt et al.(1999) also stated that:
“an individual is socially excluded if he or she does not participate in key activities of the society in which he or she lives.”
The activities he refers to are: consumption; production; political engagement; and social interaction. Therefore, the lack of participation in these activities contribute to social exclusion.
The European Commission, in the joint report by the Commission and the Council on social inclusion (2004) also provided definitions for social exclusion as well as social inclusion. In their eyes, social inclusion is a process that ensures greater participation in decision making which af-fects the socially excluded individuals lives as well as fundamental rights. Also, it fortifies the access by those at risk of poverty and social exclusion to opportunities and resources necessary to participate fully in economic, social and cultural life. On the other hand, the European Com-mission understands social exclusion as a process whereby an individual is pushed to the edge of society, therefore being prevented to participate in social events fully by virtue of their poverty, or lack of basic competencies and lifelong learning opportunities. This creates a gap between the person and certain opportunities like jobs, education and social and community network activities. Socially excluded people tend to have less access to power and decision making which makes them feel powerless and unable to take control over decisions that affect their daily lives.
The UK Social Exclusion Unit SEU (2003) reaffirms these ideas by stating that social exclu-sion happens when a handful of problems are casted upon certain people or areas, problems such as poor skills, low incomes, high crime rate, poor health, unemployment and family breakdown.
2.2.2 Mobility and transport related social exclusion
It is now possible to allow mobility and transport subjects to be introduced and taken into con-sideration. These terms are directly related to social exclusion and many studies have shown the impact that transports represent on the social exclusion subject. Mobility is a tool that must be used by someone in order to reach certain goods, services and activities (Lucas et al.,2016).
Kenyon et al.(2002) declares a definition for transport and mobility related exclusion:
Mobility-related exclusion is “the process by which people are prevented from par-ticipating in the economic, political and social life of the community because of re-duced accessibility to opportunities, services and social networks, due in whole or in part to insufficient mobility in a society and environment built around the assumption of high mobility.”
Church et al.(2000) made clear seven specific transport-based exclusions that are directly re-lated to social exclusion and that prove that social exclusion is a problem with a multidimensional nature. These seven categories are:
• geographical exclusion: impediment of utilizing transport services because of the area a person lives;
• exclusion from facilities: key facilities are located far from where a person lives;
• economic exclusion: the cost of travel prevent a person from accessing the transport system and therefore is not able to reach certain facilities;
• time-based exclusion: reduced time available for travel (interchangeably used in the litera-ture as time-poverty);
• fear-based exclusion: the fear for personal safety may induce "hesitant to get" out be-haviours and therefore transports or public spaces are not used;
• space exclusion: prevention of access to certain groups in some areas, e.g gated communi-ties or first class waiting rooms at stations;
• physical exclusion: physical barriers, lack of disabled facilities or information, obstruct the access to transport services.
This list gives an overall view of how transport-related social exclusion is composed, but lacks on expressing in which layer of activity it occurs and gives no solutions to solve each feature (Lucas, 2012). It is possible to see that lack of information also promotes physical exclusion,
Davies(2001) states that product information should be perceived as informative as a basic con-sumer right (e.g facts presented in a straightforward, easily readable, and clear way). This author also mentions dimensions of perceived information (PIQ) which is defined as a set of judgement criteria, or dimensions, for evaluating the perceptions of product information; clarity, readability, accessibility and relevance are the main dimensions of PIQ (Davies,2001).
Figure 2.1: Differentiation of transport disadvantage, social disadvantage and social exclusion. Source:Lucas(2012)
Lucas(2012) discuss about the importance of establishing a difference between transport dis-advantage and transport-related social exclusion, stating that these aren not necessarily synonyms, but the concepts interact directly and indirectly to cause transport poverty. Figure 2.1illustrates the key interactions between these 3 concepts.
Mackett and Thoreau (2015) state various factors that can contribute to a transport related social exclusion as well as some references and facts to prove them, these factors are: income; disability; age; gender; ethnicity; cost; availability of transport; psychological barriers; physical barriers; facilities; and information.
Information is the main topic for discussion of this thesis, as poor travel information may lead to misunderstandings, lack of knowledge and, therefore, social exclusion. Nowadays, if an indi-vidual owns a smartphone, tablet, or any device with the Maps installed, he or she may easily use that device to create a route that provides the basic information needed to be able to reach the des-tination. However, not all socio-economic groups have sufficient income to buy a technologically advanced device, and some individuals have disabilities which makes many devices not suitable for their use (Mackett and Thoreau, 2015). Also, there is some information that is not being treated equally, for example, a person in a wheelchair will require an elevator to reach either the subway or the train. In many interfaces, that information is not exposed whilst being necessary.
2.2.3 Identification of socially excluded individuals
Cass et al. (2005) interviewed a number of local authority representatives in the UK with the intention of finding out what were their thoughts on social exclusion in relation to transport and what methods were used to assault this problem. The answers were inconsistent and different. It
turns out the representatives had diverse views about the subject; some applied the term “social excluded” to specific groups, while others referred it to certain deprived areas (Cass et al.,2005), and it is in fact true that some groups are more affected by social exclusion than others (Lodovici and Torchio,2015).
Lodovici and Torchio (2015) define poverty and social exclusion as interchangeable terms since they both affect the same population and groups. According to a study conducted by Eu-ropean Comission(2010), in Europe, especially in Hungary, Bulgaria and Romania, 90% of the citizens perceive poverty to be a widespread phenomenon, this value being considered the highest registered. Meanwhile in Denmark, Cyprus and Sweden mark the lowest values as 38%, 38% and 33% respectively (European Comission,2010).
Note thatTable 2.1shows a survey that was conducted to find out which groups were most at risk of poverty in different countries, which directly means at most risk of social exclusion, according to people beliefs. The unemployed group was the most noticeable, having the highest percentages in almost all countries. Lodovici and Torchio(2015), from a literature review point, write about the impact of the public transport system on socio-economic disadvantages. Children and young people, elderly, disabled, women, migrants and ethnic minorities, low-income and unemployed individuals, people living in rural and deprived areas are the ones at most risk, which goes into association with what is shown inTable 2.1.
Unemplo yed Elderly People in precarious w ork Disabled and long-term ill people People with a lo w le v el of education or training skills People suf fering from addictions Y oung adults Single parents Children Immigrants People with mental health problems EU27 56% 42% 30% 30% 30% 26% 23% 22% 20% 15% 14% Austria 50% 43% 30% 29% 31% 26% 18% 40% 22% 20% 18% Belgium 55% 28% 35% 36% 38% 30% 18% 31% 6% 23% 15% Bulg aria 69% 54% 33% 49% 26% 11% 22% 27% 19% 1% 17% Cyprus 68% 36% 17% 48% 39% 43% 29% 22% 10% 11% 28% Czech Republic 69% 44% 30% 47% 27% 24% 16% 39% 9% 5% 10% Denmark 51% 17% 13% 35% 47% 62% 7% 38% 8% 24% 30% Estonia 68% 21% 33% 43% 38% 39% 25% 34% 9% 3% 13% Finland 68% 33% 28% 37% 26% 33% 32% 38% 2% 20% 21% France 61% 42% 44% 30% 34% 22% 34% 17% 10% 22% 8% German y 53% 46% 34% 22% 39% 25% 18% 37% 47% 19% 10% Greece 74% 45% 34% 30% 23% 19% 49% 13% 11% 20% 18% Hung ary 69% 42% 25% 33% 35% 21% 26% 28% 16% 1% 12% Ireland 62% 34% 27% 28% 46% 30% 31% 19% 25% 6% 22% Italy 70% 47% 35% 23% 19% 17% 26% 12% 8% 22% 7% Latvia 60% 48% 21% 41% 24% 27% 20% 23% 16% 3% 10% Lithuania 66% 42% 10% 39% 23% 47% 24% 16% 10% 2% 12% Lux embour g 57% 11% 26% 20% 45% 37% 26% 22% 7% 23% 12% Malta 50% 34% 15% 38% 35% 34% 10% 21% 21% 10% 13% Netherlands 47% 20% 19% 46% 54% 50% 11% 26% 2% 26% 31% Poland 58% 43% 32% 44% 22% 30% 10% 20% 16% 3% 13% Portug al 67% 59% 28% 35% 12% 17% 16% 5% 11% 5% 15% Romania 42% 55% 36% 28% 28% 14% 45% 16% 31% 2% 14% Slo v ak Republic 66% 43% 31% 41% 33% 26% 18% 28% 14% 3% 10% Slo v enia 51% 39% 13% 41% 25% 21% 35% 19% 10% 10% 16% Spain 54% 39% 24% 21% 20% 27% 20% 9% 14% 33% 10% Sweden 59% 15% 11% 47% 32% 52% 18% 29% 3% 35% 28% United Kingdom 37% 43% 15% 25% 33% 28% 21% 23% 31% 10% 24% T able 2.1: Groups at most risk of po v erty in dif ferent countries. Source: ( European Comission , 2010 ) adapted
2.3
Route planners
2.3.1 Concept
Nowadays passengers want to be able to travel as fast, comfortable, safe and cheap as they possibly can, while at the same time being able to easily access certain core information about the trip (¸Stef˘anescu et al.,2014). Houghton et al.(2009) state that it is now possible to apply advanced technology to collect more and better data, whose process of analysis is also enhanced to create an end result that is more efficient, effective and targets services for passengers. This technology is known as Intelligent Transport Services (ITS) and it has been around for many years, with recent developments. However, asHoughton et al. (2009) state ITS can sustain and demonstrate a fair number of helpful information:
• Enhanced transit/customer relationship management; • Traffic prediction;
• Improved transport and traffic management; • Integrated fare management;
• Traveler information and advisory services; • Road user charging;
• Variable parking pricing.
The rapid growth of new technologies is radically changing the way the public transport sector operates, as it is now possible to replace the expensive infrastructures, which were once required, by a simple mobile device and online platforms (Ferreira et al.,2017). Technological advance has made simple but significant changes for bus passengers, for example, it is now possible to know the expected arrival time when waiting for buses. These applications can be called live bus arrival information and they support various benefits for users (Barber et al.,2018): decreased expected time; improved satisfaction with bus service; and positive impact on ridership. These applications can be entwined with trip planning apps and therefore providing expected arrival times for buses that an individual needs to catch in order to travel somewhere. A trip planner can be considered a smart travel assistance tool which can provide certain information to the passenger for a given origin and destination stops (Rout et al.,2013).
It is becoming a habit for human beings to be constantly online (Amador, 2014), whether indoors or outdoors, on smartphones or tablets or even laptop computers. The number of journey planning apps that currently exist is quite significant and they usually require the access to the internet, which by now should not propose any problems.
2.3.2 Existing work
This section is meant to expose some of the applications that have been developed surrounding this theme thus far, as well as some of their main characteristics.
Manchester School of Architecture(2016) does a very general and good analysis of various journey planning apps. This work also tackles different high level features that journey planners should include, such as:
• Multimodal, which means the journey planner provides various options to choose from considering various methods of transportation e.g train, bus, subway and walking;
• Navigation, feature that most apps have, keeps track of the user’s movement and provide navigation guidance;
• Real time information, which happens when an app and the device have built-in GPS nav-igation, henceforth users are notified about traffic conditions and re-route to avoid certain unpredicted delays. This information also includes arrival or departure times and line clo-sures. Automatic re-routing to alternative paths or inform users about imminent departures are part of this type of system;
• Crowdsourcing data, a feature that allows users to contribute certain information to a sys-tem. When used properly, valuable location data can be collected and shared among other users who can respond accordingly;
• Personalisation allows users to meet their specific needs more efficiently as well as effec-tively. A good example of this feature is when an app is able to store a preset location for ’home’ or ’work’ based on a user’s previous behaviour, or simply manually;
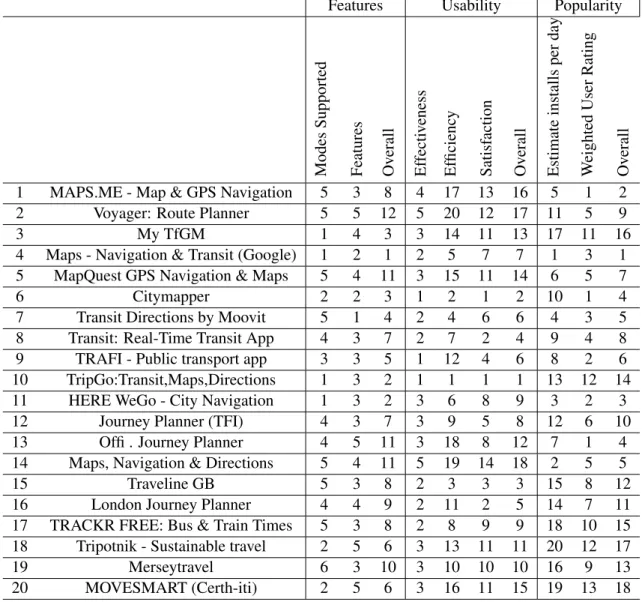
Table 2.2shows the ranking of different and popular route planners separated by different fac-tors such as Features, Usability and Popularity; note that the numbers represent the outcome from each evaluation criteria being 1 the highest/best possible outcome, and 20 the lowest/worst. To produce the overall ranking, each column is normalized for each evaluation with equal weight-ing. Considering all the apps included in this table, 5 of them were detached from the others in a positive way, bearing in mind a high level feature evaluation: Google Maps; TripGo; Here WeGo; Citymapper; and TfGM. The analysis was based on modes of transportation supported and identified features supported.
Features Usability Popularity Modes Supported Features Ov erall Ef fecti v eness Ef ficienc y Satisf action Ov erall Estimate installs per day W eighted User Rating Ov erall
1 MAPS.ME - Map & GPS Navigation 5 3 8 4 17 13 16 5 1 2 2 Voyager: Route Planner 5 5 12 5 20 12 17 11 5 9
3 My TfGM 1 4 3 3 14 11 13 17 11 16
4 Maps - Navigation & Transit (Google) 1 2 1 2 5 7 7 1 3 1 5 MapQuest GPS Navigation & Maps 5 4 11 3 15 11 14 6 5 7
6 Citymapper 2 2 3 1 2 1 2 10 1 4
7 Transit Directions by Moovit 5 1 4 2 4 6 6 4 3 5 8 Transit: Real-Time Transit App 4 3 7 2 7 2 4 9 4 8 9 TRAFI - Public transport app 3 3 5 1 12 4 6 8 2 6 10 TripGo:Transit,Maps,Directions 1 3 2 1 1 1 1 13 12 14 11 HERE WeGo - City Navigation 1 3 2 3 6 8 9 3 2 3 12 Journey Planner (TFI) 4 3 7 3 9 5 8 12 6 10 13 Offi . Journey Planner 4 5 11 3 18 8 12 7 1 4 14 Maps, Navigation & Directions 5 4 11 5 19 14 18 2 5 5
15 Traveline GB 5 3 8 2 3 3 3 15 8 12
16 London Journey Planner 4 4 9 2 11 2 5 14 7 11 17 TRACKR FREE: Bus & Train Times 5 3 8 2 8 9 9 18 10 15 18 Tripotnik - Sustainable travel 2 5 6 3 13 11 11 20 12 17
19 Merseytravel 6 3 10 3 10 10 10 16 9 13
20 MOVESMART (Certh-iti) 2 5 6 3 16 11 15 19 13 18 Table 2.2: Ranking table of various trip planning applications (Source: Manchester School of Architecture(2016))
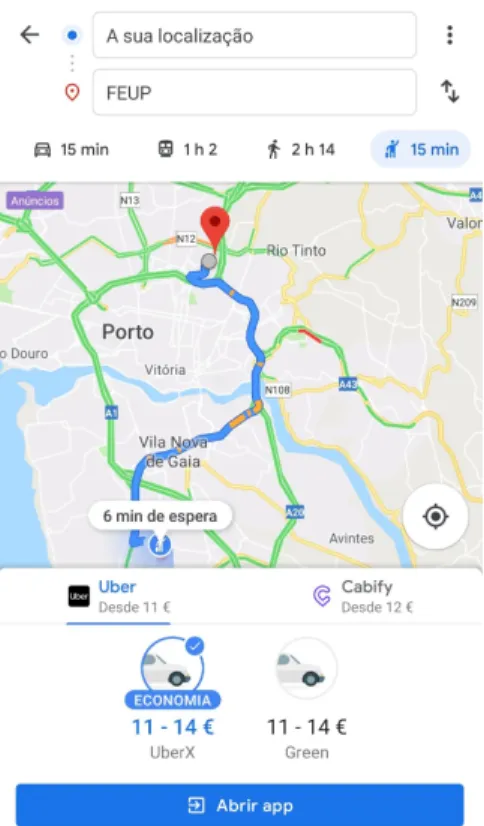
As Figure 2.2shows, Google Maps owns a clean interface with simple but vibrant colours which provides a somewhat instinctively understanding of what is on screen and the usability of the app in general. Figure 2.3demonstrates two important features that Google Maps possesses: Uber and Cabify linking and a history of places the user has been to in addition to saving a user work place and home as presets. It is worth noting that 8 out of the 20 apps stated in Table 2.2
are not multimodal, and 10 out of the 20 apps do not handle real-time information whilst Google Maps has both features integrated.
Concerning the Usability evaluation, asTable 2.2attests, three main features have been con-sidered: effectiveness; efficiency; and satisfaction. The top five apps in Usability are Citymapper, Traveline GB, TripGO, London Journey Planner and Transit. In regards to Usability,Manchester School of Architecture (2016) associates various core features that can greatly improve a user experience, namely:
(a) Google Maps interface while using the driving feature
(b) Google Maps interface while using the public transport feature
Figure 2.2: Google Maps Interfaces (Part 1)
• Maps and Points of Interests (POI), which refers to the ability to retrieve a location input from a user and translate it to longitude and latitude coordinates, or it can be acquired from location information within predefined POI’s. When using search feature, the predefined locations are able to be incorporated;
• Geocoding, feature that, in conjunction with auto-completion, allows a user to pick the required location from a drop down list, for instance. A list of previous selections within a search history is also included. In its essence, it facilitates the action of defining an origin and a destination;
• Time of Travel, feature that is extremely common and also important considering the fact that informs users about the amount of time the journey will take. Some route planners have a traffic dataset that incorporates estimated delays;
• Customization is also a great feature that an app should bear, taking into account it provides the users different options that are more suitable for each individual;
• Results display provides the user various journey options. Essentially, journey time and multiple-leg journey are the two most common results displayed.
(a) Google Maps interface while using the uber/cabify feature
(b) Google Maps interface while checking a user history
Figure 2.3: Google Maps Interfaces (Part 2)
It is important to note that not all the applications included inTable 2.2support all methods of public transportation that are common nowadays. For instance, ’MAPS.ME’, ’Voyager’ and ’Maps, Navigation & Directions’ do not own information regarding trains, trams, buses and others, therefore, no data about those methods of transport is disclosed to the user. Meanwhile, ’Transit: Real-Time Transit App’, ’Journey Planner (TFI)’, ’Offi - Journey Planner’ and ’London Journey Planner’ are able to provide information about trains, trams and buses, but they do not support information about car, walking or bicycle trips. Among all the applications that are stated in the table, only ’Maps’ by Google, ’My TfGM’, ’TripGo’ and ’HERE WeGo’ are the only ones that, in addition to being considered multi-modal, also manage to create viable travel routes utilizing car, walk, bicycle, train, tram, bus and other methods of transportation available (i.e. scooter, boat).
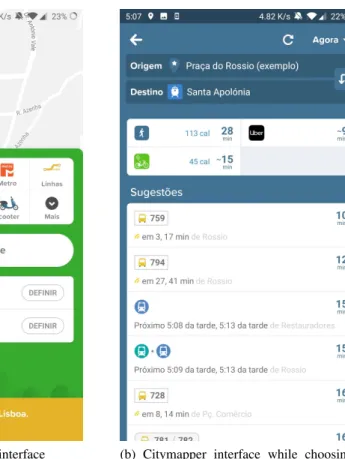
Citymapper is an excellent example of a new, solid and reliable route planner; its main mission consists in "Make Cities Usable", focusing on helping people get around cities while at the same time, reducing congestion and pollution. The app allows users to select a major city and view all options for public and private transportation within that area. InFigure 2.4it is possible to observe two examples of user interfaces that Citymapper owns: the left one is what the user sees when he or she opens the application, and the right picture demonstrates various transportation suggestions to go from Praça do Rossio to Santa Apolónia.
It is important to notice the symbols that Citymapper uses for informing the user about possible trip routes by bus, car or bicycle, for example. In order to provide good discover ability of varied
(a) Citymapper main interface (b) Citymapper interface while choosing a transport option for a trip
Figure 2.4: Citymapper Interfaces (Part 1)
transport modes, the main page uses great visual illustrations that act as signifiers. It is clear to people without any visual or mental problems to realize which button to press, but that may not be the case if the user has one or more of those problems.
The colors and design on the interfaces shown in Figure 2.4andFigure 2.5 are vibrant but also neutral, which provides a good contrast to the overall look, it is an appealing app to many commuters and explorers. The colors need to be tested in a group of socially excluded people to conclude if it needs tuning.
An application named MOVE-ME is not listed inTable 2.2, however, it is one of the main apps used by commuters in Portugal. The MOVE-ME project (www.move-me.mobi) consists of a mobile application that provides real time information to public transport users, including data from subway, bus and train schedules (Falcão and Galvão(2013)).
This app was was launched in 2012 and it has suffered a few updates on the interface and well as some heavy ones in updated public transport routes, specially regarding buses. It mainly focuses in the Metropolitan Area of Porto and Metropolitan Area of Lisbon. The system architecture of MOVE-ME is based on previously developed transport information services and its main data base is able to collect detailed information from various transport companies such as network details, schedules and real time data (Falcão and Galvão(2013)).
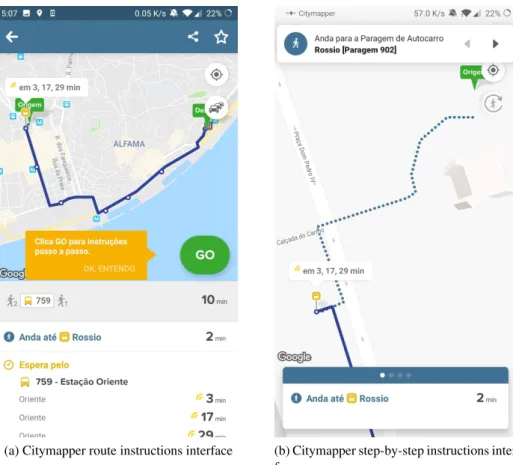
(a) Citymapper route instructions interface (b) Citymapper step-by-step instructions inter-face
Figure 2.5: Citymapper Interfaces (Part 2)
If the app was listed in table Table 2.2 it would most likely be evaluated with average scores regarding features and a good score considering usability tests as well as popularity. A prototype that could measure and share users emotional state was initially proposed, it could capture users effective state using a simple emotional model of travelling mood, with features that are based on Russell’s circumplex of emotion. However, it seems like this prototype did not breakthrough since it is not implemented in the current app, although the concept is very interesting and worthy of research in future projects.
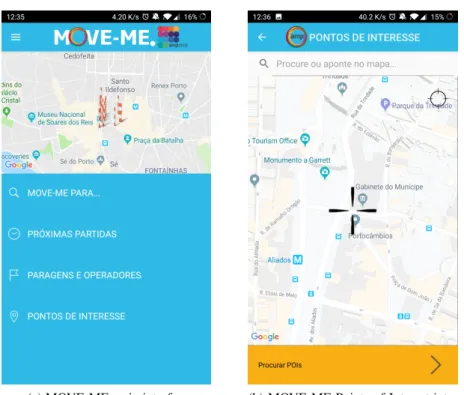
InFigure 2.6it is possible to see the simplistic MOVE-ME main interface that didn’t change too drastically over the years since the 2012 original launch. After a discussion with the whole team behind this project, we got to know a few curious and interesting facts, one of those is that the light blue color was quite a hard choice to make since it took a while for everyone to get to an agreement, the color was chosen over an inquiry that was taken by a substantial amount of people. The picture on the right inFigure 2.6represents an interesting feature that MOVE-ME owns, it locates POIs (Points of Interest) near the user location, if the user presses the yellow button down at the bottom a selector pops up, allowing the user to choose various radius considering the center being where he or she is located on the map, after picking the desired number a new interface appears, similar to the one that was showing before, but this time with arrows on the different POIs that can be encountered in the selected area, as shown inFigure 2.7.
(a) MOVE-ME main interface (b) MOVE-ME Points of Interest inter-face
Figure 2.6: MOVE-ME Interfaces (Part 1)
(a) MOVE-ME with various Points of Interest selected
(b) MOVE-ME list of POIs nearby a user location
2.3.3 Conclusion
It is plausible to say that none of the applications introduced onTable 2.2have specific features that take into consideration particular needs that socially excluded people bear. As stated in section 1, a substantial amount of groups are recognized as excluded when it is taken into consideration how public transports work in the current days.
In order to promote social inclusion, this work aims to elaborate and mention new features, re-sorting on new and simple interfaces that journey apps can use to improve these groups experience in public transportation. These features vary from each excluded group so, in order to simplify, there will be a focus group, which will be discussed in the next chapter.
Problem characterization and approach
This chapter will focus on discussing several topics that should be approached before developing any kind of interface. The first topic identifies the socially excluded group that was selected and the reason behind it. The second topic will focus on what information should be disclosed to the said group in order to promote social inclusion in public transportation. The third topic discusses about how the design of an interface can affect the individual using it and how to actually develop one. The last topic will cover the usability term, which is prominent in the process of interface design.3.1
Introduction
In general, information that is perceived by citizens is differently processed depending on various factors, normally according to their socio-economic context and experience. This means that some groups will be marginalized and therefore considered socially excluded. In chapter 2 various groups that are considered socially excluded nowadays are exposed as well as, frequently, public transportation methods and applications are not sophisticated enough to solve the marginalization problem that it is being promoted.
Software applications that support urban mobility, namely route planners, should have this in consideration but instead, as software developers aim for bigger, general and more lucrative mar-kets, many of the apps that are being produced do not address the peculiar requirements that people who are not socially included tend to own. Technology enables new opportunities in form of social interaction or direct access to information anytime, anywhere (Wang and He(2015)). These two aspects are extremely important in this work, since it proves that new software applications that disclosure information to the user, specially those intertwined within the public transportation sub-ject, may decrease the number of socially and transport excluded people and therefore encourage social inclusion.
The discussion that arises from the idea of developing a new journey planner application, whom excluded people can benefit from, mostly concerns to which information is decisive to reveal to the user, how will this information be revealed and how will the interface be designed in
order to be as clear as possible to the user, which means, for instance, to not cause any visual or other type of confusion.
3.2
Focus group
As it was previously stated in chapter 2, the elderly group is considered extremely prominent within the social exclusion subject (Lodovici and Torchio (2015)), that being the case, it was the chosen focus group for this work. However, this project aims to help socially include as many groups as possible, henceforth, the disabled and people with reduced mobility (i.e. pregnant women, cane or crutches users, people with visual problems, the handicapped, etc.) will also be at target.
As living conditions, standards and medical progress improves, people’s life expectancy is increasing everywhere around the world. In 2017, 962 million people were 60 years old or over, which is substantially more than in 1980, where the numbers were around 382 million worldwide. The alarming number comes a few years later, 2.1 billion people are expected to be 60 years old or over in 2050, that is almost one third of the current earth population. Moreover, in 2030, the number of older people in the world is foreseen to surpass children under the age of 10 (1.41 billion and 1.35 billion respectively) (United Nations and Affairs(2017)).
Mackett(2014) states that as people age, there is an increased risk of mental health problems that follows, adding this to physical and sensory deterioration like vision loss, reduced mobil-ity and hearing problems, the elderly face various barriers that might seem quite ordinary for a youngster or a person with good mobility.
Soltani et al.(2012) assures that public transport terminals lack good design and facilities, promoting less accessibility, specially for groups with mobility related issues. However, the de-velopment of information interfaces that are able to demonstrate certain areas of the terminal would have a major impact on the accessibility problem, given that it would help the users get a better orientation through the terminal.
A number of age-related changes and what consequences they bring into mobility have been recognized by various researchers. Reduced flexibility and strength; impairment of visual percep-tion; and an increase in bone fracture vulnerability are a few examples. A survey conducted by
infas & DLR(2008) found out that, as people get older, there is a tendency to decrease driving habit, which promotes an increase in walking and public transport use, particularly after the age of 74. Consequently, the quality in public transports is a key factor regarding the mobility of the elderly. With the intention of enhancing that experience, there should be an effort to not only focus on the physical realm (e.g. better seats, air conditioner, better bathrooms), but also on software applications, simply because of the fact that they can provide exclusive and important information to the user.
3.3
Public transport information
Aging related diseases can provoke sever damage in the humans basic organs and lead to defec-tiveness such as: hearing loss (presbycusis); decrease of visual acuity (presbyopia); muscle loss; lower walking speed; mobility disability; cognitive aging; dementia; and depression (Efraim Jaul,
2017). This means that physical obstructions as be steps, edges, steep lopes or simple obstructions on the pavement take a role on stopping the elderly and mobility reduced people from accessing public transports. These aspects must be considered for the future interfaces that will be developed based on the mock-ups that this work will build.
Follmer et al. (2008) conducted a survey that affirmed that shopping and leisure are the two most prominent motives for people above the age of 60 to travel. Many facilities such as food shops, libraries and town centres are believed significant for this group to have easy access to, be-ing the healthcare services considered extremely important in this matter (Hounsell et al.(2016)). However, the information must be provided according to the needs of each profile. Fontes et al.
(2018) demonstrate a simple example of the information that can be divulged to a certain user in a journey planner application by utilizing illustrative cases. This work might use that idea in order to simplify the understanding and promote examples of information that should be given to socially excluded people.
With these two important factors in mind, it is possible to understand slightly better the in-formation that should be exposed to the group that is being taken into consideration, which is the elderly and the people with reduced mobility. Additionally, this data must be concise and clear, so the user won’t have any problem perceiving the information.Hounsell et al.(2016) state that a wide range of information may be needed to attend the user necessities, namely:
• Bus and tram networks and routes;
• Stop locations, like bus stops, in order to promote a better overall intermodal experience; • Schedule timetable of all the PT services, including weekdays, weekends and holidays; • Ticket price for each trip;
• Method of payment;
• Physical requirements to use the PT.
All the types of information stated above can be considered significant but, at the same time, it exists several levels of utility that are directly related to each individual’s needs, for example, a commuter with reduced mobility is particularly interested in the accessibility of the vehicles (e.g. if it has ramps, seat belts) as well as a method to buy a ticket online in order to reduce as much walking as possible. On the other hand, a user with sight problems might have a hard time seeing the letters or numbers and also colors, so the information has to be provided in a simple and intuitive way, utilizing icons and distinct colors to improve contrast, in this case the information
that would matter the most would be, for instance, if there are any crosswalks near the stop station with an integrated sound system, or which direction to take after leaving the subway to go to the nearest elevator or automatic stairs.
This work will not only have in consideration the information that Hounsell et al. (2016) presented, but it will also try to include other types of data that may be essential, such as a portion of a map containing the stop station, to ensure that a user is able to see the crosswalks, traffic lights, elevators, stairs and ramps nearby.
3.4
User-centered design
A human-centered design consists of an approach to interactive systems development that focuses on making the systems usable and useful in order to provide a good service to the user needs and requirements. This enhances efficiency as well as effectiveness of the interface and promotes well-being, satisfaction, accessibility and sustainability to the user (SAITO and OGAWA(2011)). The standard known today as ISO 9241-210 aims to ensure that the design created for an interface is user-centered, it consists of 6 principles (Travis(2011)):
• The design is based upon an explicit understanding of users, tasks and environments - this principle affirms that in order to produce a good outcome, it is needed to understand the users, what they want to do with the system and the environment in which the system will be used.
• Users are involved throughout design and development - this means that it is important to include the users in the development process and not only in a focus group at the beginning, and in a survey at the end. However, this work will not have this principle into account because it lacks a steady group of people to include in the process, there will be a focus group and a survey to acquire information to help develop the mock-ups.
• The design is driven and refined by user-centred evaluation - this states that usability testing should be included in the design process, despite that, as it was stated before, there is not a solid group of people who are integrated in the project, therefore this principle, as important as it is, will be skipped.
• The process is iterative - It is important to develop and design the mock-ups with the idea that it is quite impossible for a user to explain what they want from a system. It is required to show people examples of interfaces that were already developed and begin to improve from there.
• The design addresses the whole user experience - making things simple is not just what usability is about, it requires other aspects such as perceptual and emotional that are typically associated with user experience.
• The design team includes multidisciplinary skills and perspectives - in a team, it is necessary to include a wide rage of views to produce the best outcome.
It is should be mentioned that ISO 9241-210 is considered an evolution from another standard called ISO 13407, which had the same objectives as the newer version, being a description of good practice in user centered design. It was used to provide guidance on design activities that occur throughout the life cycle of human-machine systems. The main goal of this standard is to guarantee that the development and use of these systems take into consideration the needs of the user.
InFigure 3.1is it shown the interactive and iterative process that ISO 13407 strictly follows, it is composed of five stages. The first one states that it is important to collect relevant data in the context of where the system will be used. The second phase is to formulate the requirements needed for the development of the product. In the third stage it is emphasized how important it is to create simulations and mock-ups to acquire feedback from the users. The last stage the work that has been developed is confronted with all the requirements, in order to find defects and try to create the best solution for the system.
Figure 3.1: ISO 13407 interactive design process.
All these principles will serve as recommendations in this project’s development, however, as stated above, some will not be able to be applied, therefore, with the finality of creating the best possible outcome with the resources that were allocated to this work, three main steps were selected:
1. Requirements elicitation - recognize, analyze and choose which group to focus was part of the project. In chapter2, section2.2, it is possible to find all of the groups currently in, or in risk of, social exclusion. The people with reduced mobility, specifically the elderly and
the disabled were chosen. In this step, there was also a need to do a requirements elicitation through an inquiry and interviews.
2. Interface development - this phase represents the design of the mock-up interfaces, taking into account the requirements that were dictated by the previous step.
3. Validation - usability and design evaluation of the interfaces developed. This was done by conducting an inquiry to the population and a 1 hour session with experts in application development to public transports.
3.5
Usability
The usability of an interface is closely associated with how easy it is for a user utilize it, it can be considered a quality attribute. Nielsen(2012) states that usability can be defined by 5 quality components:
• Learnability: How easy is it for users to accomplish basic tasks the first time they encounter the design?
• Efficiency: Once users have learned the design, how quickly can they perform tasks? • Memorability: When users return to the design after a period of not using it, how easily
can they reestablish proficiency?
• Errors: How many errors do users make, how severe are these errors, and how easily can they recover from the errors?
• Satisfaction: How pleasant is it to use the design?
He also talks about another quality attribute, namely utility. it is important to make a remark-able distinguish between utility and usability: the first one is referred to the design’s functionality, and it has to answer the question: "does it do what users need?"; the second one, as stated above, basically refers to how easy and pleasant it is to use the features that the interface provides.
This work will focus solely on the usability of the mock-up interfaces, which means that, if an application is developed utilizing the interfaces created by this project, these should be easy and pleasant to use.
In a more recent document,9241-11(2018) has stated that "usability is a more comprehensive concept than is commonly understood as "easy-to-use" or "user friendliness"". Also, in the same document, usability relates to the outcome of interacting with a system, product or service, and it is not an attribute of a product. They also affirm that usability is relevant to a couple things, such as:
• Regular ongoing use, to enable users to achieve their goals effectively, efficiently and with satisfaction;
• Learning, to enable new users to be become effective, efficient and satisfied when starting to use a system, product or service;
• Infrequent use, to enable users to be effective, efficient and satisfied, with the system on each reuse;
• Use by people with the widest range of capabilities;
• Minimizing the risk and the undesirable consequences of use errors; and
• Maintenance, in that it enables maintenance tasks to be completed effectively, efficiently and with satisfaction.
Additionally, 9241-11(2018) state that usability is prominent when designing or evaluating interactions with a certain system, service or product, with the finality of: development; procure-ment; review or comparison; and marketing and market research.
In this line of thought, and as it was stated before, the use of usability in this project will be towards developing mock-up interfaces that are easy to use, pleasant and simple with the goal of obtaining the maximum usability.
Requirements elicitation
This chapter will cover in detail how the requirements for the development of the mock-up inter-faces were achieved. The sections ahead will analyse the results of several interviews and of an inquiry that were conducted with and without mobility disabilities that utilize public transports and own a smartphone.
4.1
Introduction
In chapter2.3were stated a few ideas referring to what kind of information is lacking in public transports that should be disclosed to mobility reduced public transport users. Nonetheless, most of these ideas are somehow subjective and not deepened enough to truly understand what is in fact missing in the information that is currently being spread to the travellers. For instance,Hounsell et al.(2016) state that bus networks and routes is essential information to provide older people, but in fact, that type of information is significant to any individual who utilizes public transports.
The real problem that is being treated here is: how that information should be handled and provided in order to be easily perceived. Therefore, the interfaces should not, for example, merely describe a bus network and the fastest route, as a matter of fact, equivalent to whatSchlingensiepen et al.(2015) state, they should provide the traveller information about routes that meet their in-dividual capabilities, needs, preferences and restrictions; these range from avoiding overcrowded buses to the inability of stair usage or simply having trouble understanding complex subway, bus or train stops.
After understanding what kind of information is lacking in route planners towards socially excluded groups in public transports, namely the ones with with reduced mobility, it is important to point out, in an initial proposal, what kind of requirements the interfaces should bear. Thus combining whatHounsell et al.(2016) and Schlingensiepen et al.(2015) stated, the conclusion was:
1. Vehicle - besides simply informing at which times the public transport arrives in each travel route, it is important to establish differences in the type of vehicles that are touring through these same routes; this means that there should be a focus on providing information about
the public vehicles that, for instance, pass through a certain bus stop, considering that these may or may not have the proper equipment for wheelchair users.
2. Stop/station - additionally to what is referred in the first requirement, it is crucial to help people with reduced mobility locate themselves in subway stations or other locations that are part of the journey they’re currently in, for example, in which side of the street is the stop; therefore, information about how to get to a certain station and, if needed, where to go once inside it will be present in the interfaces.
3. Pavement - while trying to access a station or moving inside it, information such as the location of automatic stair cases, elevators, bathrooms, ramps, steps and crosswalks with light and sound signals need to be considered for people with reduced mobility.
4. Schedule - when travelers are on a station/stop waiting for a public transport or already in a vehicle they should be warned about multiple events that are happening or will happen in a near future, for example when to leave the vehicle, which stop comes next, how much time until the connecting vehicle arrives and which vehicle to enter and when.
5. Ticket price and purchase - this requirement speaks for itself; if a person is able to pur-chase a ticket in an app, it will reduce moving.
These will be the information requirements to apply in the interfaces that will be developed. Overall, if these features were to be implemented in a journey planner at this point in time, the app would have a great chance of succeeding within the groups with difficulties in locomotion.
4.2
Data collection
We collected data from public transport users through interviews and an inquiry. Data collection was performed in a public transport network from a medium sized metropolitan area (Porto, Por-tugal). This network is distributed along 1,575 km2 and split into 26 zones, it serves 1.75 million inhabitants. The network is based on an intermodal system that includes: 126 buses lines (urban and regional), six subway lines, one cable line, three tram lines and three train lines (TIP,2015). Sections 4.2.1 and 4.2.2 presents the design of the interviews and the inquiry respectively.
4.2.1 Interviews
The interviews were carried informal and anonymous to travellers from public transport of the Metropolitan Area of Porto, these. Two main requirements for carrying the interview were de-fined: the first one being the use of public transports and the second one being the use of a smart-phone. All participants received information about the purpose and aims of the study and signed an informed consent form.
The questions of the interviews were grouped in two main groups: (i) individuals personal use of public transport; and (ii) experience of using a route planning application and the script was as follows:
1) Which modes of public transportation do you utilize and how often?
2) What is the average time of each trip?
3) How do you get information about the schedule?
4) Name one positive and one negative factor about public transports.
5) Do you utilize a route planning app?
6) If the individual said no to question 5, then:
(a) For any specific reason?
(b) What information would you like to receive in order to make use of a journey planner?
7) If the individual said yes to question 5, then:
(a) Which application do you use?
(b) Which information do you retain as most important? (c) What attracts you the most about the design?
(d) Which features do you consider very important in the app? (e) Which features would you like to see included in the app?
The first four questions were made with the intent of testing the waters, with the finality to understand if the person had experience and some sort of criticism towards public transports. The answer to question number 5 indicated if the person made use of a route planning application; if the answer was no, then questions 6 a) and b) were proposed, otherwise questions 7 a), b), c), d) and e) were suggested. The questions 6 a) and b) had the goal of acquiring information about the reason behind the disuse of a route planning app, and what kind of changes the person considered fundamental that could be implemented in said application in order to make use of it. The remaining questions, namely 7 a), b), c), d) and e), were oriented towards understanding why the person used the app, what kind of use was being made of it, and lastly what information would the person like to receive, other than what was already being revealed. The last questions were the most important and were a decisive key factor in discovering more requirements that could be adjusted and implemented in the development of the interfaces.
Even though the interview followed a script, sometimes it was required to create simple imagi-nary scenarios to place the person in a situation where they did not know the route to a destination, all this to achieve a more developed answer in how they would use the application, more precisely what features would matter the most, what information they would seek and how they would like the information to be presented (i.e. icons or sentences). The scenarios were:
• a new shopping mall just opened and the person is interested in seeing it, this scenario will allow us to extract information about which the person will use to find the route towards the mall. It will also inform us of which transports is preferable to the individual;
• it is summer, and on a holiday the person decides he/she wants to go to the beach. Normally, summer weather is hot and many people tend to use public transports to visit the beach for refreshment, the information we are looking for with this example is, in people’s opinion, which transports would be more suitable for trips in a heat climate;
• a trip to work was also a scenario that had the finality of knowing what transports people use the most, and what bothered them while in that trip (i.e. overcrowd, loudness, heat, etc.).
4.2.2 Inquiry
The inquiry that was made was composed of four short sections, namely: 1. General approach and basic requirements;
2. Route planning usage; 3. Application disusage; 4. Application improvement.
The first section was composed of questions that had the intent to filter if the user met the base requirements needed to answer the inquiry, i.e. to use public transports and a smartphone. After answering the first section, the person would be directed to section two, which was composed of only one question which had the finality of letting us know if the person used any application capable of route planning, checking schedules and ETA’s within the public transport theme. The third and fourth sections appeared depending on the answer to the previous question in section two, that is to say if the person did not make use of an application it would be directed to the third section, otherwise, section four would appear. The third section had the objective to understand why was the person not making use of a route planning application (or just to check schedules and ETA’s), and if it could provide feedback on what features and information would be important to implement in these apps so that it would make the person start using them.
The inquiry can be found inTable 4.1, where the questions that have "-" as possible answer were open questions and the all the others were either multiple choice or single choice. The most important parts of the inquiry are the third and fourth sections, which were created to understand why people use or not use route planners and if they have any kind of suggestions and ideas related to information and features that can be implemented in future software developments.