IMPLEMENTING A BUSINESS INFORMATION SYSTEM TO IMPROVE
THE QUALITY ASSURANCE MECHANISMS IN A PORTUGUESE
HIGHER EDUCATION INSTITUTION
P. MORAIS
1, F. CASTRO LOPES
21
Univ Portucalense,
Research on Economics, Management and Information Technologies –REMIT
(Portugal)
2
Univ Portucalense,
Research on Economics, Management and Information Technologies –REMIT
(Portugal)
Abstract
Higher education institutions (HEIs) face, nowadays, enormous challenges to be competitive in a global world. The competitive environment means that HEIs, like other organizations, must be concerned with evaluating and monitoring their strategic objectives.
Business Information (BI) systems combine different sources of information, from different information systems (IS), with analytical tools to present competitive information to planners and decision makers. In this way, BI systems emerge as tools that allow institutions to create future competitive advantages. This paper presents a case study of a Portuguese HEI, describing the implementation of a BI system to support the quality assurance system, and to improve its future strategy. This study focuses on one of the three HEI mission vectors: Teaching and Learning.
As a result of this work, it was possible to parameterize the BI system, and to identify the digital information missing in the IS, and the necessary developments to collect it.
Keywords: Business Intelligence Systems, KPI, BI, HEI, performance indicators, learning and teaching.
1 INTRODUCTION
The interest in using key performance indicators (KPIs) by HEIs has grown in the last two decades, based on the HEIs self-awareness that quality is a holistic and critical success factor that needs to be measured. KPIs are quantifiable values that can show how HEIs are achieving their institutional objectives.
Some guidelines and rules about KPIs in HEIs have been developed by different organizations [1]–[3] Although each institution should select the right set of KPI according to its specific strategy, two general points warrant emphasis:
First, HEIs should use KPIs for different purposes: 1) to monitor their performance and strategy;
2) to assist the assessment and evaluation of their processes in a holistic way; 3) to provide information for external quality assurance audits;
4) to inform all the stakeholders about the status of the institution.
Second, that there are two prerequisites for developing a successful KPIs system: 1) an explicit institutional quality policy and plan;
2) the existence of IS that can provide the necessary information to feed the indicators.
The efficient use of KPIs should be supported by dashboard reporting information systems (IS). There are different types of IS to monitor organizational performance and support decision-making. In the last years, Business Intelligence (BI) systems have been adopted by different kinds of organizations, allowing the collection of pertinent information and its conversion into knowledge upon which actions can be taken. HEIs are using BI systems in different contexts to create KPIs dashboards supporting the decision process at different institutional levels.
This paper presents a case study of a Portuguese HEI, describing the implementation of a BI system to support the quality assurance system, and to improve its future strategy. This study focuses on one of the three HEI mission vectors: Teaching and Learning.
The project followed different steps: mission, strategy and processes analysis, KPIs identification, KPIs validation by the process owners, identification of the IS in use in the institution, identification of the existence of the necessary information in these systems, definition of the access profiles, according to the different process users and the selection and implementation of the BI technological solution.
A set of KPIs was defined through a literature review, the guidelines and rules from different organizations (EUA, UNESCO and the national HEI Evaluation and Accreditation Agencies), international standards, and the institution's vision and mission, as well as the first-hand knowledge and personal experience of the authors, owing to 12 years of management roles in the Teaching and Learning vector processes.
The paper is divided into six sections. The second section presents a literature review of KPIs in HEIs. The third one discusses the use and advantages of BI systems. The HEI is described in the fourth section, and the case study is detailed in the fifth section. The last section presents the main conclusion and ideas for future work.
2 KPI IN HIGHER EDUCATION INSTITUTIONS
The use of KPIs in HEIs is not new and in the 1980s much work was done on this subject [4], [5]. In 2001, UNESCO produced a study on higher education performance indicators, following the 1998 World Conference on Higher Education [2].
In Europe, the subject of quality assurance in HEIs gained particular relevance with the recommendation 98/561/EC, adopted in 1998 by the Council of the European Union, on the introduction of quality assurance mechanisms in all European Union countries.
The interest in this theme has grown in the last two decades, based on the HEIs self-awareness that quality is a holistic critical success factor that needs to be measured, also due to the increasing demand for quantifiable evidence that higher education is worth the cost.
Today many countries possess a set of indicators, which allow the assessment of the degree to which HEIs reach their goals; these dashboards result from guidelines and rules from different organizations (EUA, ENQA, UNESCO, HEIs Evaluation and Accreditation Agencies) and international standards [6]– [10].
Although having different characteristics, an indicator system aims to inform all the stakeholders on the status of the HEI, monitor its progress and manage it [1], [11]. Furthermore, it should cover all the processes supporting the HEI mission: teaching and learning, research and interaction with society. When developing KPIs systems, different factors should be considered to ensure that, they really bring value to the institution: they must be aligned with the institutional strategy and its objectives; they should require data that can be easily obtained; such data should be reliable and accurate; and they must be actionable.
3 ADVANTAGES OF BI SYSTEMS
IS have been shown to be relevant for organizations to monitor organizational performance and support decision-making, existing different types of systems: from the early MIS (Management Information Systems) through DSS (Decison Support Systems), EIS (Executive Information Systems), GDSS (Groupware Decision Support Systems) and the more recent Business Intelligence (BI) systems.
Initially, MIS treated operational data and arranged them into predefined reports, DDS already incorporated decision models to help decision-making, and EIS related the operational data resulting from the day-to-day activity of organizations with external data to support executive decision-making. BI is a broad category of applications and technologies for gathering, providing access to, and analyzing data for helping enterprise users make better business decisions [12]–[16].
BI systems stand out from the aforementioned systems by using simple or complex techniques of data statistical analysis, neural network techniques, techniques to access large volumes of data from various types of sources in real time, and databases with dimensions of aggregation and navigation, as well as graphic and web interfaces with the end user.
In BI systems, data from different sources are stored in an integrated data warehousing. This data can come from databases of the organization's other information systems, spreadsheets, external files from other organizations, or partners and the Internet.
The analytical capabilities of BI systems can revolutionize organizations and enable them to leverage the potential of historically stored data
These systems are also characterized by the fact that end-users can have a non-technical profile and be able to perform the analytical analysis of the data autonomously, providing them with the knowledge they need.
BI systems are changing the ways organizations manage and make decisions and carry out their tasks [16]. According to Gartner Group, analytical capabilities will remain a strategic technological trend in providing organizations with intelligence (https://looker.com/gartner-magic-quadrant), which attests to the usefulness of systems with such capabilities.
4 HEI CHARACTERIZATION
Universidade Portucalense (UPT) is a private HEI created in June of 1986, located in Porto (Portugal). UPT is organized into five Departments: Law; Economics and Management, Science and Technology; Heritage and Tourism; and Psychology and Education, teaching 1st, 2nd and 3rd cycle, as well as non-degree programs. Today UPT has 3000 students. As a private institution, its main governance structure is divided into a Board and a Rectory.
The University has unambiguously assumed the principle that quality and quality assurance are one of the fundamental vectors for its operation and development.
Having its continuous improvement in mind, the University has implemented an internal quality assurance system (IQAS). In this context, the University decided, at first, to focus on Quality Certification through the implementation of NP EN ISO 9001:2008 The system was certified in December 2014. During the year 2017, the new NP EN ISO 9001: 2015 was implemented, and the system is now certified by this standard.
In 2017 UPT submitted its IQAS to a certification process by the Portuguese Agency for Assessment and Accreditation of Higher Education - A3ES; the system was certified for six years, in December 2017.
The IQAS includes, among others, the monitoring of processes as a way of continuously improving UPT's activities. UPT has identified its processes and has established methods for their operation, control and monitoring, which are reflected in the process map contained in the quality management manual and in the performance monitoring plan which already includes a set of KPI. The processes are the matrix of the structure of the IQAS, and its performance measure is decisive for UPT quality assurance.
The process map was built following the Porter idea of the value chain, and is divided into primary and support processes. There are seven primary processes: Marketing and Communication, Design and Development, Teaching Management, Innovation, Research and Development, Application Management, Enrollment Management, and Skills and Careers Management.
5 CASE STUDY DESCRIPTION
The BI implementation process went through several stages: i) analysis of the business processes, as well as of the HEI's mission and strategy; ii) analysis of the pre-existing indicators for each processes; iii) literature review to identify and define the KPIs; iv) KPI validation by the members of staff responsible for each process and ensuing adjustments to the list of KPIs resulting from the validation; v) identification of the information systems implemented by the institution; vi) analysis of the information systems to identify the necessary information sources for the KPIs; vii) definition of the users access profile, and viii) selection and implementation of BI technological solution.
1. Analysis of business processes and the institution’s mission and strategy
All the processes are already properly modeled in accordance with the IQAS. Therefore, this phase consisted in the detailed analysis of the five processes supporting the Teacher and Learning vector, selected to start the BI implementation, which are: Design and Development, Application Management, Enrollment Management, Teaching Management, and Skills and Career Management. 2. Analysis of existing indicators
The authors analyzed several existing internal documents, such as performance monitoring plan, activity plans and reports, rectory decrees and regulations to identify the KPIs already used by the institution. The identified KPIs were associated with their specific process and goals.
3. Literature review and definition of the KPIs
The existent KPIs list was updated based on the literature review, the HEI KPIs purpose and taking into account the authors' management and teacher experience. This work resulted in a list of KPIs for each process under analysis in this case, showing also its goals.
4. Validation and redefinition of KPIs
The list of KPIs was sent to the institutional CEO for distribution to the staff members responsible for each process, to ensure that they cover all present and future needs of the institution. After reflection and individual analysis, the CEO met with the authors to approve the final list of KPIs that will be implemented. The discussion led to the introduction of two new KPIs, the elimination of one KPI and the change of the designation of three. The final list is presented in Tables 1 to 5.
5. Identification of the information systems implemented by the institution
The authors met with the director of the information systems area, and all the information systems currently implemented in the institution were inventoried. Only three (SIUPT, MOODLE and PHC) give support to the Teaching and Learning vector.
6. Analysis of the sources of information needed
Following the validation and reset phase of the KPIs, together with the IS director, the authors identified which systems feed each of the considered KPIs. Tables 1 to 5 present this information. 7. Definition of the user’s access profile
The responsible for each process/activity are defined in the IQAS. Those are: CEO, Rectory, Pedagogical and Scientific Councils, Head of Departments, Course Coordinators, Teachers, Admissions Office Coordinator, Enrollment Office Coordinator, and Student Support Office Coordinator. According to the different roles, the access permissions to the BI systems were defined. 8. Selection and implementation of BI technological solution
There are several technologies in the BI domain that could be used for the implementation of this project. Qlik Sense software was selected based on two factors: Gartner's magic quadrant for BI solutions and the knowledge of UPT's IS development team. Some dashboards have already been developed, and a first presentation was made to the CEO.
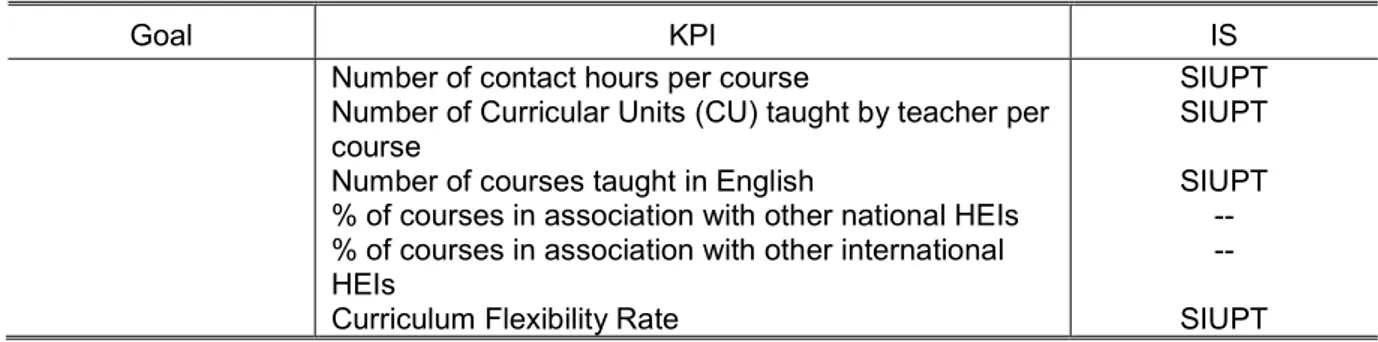
Table 1. Design and Development process: KPIs list by goal, showing IS support.
Goal KPI IS Enhance effectiveness and profitability in the development of new course offerings
Number of new degree courses
% of weight of the new course in total applicants Number of new non-degree courses
% of evolution of applicants in the new courses in years N and N-1
% of courses accredited by A3ES
Number of undergraduate degree courses discontinued
Number of non-degree courses discontinued Number of degree courses
Number of non-degree courses
Nº of courses offered by more than one Organic Unit
SIUPT SIUPT -- SIUPT Excel SIUPT -- SIUPT SIUPT SIUPT
Goal KPI IS Number of contact hours per course
Number of Curricular Units (CU) taught by teacher per course
Number of courses taught in English
% of courses in association with other national HEIs % of courses in association with other international HEIs
Curriculum Flexibility Rate
SIUPT SIUPT SIUPT -- -- SIUPT Table 2. Application Management process: KPIs list by goal, showing IS support.
Goal KPI IS
Enhance the search and entry
qualification in the course
Number of vacancies by access type Nº candidates by access type % of candidates by access type
% of candidates relative to the number of students % of evolution of applicants in each course in years N and N-1
Minimum entrance mark by course Average entrance mark by course Maximum entrance mark by course
% of 1st cycle candidates by entrance exam % of 1st option candidates
% of candidates by geographic origin % of candidates for non-degree courses by geographical origin
Number of candidates by non-degree course % of candidates for non-degree course by qualification SIUPT SIUPT SIUPT SIUPT SIUPT SIUPT SIUPT SIUPT SIUPT SIUPT SIUPT -- SIUPT -- Table 3. Enrollment Management process: KPIs list by goal, showing IS support.
Goal KPI IS
Maximize the filling of vacancies by course
% vacancies filled by access type % of 1st option enrollment % of new 1st year students
% of new 1st year students at UPT Nº of enrollments by access type
Total number of 1st year students by entrance exam Enrollment Fee Rate
Number of 1st time enrollments
Number of students enrolled in cycle n + 1 who completed cycle n at UPT
Number of students by non-degree course
SIUPT SIUPT SIUPT SIUPT SIUPT SIUPT SIUPT SIUPT SIUPT SIUPT Knowing students' characteristics
Number of students enrolled by gender Number of students by age
Number of students by geographic origin in Portugal Number of students by nationality
Number of students by socioeconomic origin of parents - schooling
Number of students by socio-economic origin of the parents - professional situation
Number of students displaced from their permanent residence
Number of students with special needs
Number of students enrolled per curricular year Number of students who canceled the enrollment Number of students due to cancellation of enrollment
SIUPT SIUPT SIUPT SIUPT SIUPT SIUPT SIUPT -- SIUPT SIUPT Excel
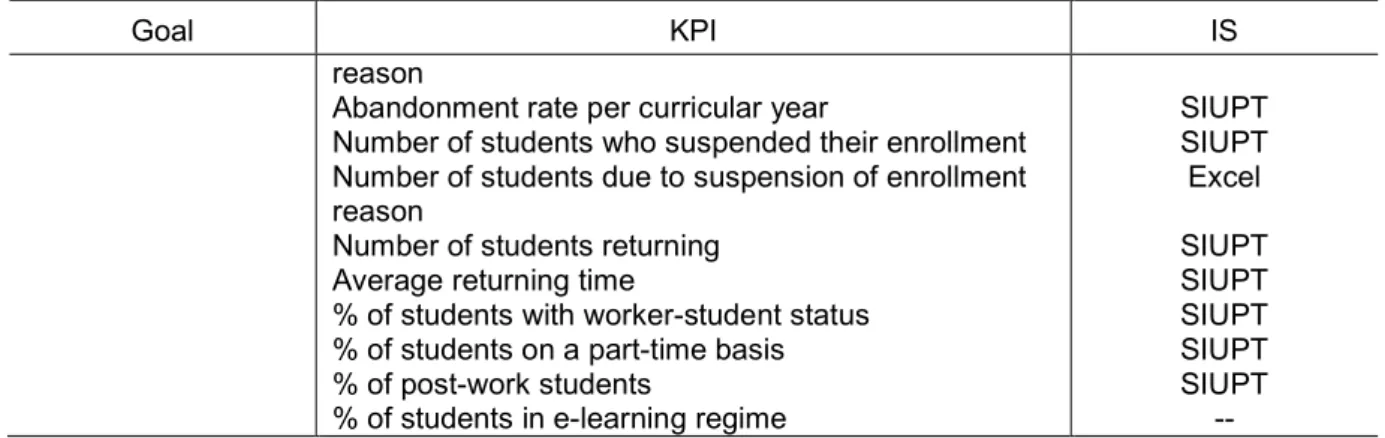
Goal KPI IS reason
Abandonment rate per curricular year
Number of students who suspended their enrollment Number of students due to suspension of enrollment reason
Number of students returning Average returning time
% of students with worker-student status % of students on a part-time basis % of post-work students
% of students in e-learning regime
SIUPT SIUPT Excel SIUPT SIUPT SIUPT SIUPT SIUPT -- Table 4. Teaching Management process: KPIs list by goal, showing IS support.
Goal KPI IS
Availability of teachers
% of students by full-time equivalent (FTE) teacher % of students by FTE PhD teacher
% of students by non-teaching staff Total number of teachers
Total number of full-time teachers Total number of FTE teachers % own teaching staff
% full-time PhD teachers in the fundamental training area(s) of the study programme
% part-time PhD teachers in the fundamental training area(s) of the study programme
% full-time teachers with doctorates in other areas of the study programme
% part-time teachers with doctorates in other areas of the study programme
% PhDs specialized in the fundamental areas of the study programme
% of full-time teachers in the study programme, whith a UPT link for more than 3 years
% of faculty members enrolled in doctoral programs for more than 1 year
SIUPT SIUPT SIUPT SIUPT; PHC SIUPT SIUPT SIUPT Excel Excel Excel Excel Excel PHC Excel Enhancing Student Performance
Average number of enrollments by curricular year Average number of registrations up to the end of the course
% of approvals by CU (relative to the total number of students enrolled)
% of approvals by CU (relative to the total number of students who completed evaluation)
% of students enrolled in the first year, for the first time, with approval in at least 75% of the number of ECTS in which they were enrolled
Average grade per CU
% students by grade range, per CU % of students assessed, per CU
Number of 2nd cycle projects / dissertations / internships started
Number of 2nd cycle projects / dissertations / internships completed
Average number of years to finish 2nd cycle project/ dissertation /internship
Number of 3rd cycle thesis started Number of 3rd cycle thesis completed
Average number of years to finish 3rd cycle thesis
SIUPT SIUPT SIUPT SIUPT SIUPT SIUPT SIUPT SIUPT SIUPT SIUPT SIUPT SIUPT SIUPT SIUPT
Goal KPI IS Promoting complete
student education
Number of students participating in extracurricular activities
Number of extra-curricular activities offered % students participating in volunteer projects
-- Excel Excel Maximize teaching efficiency % of graduates in N years % of graduates in N + 1 years % of graduates in N + 2 years % of graduates in> N + 2 years Total number of graduates Average course grade
% graduates at each range of the European ECTS scale SIUPT SIUPT SIUPT SIUPT SIUPT SIUPT -- Pedagogical performance % CU in mixed evaluation
% CUs under continuous evaluation % CUs in final evaluation
CU Student Satisfaction degree Teachers Student Satisfaction degree CU overall satisfaction index
Teacher satisfaction index
% of CUs with very favorable evaluation by students % of CUs with less favorable evaluation by students % of teachers with very favorable evaluation by students
% of teachers with less favorable evaluation by students
Number of students enrolled by CU Number of students per class
Number of students per teacher per CU % CUs using MOODLE
Average number of students attending classes No. of orientations in projects / dissertations / theses by teacher
% classes taught by CU and teacher
% of re-scheduled classes by teacher and CU % of classification terms issued on time % of summaries registered
% of summaries registered on -time
% of completed CU self-assessment surveys % of CU self-assessment completed on time Rate of success of learning objectives by course Degree of adequacy of teaching methodologies
SIUPT; MOODLE SIUPT; MOODLE SIUPT; MOODLE SIUPT SIUPT SIUPT SIUPT SIUPT SIUPT SIUPT SIUPT SIUPT SIUPT SIUPT MOODLE SIUPT SIUPT SIUPT SIUPT SIUPT SIUPT SIUPT SIUPT SIUPT -- -- Maximizing graduates employability
% of graduates who obtained employment in the study area
% of graduates who have obtained employment in other areas
% of graduates who have been employed for up to 1 year after completing their studies
% of graduates who obtained employment at the time of completion of their studies
Number unemployed versus graduates
Average time for 1st place after graduation (months) Average value of remuneration in 1st job
% of employability by graduation job
Number of registered graduates in the employment center
Employer satisfaction level
Excel Excel Excel Excel -- Excel -- -- -- --
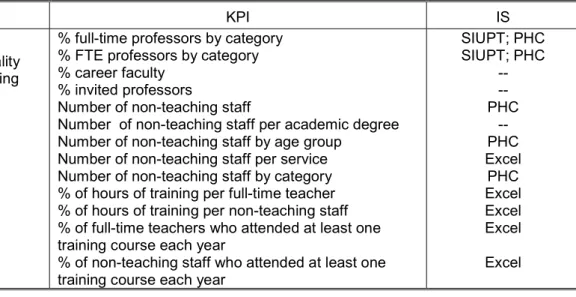
Table 5. Skills and Careers Management process: KPIs list by goal, showing IS support.
Goal KPI IS
Ensure the necessary quality skills for teaching
% full-time professors by category % FTE professors by category % career faculty
% invited professors
Number of non-teaching staff
Number of non-teaching staff per academic degree Number of non-teaching staff by age group
Number of non-teaching staff per service Number of non-teaching staff by category % of hours of training per full-time teacher % of hours of training per non-teaching staff % of full-time teachers who attended at least one training course each year
% of non-teaching staff who attended at least one training course each year
SIUPT; PHC SIUPT; PHC -- -- PHC -- PHC Excel PHC Excel Excel Excel Excel
6 CONCLUSIONS
The development of this project has revealed some difficulties and limitations.
The first difficulty regards the identification of the systems that feed each KPI. The institution does not have a completely integrated IS, and many different systems, using different data formats, coexist. Moreover, some activities are still supported by personal Excel sheets. This analysis enabled the identification of IS development needs.
As usual in any BI implementation, the need to clean the data arises. Accordingly, policies were defined to minimize data errors, such as the typification of data, wherever possible.
It was also observed that the institution does not collect the necessary information to support some of the identified KPIs. This limitation highlighted the need to redesign some processes and simultaneously create the necessary digital support.
Despite these constraints, it can be argued that the implementation of BI has been a success because, first, it has already provided useful dashboards for management and, second, the initial outcomes have contributed to identifying possible improvements to the quality assurance mechanisms, which should, in turn, facilitate the institution’s continuous improvement process.
In short time, the future work includes the parametrization of all the other processes in Qlik Sense and the presentation to all the users. Considering that, the process of Social Responsibility and Sustainability is not, yet, modeled in IQAS, the full process KPIs identification will take place as soon as possible.
REFERENCES
[1] M. Martin and C. Sauvageot, “Constructing an indicator system or scorecard for higher
education: A practical guide,” 2011. Retrieved from
http://uis.unesco.org/sites/default/files/documents/constructing-an-indicator-system-or-scorecard-for-higher-education-a-practical-guide-2011-en.pdf
[2] J. Fielden and K. Abercromby, “UNESCO higher education indicators study: accountability and international co-operation in the renewal of higher education,” Commonwealth Higher Education Management Service (CHEMS), 2001.
[3] F. Tavenas, “Quality assurance: a reference system for indicators and evaluation procedures.” EUA: European University Association, 2004.
[4] G. Gaither, B. P. Nedwek, and John E. Neal, “Measuring Up: The Promises and Pitfalls of Performance Indicators in Higher Education,” 1994.Retrieved from https://eric.ed.gov/contentdelivery/servlet/ERICServlet?accno=ED383279
[5] J. Sizer, A. Spee, and R. Bormans, “The role of performance indicators in higher education,” High. Educ., vol. 24, no. 9, pp. 133–155, 1992.
[6] I. Hovland, “Knowledge Management and Organisational Learning : An International Development Perspective An Annotated Bibliography Ingie Hovland,” Development, no. August, 2003.
[7] F. Daneshgar and L. Bosanquet, “Organizing Customer Knowledge in Academic Libraries,” J. Knowl. Manag., vol. 8, no. 1, pp. 21–32, 2010.
[8] M. H. Mauro, M. A. Gaspar, F. K. Ohashi, F. L. F. de Magalhães, and M. V. Cardoso, “Contribuição do Sistema de gestão de aprendizagem (LMS) para a gestão do conhecimento corporativo,” Rev. Iberoam. Educ. Vol 74, Iss 1, Pp 99-118, vol. 74, no. 1, pp. 99–118, 2017. [9] A3ES, “Indicadores de Desempenho para apoiar os processos de avaliação e acreditação de
cursos.” A3ES, 2010.
[10] D. Chalmers, “A review of Australian and international quality systems and indicators of
learning and teaching,” 2007. Retrieved from
http://citeseerx.ist.psu.edu/viewdoc/download?doi=10.1.1.169.3919&rep=rep1&type=pdf [11] H. Pinto, “Sistema de indicadores de desempenho para instituições do ensino superior
português,” Mestrado em Engenharia da Qualidade e Ambiente, Instituto Superior de Engenharia de Lisboa, 2016.
[12] J. Ranjan, “Business Intelligence: concepts, components, techniques and benefits,” J. Theor. Appl. Inf. Technol., vol. 9, no. 1, pp. 60–70, 2005.
[13] T. Nobre, A. Trigo, and P. Sanches, “SBIAES - Sistema de business intelligence para análise do acesso ao ensino superior: O caso do Instituto Politécnico de Coimbra,” Iber. Conf. Inf. Syst. Technol. Cist., no. August 2016, 2014.
[14] J. Mitchell and A. Ryder, “Developing and Using Dashboard Indicators in Student Affairs Assessment,” Bull. World Health Organ., vol. 142, 2013.
[15] N. Deshpande, S. Ahmed, and A. Khode, “A business intelligence framework for Sultan Qaboos University: A case study in the Middle East,” J. Intell. Stud. Bus., vol. 6, no. 3, pp. 13– 26, 2016.
[16] B. Wixom, T. Ariyachandra, M. Goul, P. Gray, U. Kulkarni, and G. Phillips-Wren, “The current state of Business Intelligence in academia,” Commun. Assoc. Inf. Syst., vol. 29, no. 1, pp. 299– 312, 2011.