This is an Open Access article distributed under the terms of the Creative Commons Attribution License, which permits unrestricted use,
The unequal allocation of PRONAF resources:
which factors determine the intensity of the program
across Brazil?
A desigual alocação dos recursos do PRONAF: quais fatores determinam a
intensidade do programa ao redor do Brasil?
Manfred Zeller1, Carolina Schiesari2
1University of Hohenheim, Institute of Agricultural Sciences in the Tropics, Rural Development Theory and Policy (490a),
Stuttgart, Germany. E-mail: manfred.zeller@uni-hohenheim.de
2Universidade de São Paulo (USP), Escola Superior de Agricultura "Luiz de Queiroz" (ESALQ), Piracicaba (SP), Brasil.
E-mail: cschiesari@usp.br
How to cite: Zeller, M., & Schiesari, C. (2020). The unequal allocation of PRONAF resources: which factors determine the intensity
of the program across Brazil? Revista de Economia e Sociologia Rural, 58(3), e207126. https://doi.org/10.1590/1806-9479.2020.207126
Abstract: The family farming sector in Brazil is an important player in the country’s economy, especially
in poor rural areas., The government has created the National Program for Strengthening Family Agriculture (PRONAF) to stimulate the development of family farming in Brazil. It a credit program that offers loans at a subsidized interest rate. Previous studies have shown that wealthier farmers and more developed regions have more access to subsidized credit. Due to this apparently unequal allocation of PRONAF resources, the study aims to analyze, through econometric regressions and interviews with specialists, the underlying determinants for the unequal credit allocation across the municipalities in Brazil. Results indicate that wealth and knowledge of farmers are significant determinants of loan size, whereas municipalities that represent a high risk have received significantly fewer resources from PRONAF per household head. Thereby, we can conclude that PRONAF’s operations are not fulfilling their pro-poor objectives of targeting poor farmers and municipalities. Progress in infrastructure and institutions to reduce risks, enhancement of farmers’ qualifications and organization, better access to markets and agroindustry, and improvements in rural extension services are found to be essential to increasing the access to PRONAF’s credit.
Keywords: family farming, PRONAF, rural loan, credit access, credit intensity.
Resumo: A agricultura familiar no Brasil é um importante setor da economia do país, especialmente em
áreas rurais pobres. Para estimular o desenvolvimento da agricultura familiar, o governo brasileiro criou o Programa Nacional de Fortalecimento da Agricultura Familiar (Pronaf), um programa de crédito que oferece empréstimos a uma taxa de juros subsidiada. Estudos anteriores demonstram que agricultores mais ricos e regiões mais desenvolvidas têm mais acesso ao crédito subsidiado. Devido a essa alocação aparentemente desigual dos recursos do Pronaf, este estudo tem como objetivo analisar, por meio de regressões econométricas e entrevistas com especialistas, os fatores determinantes subjacentes à alocação desigual de crédito nos municípios brasileiros. Os resultados indicam que a riqueza e o conhecimento dos agricultores são fatores significativos que afetam a intensidade do crédito, enquanto os municípios que apresentam um alto risco recebem significativamente menos recursos do Pronaf por estabelecimento familiar. Com isso, podemos concluir que as operações do Pronaf não estão cumprindo seus objetivos de alcançar agricultores e municípios mais vulneráveis. O progresso na infraestrutura e nas instituições para reduzir riscos, o aperfeiçoamento das qualificações e organizações dos agricultores, o aprimoramento do acesso ao mercado e à agroindústria e melhorias nos serviços de extensão rural são considerados essenciais para aumentar o acesso ao crédito do pronaf.
1. Introduction
The importance of rural finance in developing countries has been discussed for a long time by numerous researchers. Khandker et al. (1995) say that access to credit, especially in rural areas, is essential to reducing poverty and promoting economic growth. Sharma & Zeller (1999) find that credit and savings services to poor households can increase agricultural productivity by facilitating access to inputs and technology. Results from an International Food Policy Research Institute (IFPRI) project show that households who had access to credit were able to improve their income, food expenditures, and calorie intake (Zeller & Sharma, 1998). International Fund for Agricultural Development (2016) argues that a lack of credit can negatively affect rural development and increase social inequality since the rural poor are the ones that suffer more with the lack of access to financial services.
However, rural credit programs around the world have faced some challenges. Researchers seem to reach a consensus about the main obstacles of these programs, which are: credit programs reach out to only a small fraction of the rural population; developed areas, such as zones with better infrastructure, paved roads, and stronger local markets, tend to receive more of the (subsidized) loan; and larger and wealthier farmers are the main beneficiaries of the loan (Binswanger, 2006; Food and Agriculture Organization of the United Nations, 2001; Gonzalez & Rosenberg, 2006; Khandker et al., 1995, 2006; Llanto, 2005; Sharma & Zeller, 1999; Yaron, 1992; Zeller & Meyer, 2002; Zeller & Sharma, 1998). For these scientists, the main factors that limit the access of the rural poor are the high transaction costs of reaching remote and under-developed areas; the covariant risk related to households’ income, which leads to high default rates; the lack of collateral among smallholder farmers; the dependence on natural resources and vulnerability to climate disasters; the production and market risks; and the seasonality of farm activities (Binswanger, 2006; Binswanger et al., 1993; Food and Agriculture Organization of the United Nations, 2001; Gonzalez & Rosenberg, 2006; Khandker et al., 1995; Llanto, 2005; Sharma & Zeller, 1999; Yaron, 1992; Zeller & Meyer, 2002; Zeller & Sharma, 1998).
In Brazil, the challenges faced by the rural credit program are no different. In 1996, the government created the National Program for Strengthening Family Agriculture (PRONAF) to better include small-scale farmers in the credit system. However, studies have shown that PRONAF has not been equally distributed across Brazil or among farmer categories. Researchers state that rural credit in Brazil for family farmers remains limited and restricted: difficult for smallholders to access and favoring capitalized landowners (Aquino et al., 2018; Belik, 2015; Grisa et al., 2014; Mattei, 2014; Resende & Mafra, 2016; Souza et al., 2011, 2015). Souza et al. (2013) add that PRONAF allocation is stronger in Brazil’s South Region than in the Northeast Region, in which the average value of financing taken per establishment is the lowest. Much has been discussed about the unequal distribution of PRONAF resources. However, no studies have used quantitative analysis to determine why such unequal allocation exists. Hence, the general objective of this study is to statistically assess the PRONAF resource allocation across all municipalities in Brazil. In more specific terms, the study aims to assess PRONAF resource allocation by statistically identifying the factors that determine credit intensity across municipalities in Brazil. The term “credit intensity”, as used in this study, refers to the average size of a PRONAF loan taken by a family unit (family establishment/farm) in a municipality. Therefore, the specific objective of the study is to identify significant factors that influence the size of PRONAF loans across Brazil. This study’s contribution is to deepen reflections on the unequal allocation of PRONAF resources and recommend that subsidies be offered to improve the operationalization of the program and the rural development in Brazil. In addition to this introduction and the final considerations, this article contains five more sections. In Section 2, a brief overview of PRONAF is presented. Section 3 describes in detail the research methodology . Sections 4 and 5 present and discuss the results.
2. Rural finance for family farmers in Brazil: PRONAF
Rural finance for family farmers in Brazil began in the early 1990s after a long period of pressure from farmers’ organizations. In the late 1980s, with the end of the military regime and the establishment of the 1988 Constitution, family farmers’ associations began to
strengthen, and new organizations were formed, such as the Movement of Rural Workers without Land (MST)1, Via Campesina, and the National Federation of Family Agriculture
Workers (FETRAF)2 (Bianchini, 2015). These groups began to demand new agricultural policies
to encourage the development of family farming in Brazil.
As a result, the National Program for Strengthening Family Agriculture (PRONAF) was established in 1996 by passing Law No. 1,946 on 28 June 1996 (Brasil, 1996). PRONAF is a national program that targets family farmers only, offering subsidized credit at low-interest rates (compared with commercial market interest rates). The program is carried out by the Secretariat of Family Agriculture and Coperativism (SEAD) and is executed primarily by two public banks: Bank of Brazil (BB) and Bank of Northeast (BNB) (Brasil, 2017a). The program is executed in four main performing lines, which have the following specific objectives (Bittencourt, 2003): negotiations and articulation of public policies to implement projects to improve family farming; improvement of infrastructure and public services in poor municipalities to stimulate the development of family farming; promotion of training and professional qualifications to family farmers and rural technicians; financing of agricultural and non-agricultural activities executed in rural units by family farmers to guarantee access to credit to the largest share of farmers.
In Brazil, there are 5.2 million agricultural establishments, of which 4.3 million (84.4%) are classified as family farms (Instituto Brasileiro de Geografia e Estatística, 2006a). Despite family agriculture occupying only 24% of the agricultural land in Brazil, the sector is very important for the food security of the country (Graeub et al., 2016). According to Brazilian law, to be recognized as a family farmer a household must: (1) have at most a land size of 4 fiscal modules3, (2) use mainly family labor, (3) have an income predominantly driven by agricultural
activities; (4) manage its farm (Brasil, 2006).
Families are categorized into three groups to consider the diversity of family farming in Brazil: A, B, and V (also known as Group AF). This classification considers the annual income level of the family (Ferreira, 2007). In Group A, there are the farmers who were (or are) settled by the land reform. Group B includes farmers who live below the poverty line. Group V (or AF) consists of farmers who are in an economic transition and have a larger income level.
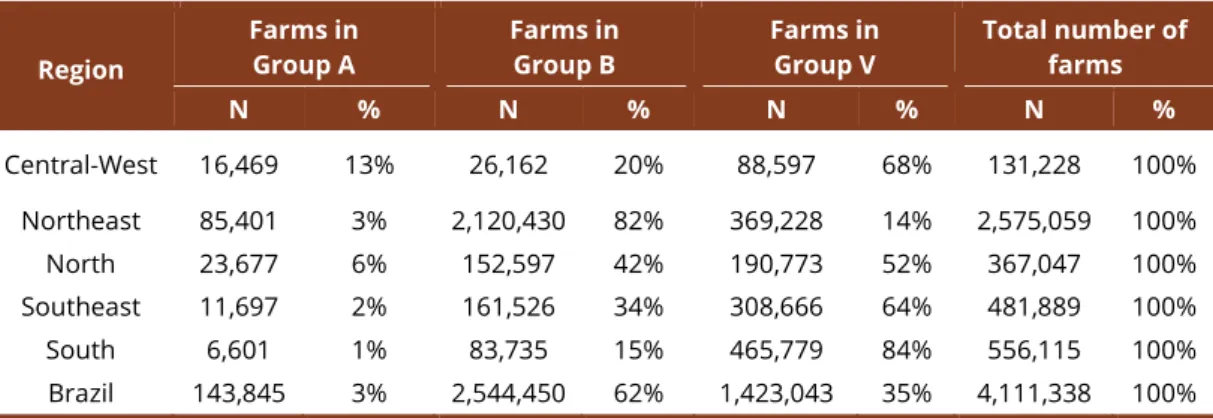
As illustrated in Table 1, the largest share of the families is in Group B (62%), followed by Group V (35%), and Group A (3%) (Brasil, 2017b). Group B is mostly located in the Northeast Region, where more than 80% of families are categorized in this group. Group V has a relevant representation in all other regions of Brazil, but the most significant one is in the South Region: 84% of families there are categorized in this group. Group A has the smallest presence in all regions of Brazil.
Table 1. Number of active DAPs by group and Brazilian regions (December 2016*)
Region Farms in Group A Farms in Group B Farms in Group V Total number of farms N % N % N % N % Central-West 16,469 13% 26,162 20% 88,597 68% 131,228 100% Northeast 85,401 3% 2,120,430 82% 369,228 14% 2,575,059 100% North 23,677 6% 152,597 42% 190,773 52% 367,047 100% Southeast 11,697 2% 161,526 34% 308,666 64% 481,889 100% South 6,601 1% 83,735 15% 465,779 84% 556,115 100% Brazil 143,845 3% 2,544,450 62% 1,423,043 35% 4,111,338 100%
*Considers the DAPs that were active in December 2016. Source: Brasil (2017b).
1Movimento dos Trabalhadores Rurais Sem Terra – MST.
2Federação Nacional dos Trabalhadores da Agricultura Familiar – FETRAF.
3In Brazil, each municipality has its own size of fiscal module, which can vary from 5 to 110 hectares depending on the
The program setup and the criteria to provide the loan, such as the level of interest rate, the limit of credit provided, collateral required, and time to pay back the loan are different for each group (Ferreira, 2007). Firstly, the farmer must acquire the “Declaration of Fitness for PRONAF (DAP4)” to obtain the subsidized loan. It is a document that declares that the producer
is a family farmer and also indicates in which group the farmer fits (A, B, or V) (Ferreira, 2007). Additionally, the farmer must have the land documentation (land ownership, a land rental contract, or land partnership contract) and comply with the financial system (Ferreira, 2007). The next step is to go to the financial institution to hand in a project proposal, which establishes what the family wants to finance. If the financial institution approves the loan, the farmer can sign the contract and implement the project (Ferreira, 2007).
PRONAF is the most significant public policy for family agriculture in Brazil. During 22 years of the program, it has distributed approximately R$ 200 billion and more than 28.5 million contracts have been signed (Brasil, 2017a). Studies have shown that PRONAF spending tends to indirectly reduce poverty by raising income average (Batista & Neder, 2014). However, PRONAF has its challenges as well. The main difficulty cited by researchers is the unequal distribution of PRONAF resources. Many studies show that the large majority of PRONAF investments go to the regions that have a more dynamic economy, such as the South Region (Aquino & Schneider, 2011; Bianchini, 2015; Bittencourt, 2003; Gazolla & Schneider, 2013; Mattei, 2014; Resende & Mafra, 2016; Souza et al., 2011, 2013). For instance, in the 2014/2015 harvest year, the South Region received 50% of the total PRONAF investments and had 28% of the contracts, whereas the Northeast Region was responsible for 49% of the contracts but received only 14.6% of the resources (Brasil, 2015). Additionally, the Northeast Region is the region with the lowest average value of financing taken from the program (Souza et al., 2013). The average value per contract in the Northeast Region is R$ 3,500 (US$ 1,0605), while in the other regions the average value is
R$ 25,173 (US$ 7,630) (Bittencourt, 2003).
The disproportionate resource allocation among the farmers’ groups (A, B, and V) is a limitation of the program that is repeatedly mentioned in the literature as well. The program has privileged the wealthier farmers, who represent only 9.4% of the target group, whereas the poorest farmers of Groups A and B have difficulty accessing the subsidized loan (Aquino & Schneider, 2011). For instance, Group V has received 74% of the PRONAF resources over the years, whereas Group B has obtained only 7% and Group A 13% (Mattei, 2005). Souza et al. (2015) add that the 50% smallest establishments employed only 6.5% of the total PRONAF credit, while the top 5% used almost 63% of that total.
However, over the years, PRONAF has undergone some changes to overcome the unequal distribution problem. By 2006, many institutional and financial changes had been implemented that improved the distribution of resources across regions and among farmer categories. As a result, more farmers, especially from the Northeast Region and from Group B, were able to access the credit (Souza et al., 2013). Nevertheless, since 2006, the inequality in the distribution of PRONAF has increased once again, favoring mainly the states of the South Region and the farmers classified in Group V. Belik (2015) mentions that, after 2006, the participation of the South Region in PRONAF had grown again, reaching 51.2% of PRONAF’s resources in 2011, while the Northeast Region had a reduction in its participation, reaching only 12.6% of program resources. According to the literature, the return of this unequal distribution of PRONAF occurred due to changes in the program’s rules. These changes increased the maximum limit of annual income in the DAP classification, allowing the entry of farmers with higher incomes into the program (Resende & Mafra, 2016; Souza et al., 2011, 2013).
Also, the other reasons for this unequal allocation of PRONAF resources mentioned in the literature, especially in northeastern Brazil are: the climate risk, the Northeast Region is located in the semi-arid zone, which suffers long periods of drought; lack of organization between farmers; the high level of social exclusion; the deficient access to market; and the low level of technology adoption (Aquino & Bastos, 2015; Aquino & Schneider, 2011; Bittencourt, 2003; Castro, 2013; Eusébio et al., 2016; Resende & Mafra, 2016; Souza et al., 2015). Moreover, in the Northeast Region, 8% of rural families live in extreme poverty and almost 40% live below the poverty line, which hampers the economic growth of the region (Soares et al., 2016).
4DAP – In portugueses “Declaração de Aptidão ao PRONAF”.
3. Research methods
The topic of interest of this study is to identify which factors influence the credit intensity (amount of loan taken per household head) in the municipalities. To do so, the study is conducted in two stages. First, a quantitative analysis is performed to identify which factors statistically determine the intensity of the program (the average size of a PRONAF loan) in a municipality. Then, a qualitative approach is used to understand why such factors impact credit allocation across municipalities.
The following analytical framework is used to conduct a quantitative approach. PRONAF is a rural credit program that is conducted mostly by public banks. Therefore, it is possible to infer that fulfilling banks’ conditions to access the credit determine participation in PRONAF. Based on the literature, four-vectors characterize banks’ requirements for loan approval: expected demand, wealth, risk, and knowledge. An econometric model incorporating these considerations is specified in Equation 1:
( )
( )
i i i i i
P E D , W , R , K= (1)
where P represents the PRONAF intensity in the municipality i. E(Di) is the expected demand
for PRONAF credit in the municipality i, W is the vector that describes the wealth in the municipality i, R is the risk factor in delivering the credit in the municipality i, and K is the level of access to knowledge of farmers in the municipality i.
A minimum threshold of credit demand is likely to be required to cover the transaction costs that individual credit applicants will incur when applying for PRONAF credit. These costs include costs mainly for the search for information and for preparing and filing the loan application. As transaction costs are of a fixed cost nature, it is not rational to apply for very small loans. Another demand-related issue is regarding the availability of banking services, that is their proximity determines the transaction costs on the demand side. As PRONAF credit is distributed through banks, the existence of public or private banks in the municipality is a determining factor of PRONAF provision. The demand for credit will be further influenced by the productivity and yields in farming, and overall infrastructure and economic activity in the municipality. Therefore, the demand for credit is an important factor to be considered. The expected demand function for credit E(Di) can be represented as:
( )i ( )i
E D = g M (2)
where Mi is the market vector that affects the level of loan demand. The Mi vector may include
the following variables:
- the number and density of families in the family agriculture sector in the municipality, - the rural population in the municipality,
- the size of the agricultural market, including the value of agricultural production and yield of major crops in the municipality,
- and the number of banks in the municipality that can provide PRONAF credit.
A crucial issue for the sustainability of the credit provision system is high repayment rates, especially for profit-seeking organizations. In particular, financial institutions are likely to avoid providing credit to farmers that do not have collateral or reliable repayment capacity, such as the farmers classified into Group B of PRONAF. Therefore, it is most probable that wealthier farmers will have more access to credit. The wealth vector (W) can be expressed as:
( )
iW g L= (3)
and may contain the following variables:
- the average level of family income in the municipality,
- the mean number of livestock per household head in the municipality,
- the mean number of pieces of machinery per household head in the municipality, - the percentage of household heads who own land in the municipality,
- the percentage of household heads that are classified into Group B, - the average of farms’ size in the municipality,
- and the percentage of families that have access to electricity.
Additionally, profit-seeking institutions usually select locations where the marginal revenue is larger or equal to marginal cost given the scarcity of capital. In practice, the vector W also impacts service costs, because it is associated with credit risk, and thus, farmers with a better financial status represent less risk to the financial institution. However, in addition to the credit cost, banks also seek locations that have lower transaction costs. Municipalities that are more urbanized, have better infrastructure, and/or face lower covariant risks, such as not being vulnerable to natural disasters, are expected to have lower transaction costs. Therefore, to account for these additional transaction costs, the risk factor (R), which is specified as,
( )
iR g C= (4)
may combine the following variables:
- the percentage of paved roads in the municipality,
- and whether the municipality is located in a semi-arid region.
The final vector considered in the PRONAF intensity function is regarding farmers’ knowledge. Access to information, markets, and rural extension services are essential to instigate farmers to apply for and eventually be approved for a loan. Normally, farmers who are integrated into the market and receive technical assistance are more informed about rural programs and projects. Particularly in a rural credit program, engagement in a cooperative appears to be very important as well, not only to have more access to information but also to guarantee stronger collateral. Therefore, the knowledge vector (K) can be specified as:
( )
iK g T= (5)
and contains the following variables:
- the percentage of families in the municipality that are engaged in a cooperative,
- the percentage of families in the municipality that have received technical assistance regularly,
- the household head level of experience in managing the farm,
- and the percentage of families in the municipality that are integrated into the market. As a result, a linear specification of PRONAF intensity can be represented as:
Pi Mi Li Ci Ti = α + β + γ + δ (6)
However, due to a lack of data and because it is very difficult to identify variables that affect only M, L, C, or T separately, a reduced-form approach is preferred. The variables of M, L, C, T factors are combined into a single vector Xi. This estimation approach is more suitable for the
study and has been used by other authors, such as Sharma & Zeller (1999). Thereby, the PRONAF intensity function is specified as:
where P is a continuous dependent variable that represents the amount of credit taken per household head in the municipality i. The X vector contains all the variables described before, and η combines the effect of the four factors (α, β, γ, and δ).
To conduct the quantitative analysis secondary data obtained through the 2006 Brazilian Agricultural Census are used. The census covers the 2006 calendar year (01.01.2006 – 31.12.2006) and was carried out in 2007 by the Brazilian Institute of Geography and Statistics (IBGE) in collaboration with the Agrarian Development Ministry (MDA) (Instituto Brasileiro de Geografia e Estatística, 2006b). The 2006 Agricultural Census is the first (and only) census that considers the concept of family farming. In 2018, IBGE launched the preliminary results of the 2017 Agricultural Census, but it did not specify the data for the family farming sector. Additionally, during the period of elaboration of this study, the data of the new census still were not available. However, many studies have been conducted after 2006 (Aquino et al., 2018; Grisa et al., 2014; Mattei, 2014; Resende & Mafra, 2016; Souza et al., 2011, 2013, 2015), some of which used the 2006 Agricultural Census data (Aquino et al., 2018) and the same concentrating features of the program were identified. Grisa et al. (2014), for instance, state that after 20 years of PRONAF, the results remain the same such as the concentration in commodities, in the most capitalized family farmers, and the South, Southeast, and Central-West Regions. In this way, we can affirm that since 2006, little has evolved in the distribution of PRONAF credit and rural development in Brazil, and thus, the results of this research remain current and relevant.
In the census, the concept of family agriculture is related to the family unit (Instituto Brasileiro de Geografia e Estatística, 2006a). Therefore, the unit of analysis at the census is the agricultural residence, so one domicile characterizes one family. However, as the public information available from the census is at the municipality level, the number of observations of this study is the number of municipalities that contain family farms. A database was built to run the econometric models. Most variables were taken from the Instituto Brasileiro de Geografia e Estatística (2006c) database, which is available on the IBGE webpage. However, three independent variables (electricity, paved roads, and the number of the banks) were not available in the 2006 Brazilian Agricultural Census, and thus other databases were used. Electricity and paved roads were taken from the Brazilian Census of 2010 (Instituto Brasileiro de Geografia e Estatística, 2010), and the number of banks variable was provided by the Central Bank of Brazil via e-SIC (electronic system of information for the population). To avoid problems regarding endogeneity among the data, the value of PRONAF resources are used from 2007 (calendar year), which were provided by the Central Bank of Brazil via e-SIC as well (Banco Central do Brasil, 2017). Due to this adjustment, some data cleaning was required. The participation in the program (if the municipality participates in the program or not) is from 2006, but the value of PRONAF credit allocated in the municipality is from 2007, so the observations that did not match (municipalities that got credit in 2006 but did not get any in 2007) were excluded. As a result, the number of observations reached is 5,523 (20 municipalities fewer than the total number of municipalities that had family farms in Brazil in 2006). Therefore, in the following tables, the total number of family farms does not match with the number presented by Instituto Brasileiro de Geografia e Estatística (2006b) (4,366,267), and the total value of PRONAF allocated in 2007 does not match with the 2007 Rural Credit Statistics of Central Bank (R$ 7,122,941,867) (Banco Central do Brasil, 2007). However, these values that were not considered in the dataset represent a very small part of the data: only 0.37% of total households and 2.58% of total PRONAF resources. Thus, we can assume that these data omissions do not have any influence on the results of the analysis.
Additionally, since there are correlated variables that can represent the demand for loans, a DEMAND index was created. To do so, principal component analysis (PCA) was used. The variables selected for the index have a factor loading value of at least 0.4 and individual KMO (Kaiser-Meyer-Olkin measure of sampling adequacy) values higher than 0.6, which is the minimum acceptable as recommended by Kaiser (1974). The estimated model performed quite well, and the overall KMO rate of the demand index is 0.71.
As the variables are published regarding the number of residences in family farming, we also have transformed the variables into percentages or a value per household head to be able to compare municipalities with different numbers of farm units. It is also important to
say that, as the Census counts the number of domiciles, which represent one family unit and/or one household head, we will also use the terms “family” and “household head (HH)” throughout the paper to express the unit of analysis.
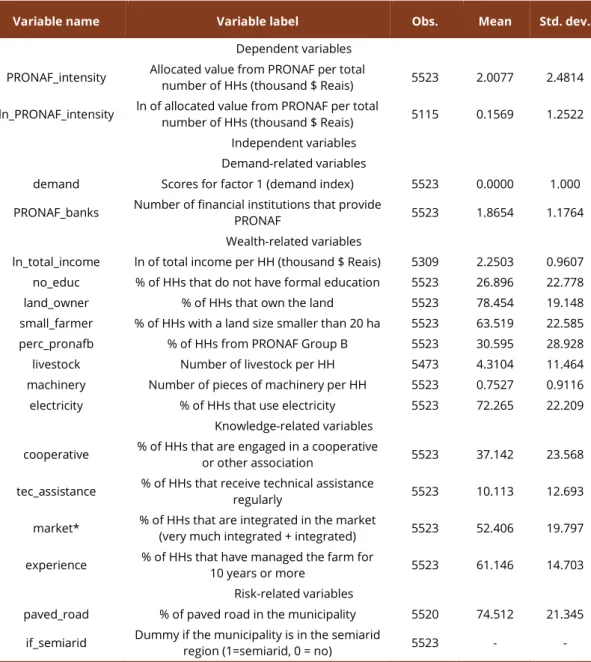
Based on the central limit theorem, it is possible to assume a normal distribution (or nearly normal) of the data, since the number of observations is very large and close to the real population. Therefore, we also adopt the normal distribution of the residuals in the study. The quantitative data analysis is based on both maximum likelihood estimation (MLE) and ordinary least squares (OLS) regression models. OLS and MLE methods are sensitive to heteroscedasticity, thus, in both cases a robust standard error was applied. Also, for the linear regression models, multicollinearity tests were performed to check for correlation between the independent variables. The variables of the factor X described in Equation 7 are presented in Table 2 below together with the descriptive statistics.
Table 2. Definition and descriptive statistics of regression variables: Municipality level
Variable name Variable label Obs. Mean Std. dev.
Dependent variables
PRONAF_intensity Allocated value from PRONAF per total number of HHs (thousand $ Reais) 5523 2.0077 2.4814 ln_PRONAF_intensity ln of allocated value from PRONAF per total number of HHs (thousand $ Reais) 5115 0.1569 1.2522
Independent variables Demand-related variables
demand Scores for factor 1 (demand index) 5523 0.0000 1.000
PRONAF_banks Number of financial institutions that provide PRONAF 5523 1.8654 1.1764 Wealth-related variables
ln_total_income ln of total income per HH (thousand $ Reais) 5309 2.2503 0.9607
no_educ % of HHs that do not have formal education 5523 26.896 22.778
land_owner % of HHs that own the land 5523 78.454 19.148
small_farmer % of HHs with a land size smaller than 20 ha 5523 63.519 22.585
perc_pronafb % of HHs from PRONAF Group B 5523 30.595 28.928
livestock Number of livestock per HH 5473 4.3104 11.464
machinery Number of pieces of machinery per HH 5523 0.7527 0.9116
electricity % of HHs that use electricity 5523 72.265 22.209
Knowledge-related variables
cooperative % of HHs that are engaged in a cooperative or other association 5523 37.142 23.568 tec_assistance % of HHs that receive technical assistance regularly 5523 10.113 12.693 market* % of HHs that are integrated in the market (very much integrated + integrated) 5523 52.406 19.797 experience % of HHs that have managed the farm for
10 years or more 5523 61.146 14.703
Risk-related variables
paved_road % of paved road in the municipality 5520 74.512 21.345
if_semiarid Dummy if the municipality is in the semiarid
region (1=semiarid, 0 = no) 5523 - -
Note: HH = household head, which in this case is also related to the family unit or agricultural residence. *the variable “market” refers to the % of HH that has an integration level higher than 0.5: the level of integration is calculated by the ratio: total revenue from agricultural activity and the total value of production.
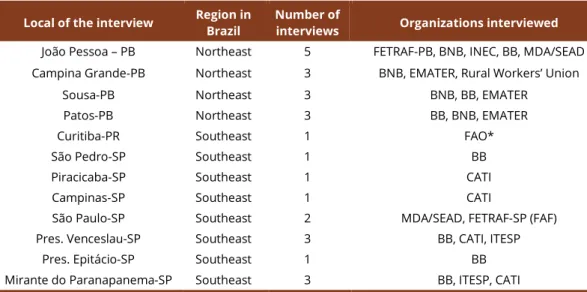
For the qualitative approach, as illustrated in Table 3, five categories of specialists were interviewed: local government (MDA/SEAD), family farmers’ organizations (FETRAF and Rural Workers of Family Farmers Union), rural development organizations (FAO and INEC6),
extension companies (EMATER7, CATI8, and ITESP9), and financial institutions (BB and BNB).
These organizations were selected based on their importance and relationship with PRONAF. The actors interviewed from each organization were the people directly responsible for PRONAF operationalization and/or the person who had more knowledge of the program and family farming. In total, 27 semi-structured face-to-face interviews were conducted. The interviews took place in July and August of 2017 in 12 municipalities of Brazil with the objectives of understanding the local contexts of the program, identifying the process of credit allocation, and confirming the quantitative results.
Table 3. Organizations interviewed in Paraiba (PB) and Sao Paulo (SP)
Local of the interview Region in Brazil Number of interviews Organizations interviewed
João Pessoa – PB Northeast 5 FETRAF-PB, BNB, INEC, BB, MDA/SEAD
Campina Grande-PB Northeast 3 BNB, EMATER, Rural Workers’ Union
Sousa-PB Northeast 3 BNB, BB, EMATER
Patos-PB Northeast 3 BB, BNB, EMATER
Curitiba-PR Southeast 1 FAO*
São Pedro-SP Southeast 1 BB
Piracicaba-SP Southeast 1 CATI
Campinas-SP Southeast 1 CATI
São Paulo-SP Southeast 2 MDA/SEAD, FETRAF-SP (FAF)
Pres. Venceslau-SP Southeast 3 BB, CATI, ITESP
Pres. Epitácio-SP Southeast 1 BB
Mirante do Paranapanema-SP Southeast 3 BB, ITESP, CATI
* The interview with FAO was conducted by skype because the specialist on PRONAF lives in Curitiba-PR (a state that was not visited).
The municipalities were purposely selected for the interviews from two states: Paraiba in the Northeast Region and São Paulo in the Southeast Region. The Northeast Region was selected because half of the family farms are in that region, as well as the largest share of poor farmers (of Group B). Paraiba was chosen because it is within the lowest level of PRONAF intensity and because the program has operated in the state since its creation. Moreover, Paraiba is a relatively small state in terms of land extension, and therefore, could be covered in its entirety, from the coast to the backcountry. The Southeast Region was chosen because it is mostly represented by richer farmers (of Group V), but it also has a relevant range of other farmer’s categories (of Groups A and B). In addition, São Paulo is in the share of the highest level of PRONAF intensity. Therefore, the selection of the municipalities was based on diverse credit allocation (high and low levels of PRONAF intensity), the different coverage of types of farmers (Groups A, B, and V), and the number and type of important organizations related to the program located in the municipality to have a good representation of all types of farmers in the sample. Furthermore, time, distance, and cost constraints were also considered in the selection of the municipalities.
6Instituto Nordeste Cidadania (INEC). English translation: Institute of Northeast and Citizenship.
7Empresa de Assistência Técnica e Extensão Rural (EMATER). English translation: Technical Assistance and Rural
Extension Company.
8Cooderanção de Assistência Técnica Integrada (CATI). English translation: Coordination for Integrated Technical
Assistance.
4. Results
4.1 Results: Quantitative analysis
The quantitative results were obtained through statistical models, which were conducted using Stata13 software based on the constructed database. Table 4 presents the program’s placement and the percentage of families reached. The results indicate that although PRONAF is placed in almost all municipalities in Brazil (more than 92% of the municipalities), the average of families in each municipality participating in the program is still very low, only 12.3%. The South Region has the largest participation rate in the program: on average 27% of families from the South Region’s municipalities were reached, whereas in the other regions it was less than 10%.
Table 4. PRONAF placement and outreach by region in 2006 (calendar year)
Dummy PRONAF
placement North Northeast Central-West Southeast South Total
NO 12.3% 4.5% 6.5% 13.1% 2.2% 7.35%
YES 87.7% 95.5% 93.5% 86.9% 97.8% 92.65%
PRONAF outreach
Mean 6.1% 9.4% 7.8% 7.7% 27.3% 12.3%
Source: Stata output based on Banco Central do Brasil (2017); Instituto Brasileiro de Geografia e Estatística (2006c).
Regarding the number of resources allocated, Table 5 shows that, although the Northeast Region has the largest share of farm units (50.1%), the largest portion (46%) of PRONAF resources went to municipalities in the South Region. An important fact is that the South Region represents only 19.5% of the farm units in Brazil.
Table 5. Total value allocated from PRONAF in 2007 (calendar year) and total number of family farms in
2006 (calendar year)
Region allocation (000’ R$*) Total PRONAF % of PRONAF allocation Total number of farm units % of farm units
North 445,939 6.4% 404,942 9.3% Northeast 1,421,049 20.6% 2,179,910 50.1% Central-West 436,923 6.3% 216,392 5.0% Southeast 1,423,509 20.6% 699,098 16.1% South 3,187,000 46.1% 849,693 19.5% Total 6,914,420 100% 4,350,035 100%
* Official exchange rate is equal to 1.9 (LCU per US$, 2007) (World Bank, 2017). Source: Stata output based on Banco Central do Brasil (2017) and Instituto Brasileiro de Geografia e Estatística (2006c).
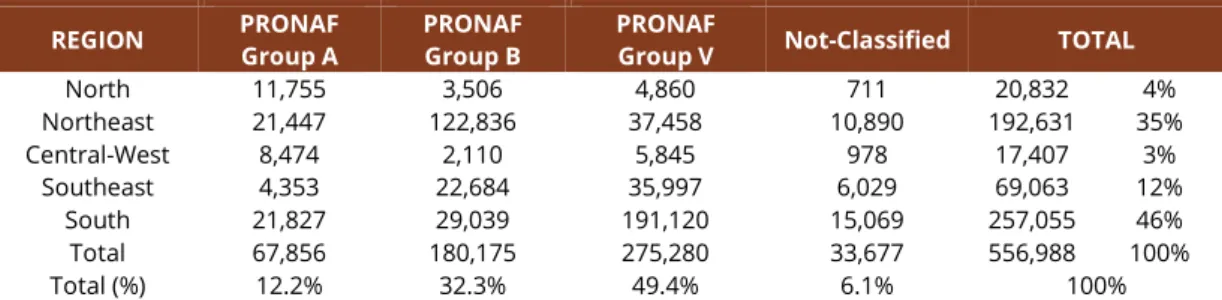
Among the families that benefited in the program, Table 6 shows that the South Region has the largest share of loan recipients as well: 46% of the families that received PRONAF credit are from the South Region. Another important fact here is that almost 50% of the families reached by the program are in Group V.
Table 6. Number of HH that received PRONAF credit by group and region in 2006 (calendar year)
REGION PRONAF
Group A
PRONAF Group B
PRONAF
Group V Not-Classified TOTAL
North 11,755 3,506 4,860 711 20,832 4% Northeast 21,447 122,836 37,458 10,890 192,631 35% Central-West 8,474 2,110 5,845 978 17,407 3% Southeast 4,353 22,684 35,997 6,029 69,063 12% South 21,827 29,039 191,120 15,069 257,055 46% Total 67,856 180,175 275,280 33,677 556,988 100% Total (%) 12.2% 32.3% 49.4% 6.1% 100%
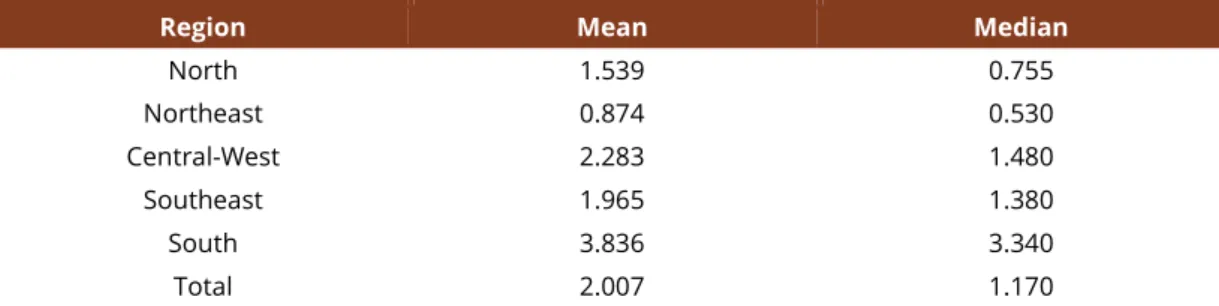
As a result of the differences in the placement of PRONAF resources, Table 7 shows a disparity in the intensity of the program across regions as well. The intensity of PRONAF (measured as the amount of credit taken in the municipality during the reporting year divided by the total number of agricultural residences that took the financing in the municipality) has the lowest level in the North and Northeast Regions. The averages of the value of loan per
household head from those regions are R$ 1,539 (US$ 810) and R$ 874 (US$ 460)10
respectively, while in the South Region the average is almost R$ 4,000 (US$ 2,105). Another important figure is that in half of the municipalities from the North and Northeast Regions, the value of PRONAF loan per household head is between R$ 530 and R$ 755 (US$ 278 and US$ 397), whereas in the other regions this value is more than doubled. The statistical results of the ANOVA test to compare means, using a Games-Howell post hoc test (because the data has unequal variance), and the Kruskal-Wallis test to compare the medians, confirm that there is a significant difference in the means and the medians between regions.
Table 7. PRONAF intensity*: Allocated value per total number of HHs (thousand R$**)
Region Mean Median
North 1.539 0.755 Northeast 0.874 0.530 Central-West 2.283 1.480 Southeast 1.965 1.380 South 3.836 3.340 Total 2.007 1.170
*PRONAF value is from 2007 (calendar year) and the number of HHs are from 2006 (calendar year).**Official exchange rate is 1.9 (LCU per US$, 2007 average) (World Bank, 2017). Source: Stata output based on Banco Central do Brasil (2017) and Instituto Brasileiro de Geografia e Estatística (2006c).
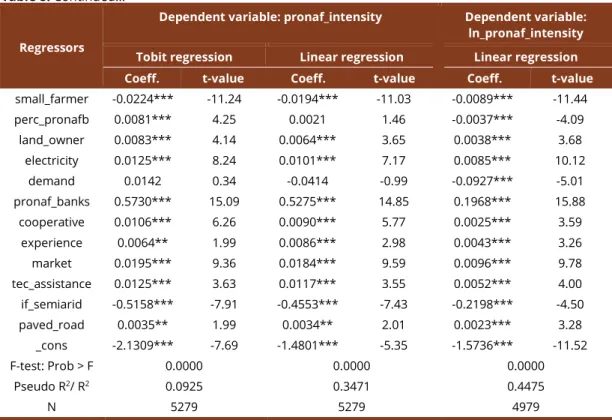
Three regression models were built to identify the factors that influence this unequal allocation of PRONAF resources: a Tobit model, a linear regression model (lin-lin model), and a linear regression model using the natural log of the dependent variable (log-lin model). The three models are presented in Table 8. The purpose of running three different models is to identify the most robust variables that impact the program’s resource allocation since a statistical analysis of PRONAF intensity has never been applied. The results show that the regressors are jointly significant at the 1% level of significance, indicating the overall significance of each of the three models. Regarding the investigation of the coefficients, the marginal effects will not be considered. In the log-lin model, the R2 is 0.45, which means that
the model explains 45% of the variance of the PRONAF intensity. In the lin-lin model the R2 is
equal to 0.35, so the model explains 35% of the variance of the program’s intensity. These values of R2 can be considered a fair measure of goodness of fit for quantitative research
using cross-sectional data in the social sciences.
Table 8. Results from linear regressions and Tobit model
Regressors
Dependent variable: pronaf_intensity Dependent variable: ln_pronaf_intensity
Tobit regression Linear regression Linear regression
Coeff. t-value Coeff. t-value Coeff. t-value
no_educ -0.0067*** -2.64 -0.0070*** -2.93 -0.0058*** -4.93
ln_total_incom
e 0.2557*** 4.42 0.1728*** 3.38 0.0926*** 3.75
livestock 0.0027 0.62 0.0017 0.45 0.0000 0.01
machinery 0.1581*** 2.98 0.1821*** 3.59 0.0435** 2.22
Regressors
Dependent variable: pronaf_intensity Dependent variable: ln_pronaf_intensity
Tobit regression Linear regression Linear regression
Coeff. t-value Coeff. t-value Coeff. t-value
small_farmer -0.0224*** -11.24 -0.0194*** -11.03 -0.0089*** -11.44 perc_pronafb 0.0081*** 4.25 0.0021 1.46 -0.0037*** -4.09 land_owner 0.0083*** 4.14 0.0064*** 3.65 0.0038*** 3.68 electricity 0.0125*** 8.24 0.0101*** 7.17 0.0085*** 10.12 demand 0.0142 0.34 -0.0414 -0.99 -0.0927*** -5.01 pronaf_banks 0.5730*** 15.09 0.5275*** 14.85 0.1968*** 15.88 cooperative 0.0106*** 6.26 0.0090*** 5.77 0.0025*** 3.59 experience 0.0064** 1.99 0.0086*** 2.98 0.0043*** 3.26 market 0.0195*** 9.36 0.0184*** 9.59 0.0096*** 9.78 tec_assistance 0.0125*** 3.63 0.0117*** 3.55 0.0052*** 4.00 if_semiarid -0.5158*** -7.91 -0.4553*** -7.43 -0.2198*** -4.50 paved_road 0.0035** 1.99 0.0034** 2.01 0.0023*** 3.28 _cons -2.1309*** -7.69 -1.4801*** -5.35 -1.5736*** -11.52 F-test: Prob > F 0.0000 0.0000 0.0000 Pseudo R2/ R2 0.0925 0.3471 0.4475 N 5279 5279 4979
*** significant at 1% level **significant at 5% level * significant at 10% level
The inconsistent variables between the models are perc_pronafb and Demand. The signs of these variables change across the models and the levels of significance are not robust either. Thus, no conclusion can be made about them. The variable livestock has a positive sign in all three models, but it is not significant (p-value > 0.1) in any of the models, which indicates that this regressor seems to not impact in the credit allocation. All the other variables presented in Table 8 are significant at the 5% level of significance at least in all three models.
In the linear models, as well as in the Tobit model, the variables total income, machinery, landowner, electricity, PRONAF banks, cooperative, experience, market, technical assistance, and paved road have a positive impact on PRONAF intensity. This means that if these variables increase by one unit, the intensity of PRONAF in the municipality also increases, ceteris paribus. The variables no education (% of HH that does not have formal education), small farmer (% of HH with a land size smaller than 20 ha), and the dummy semiarid (1 being a semiarid region and 0 otherwise) harm PRONAF intensity. Therefore, when there is an increase in the value of these variables, the intensity of the program in the municipality decreases, holding all other factors constant.
4.2 Results: Interviews with specialists
The interviews were analyzed using the discourse analysis method through NVivo software. Concerning PRONAF provision, the financial institutions claim that the amount of credit provided to the farmer follows the limit of credit of each group (A, B, or V), which is determined in the program setup yearly, and the payment capacity of the family. The payment capacity is indicated in the project, which also specifies what the family is willing to finance. In this project, the expected revenue and costs of the investment are calculated, which consequently gives the expected profit for each year. The value of a loan must be between x% and y% of the project’s profit. The exact range was not provided by the banks, and it can vary across financial institutions. However, to illustrate a feasible example of repayment capacity, a range of 30%-60% can be used.
The financial institutions state that for farmers in Groups A and B, there is no need to provide collateral since PRONAF resources stem from government funds (FNE11 or National
11Fundo Constitucional do Nordeste (English translation: “Constitutional Fund of Northeast”). Table 8. Continued…
Treasury). For Group V a guarantor or physical collateral is necessary: usually for loans up to R$ 20,000 (US$ 5,71412) a guarantor is requested, and for loans above R$ 20,000 (US$ 5,714)
collateral is required. In most cases, the collateral requested is the property or land but maybe other assets such as a car or tractor. According to the rural extension companies and the financial institutions, the wealthier farmers in Group V do not have difficulty providing collateral. However, former PRONAF Group A households that have moved to Group V have some difficulty accessing credit due to lack of collateral, since they are not landowners. After two PRONAF operations in Group A, the settled farmer switches directly to Group V, which has different conditions. In addition to requiring collateral, Group V loans have a higher interest rate and do not have a rebate on the value of the loan (usually farmers in Groups A and B have a rebate of 40% on the value of the loan if they pay the loan tranches in time). The same specialists (financial institutions and rural extension companies) affirm that farmers in Group B have a similar problem. After two operations in Group B, the household can access the PRONAF Semiarid credit line, which allows a loan up to R$ 20,000 (US$ 5,714), but only if the collateral is provided. As the majority of farmers in Group B are not landowners, access to this credit line is almost impossible. Usually these farmers have a consent agreement with a landlord, allowing them to use the land to grow food and raise animals. In addition, the financial institutions do not lend money to farmers for infrastructure investments in the property, such as water wells, storage, and shelter, if they are not the landowners.
The default rate in the bank branches was not revealed by the interviewees. However, they did declare that in some bank’s branches, the default rate (in the year that this research was conducted) is higher than the level tolerable by the financial institution, which usually is between 3% and 5%. According to the financial institutions, the farmers that have more difficulty repaying the loan are the settled farmers of Groups A and farmers who moved from Group A to Group V, while farmers of Group B and the traditional farmers of Group V do not have much difficulty repaying the loan. The extension companies and the family farmers’ organizations revealed that the settled farmers do not have good infrastructure in the land lot, thus, they “wrongly” use part of the loan to improve the housing conditions. According to them, this is a problem because this type of investment does not generate revenue, and thus, the family does not have the money to pay back the loan, which in turn blocks their access to additional credit. This situation is different for farmers in Group B because Agroamigo, a new methodology for granting loans to this group, has been implemented. Agroamigo was created in 2005 by the public bank BNB in partnership with INEC; together they provide microloans to farmers of Group B. According to BNB and INEC, the rural credit provision under the Agroamigo methodology is guided and escorted by institute credit agents, who give support and technical assistance to farmers from the beginning to the end of the financed project. The interviewees declared that before the application of this methodology, the default rate of farmers in Group B was extremely high, but after implementation, the rate fell substantially, and nowadays it is below the maximum permitted.
Regarding policy beliefs, all participants mentioned that PRONAF is an essential credit policy that significantly benefits family farming and stimulates food production. According to all interviewees, the program has facilitated access to financial services for poor households and reduced the rural exodus. However, the interviewees declared that the program must be improved to reach all of its objectives. According to the family farmers’ organizations, to rural extension companies, and rural development organizations, today PRONAF is more a credit policy rather than a rural development program. The main PRONAF challenges regarding rural development cited by all interviewees are the need to intensify and integrate the public technical assistance to the loan, to improve and guarantee access to the local market, to foster the diversification of agricultural production to reduce risk, and to increase the credit outreach to poor and landless families.
All the specialists agree that PRONAF outreach has noticeably increased. When they were confronted with the quantitative results, they stated that after 11 years of PRONAF, the program’s outreach has risen expressively and the value of 12% on average of families participating in the program is no longer accurate. Moreover, the large majority is convinced
that the program’s outreach is higher than 40%. The main reasons for this expansion mentioned by the interviewees are the inclusion of the Agroamigo methodology in the Northeastern Region, which has simplified the access to credit for farmers of Group B; the improvement in the access to information about PRONAF; and the increase in the program resources provided to farmers.
Regarding the access to credit, all interviewees confirm that farmers from the South and Southeast Regions have more access to credit and larger loans. According to them, the vast majority of these households are in Group V, so they can show better collateral. The interviewees also declared that, although nowadays farmers of Group B have easier access to loans, their access is limited to only a small amount of credit. In addition, when the specialists were asked about the development of farmers in the program, the large majority declared that farmers of Group V were the ones that could advance, while farmers of Groups A and B could not develop much.
The factor most frequently mentioned by the interviewees that stimulate the unequal allocation of PRONAF resources is the farmer’s collateral/wealth level: 63% of the interviewees have declared that this aspect influences the amount of credit taken per household head. The other reasons most stated by the specialists that stimulate greater access to credit are the climate conditions, the level of farmer’s organization, the level of education and information, the access to technology and markets, and the technical assistance. In addition, they also mentioned that the South and Southeast Regions had a different process of colonization than in the North and Northeast Regions, and due to this fact, the southern municipalities are more developed and have a greater economic flow, which stimulates the agricultural market, and consequently, the access to credit.
5. Discussion
PRONAF is a very well-known program in the whole country. Almost all municipalities have a bank branch that operates the subsidized credit line. However, regarding the number of families reached by PRONAF, it seems that there is a divergence between the quantitative results found and the opinions of the specialists. To examine this difference, the number of contracts signed in PRONAF can be compared. In the harvest year 2005/2006 (and in the harvest year 2006/2007), there were 2.5 million (2.3 million) contracts signed, but in the harvest year 2014/2015, 1.9 million contracts were signed (Brasil, 2015). Hence, there was a decline in the number of contracts, instead of growth. Literature shows that the highest level of PRONAF’s outreach was in 2006, and in the following years the program’s outreached has fallen (Souza et al., 2013). Belik (2015) adds that even at the peak of PRONAF in 2006, only a small portion of family farms had access to rural credit, reaching a share of less than 19% of the farm units (considering other rural finances besides PRONAF). Therefore, comparing the number of contracts, it is not possible to infer that the program’s outreach significantly increased over the years. It is important to emphasize here that the number of contracts signed cannot be directly compared with the total number of households that have accessed PRONAF. The financial institutions mentioned that a family can do more than one operation in the program (for some credit lines the household can do up to three operations, and sometimes two members of the family can do different operations), which means that a family can sign more than one contract. Thereby, the number of contracts will always be much higher than the number of families reached by the program.
Furthermore, the interviewees highlighted the rise in the number of resources allocated to PRONAF as a measure of the growth of the program’s outreach. Indeed, it is possible to identify a significant increase in the program’s resources. In the harvest year 2006/2007, the value allocated to PRONAF was R$ 7.1213 billion (US$ 3.23 billion14), and in 2014/2015, this
value was R$ 23.96 billion (US$ 7.26 billion15) (Brasil, 2015). Nevertheless, to confirm this
perception, it is necessary to examine the exchange rate, the inflation index, and the PRONAF
13The value is slightly different from the database used because the Central Bank accounts for all of Brazil. 14Official exchange rate equal to 2.2 (LCU per US$, 2006 average) (World Bank, 2017).
setup. In 2006, the exchange rate was 2.2 (LCU per US$; World Bank, 2017), and in 2015, it was 3.3 (LCU per US$; World Bank, 2017), so the currency value in 2006 was higher than in 2015. Thus, more money was needed to be allocated in 2015 to cover the higher costs. The inflation rate in Brazil also has risen over the years. For instance, when we use the Consumer Price Index (CPI) to compare the years 2006 and 2015, we note an increase of 72.97% in the prices (Banco Central do Brasil, 2018). That means that to have the same purchasing power, the value of R$ 7.12 billion in 2006 must be R$ 12.32 billion in 2015. Concerning the program’s rules, in the harvest year 2006/2007, the loan upper limit of PRONAF for Group B was R$ 1,500 (US$ 681) and for Group A it was R$ 16,500 (US$ 7,500), but in 2015/2016 the value for Group B increased to R$ 4,000 (US$ 1,142) and for Group A it increased to R$ 26,500 (US$ 7,571) (Bianchini, 2015). Group V had the largest change: it rose from R$ 36,000 (US$ 16,363) in 2006/2007 to R$ 165,000 (US$ 47,142) in 2015/2016 (Bianchini, 2015). Therefore, the loan size has drastically increased, especially for Group V, over the years. Therefore, even with the decline in the number of PRONAF contracts since 2006, the amount of resources allocated by the program has grown, mostly due to the increase in the size of the loans (Souza et al., 2013). Thereby, we can conclude that the surge in resource allocation is mostly related to the changes in the program’s rules and the financial changes in Brazil, rather than an increase in PRONAF outreach.
Analyzing PRONAF intensity, the statistical outcomes confirm the findings from the literature about the unequal allocation of PRONAF resources across Brazil. Wealth, knowledge, and risk significantly impact credit intensity in a municipality. Regarding the impact of the demand factor on PRONAF intensity, weobserve that the number of banks in a municipality significantly increases the intensity of the program. When a new branch is opened in a municipality, the service capacity of the financial system in that city increases, and thus, more farmers can access the credit. Hence, if more families are accessing the credit, the intensity of the program also rises.
About the wealth vector (W), as predicted in the literature, we can confirm that wealth significantly increases the intensity of PRONAF in the municipalities, which means that wealthier municipalities have access to larger loans. This occurs because the significant variables of the wealth factor (income, education, electricity, machinery, farm size, and land ownership) can directly impact the payment capacity, so credit is more accessible to municipalities that are better off in those areas. Additionally, farm size and landownership improve the borrowers’ collateral which then helps to guarantee larger loans. The significance of wealth in stimulating a higher intensity of PRONAF explains why the Northeast Region’s municipalities have a lower value of credit per household head. The largest share of farmers from that region is classified in Group B, which means that the value of income per household is much lower than in other regions of Brazil. Consequently, the average size of PRONAF loans tends to be much lower in the Northeast Region (Souza et al., 2013). This result aligns with the Belik (2015) study, which demonstrates that the average value of the contracts in the South Region in 2011 reached R$ 4,200 thousand, while the average value of contracts in the Northeast Region was R$ 825.
Additionally, the program’s rules favored the concentration of PRONAF intensity in the wealthiest farmer category (Group V) and in the regions in which they are located (Aquino & Schneider, 2011; Souza et al., 2013). At the beginning of PRONAF, there were four types of farmer classifications in the DAP: Group A; Group B; Group C; and Group D. As mentioned before, farmers’ classification in the DAP is related to their annual income level, except for Group A that there is no limit of annual income. In the harvest year 2004/2005, the family annual income needed to be below R$ 4,000 to fit the DAP criterion of Group B (Bianchini, 2015). Over the years, this criterion has changed, and now the upper annual income limit is R$ 20,000. In the harvest year 2004/2005, the annual income limit of Group C and Group D to fit the DAP was R$ 18,000 and R$ 50,000 respectively. However, in the same harvest year, a new category “E” was created, which allowed farmers with annual incomes of up to R$ 80,000 to participate in the program (Bianchini, 2015). In the harvest year of 2008/2009 the Groups C, D, and E were coupled into a single group, the Group V, whose annual income upper limit rose to R$ 110,000. In the 2013/2014 harvest year, Group V underwent another change, increasing the maximum annual income limit to R$ 360,000 (which is the current value)
(Bianchini, 2015). Therefore, the changes in PRONAF rules favored the entry of more capitalized farmers into the program. The size of the loan for Group V (maximum limit of R$ 160,000) can be 41 times higher than the value of the loans offered to Group B (R$ 4,000). As a result, municipalities with wealthier farmers, such as with a higher number of farmers in Group V, have a higher loan size per household head. Hence, although there has been an increase in the participation of farmers of Group B in the program, the concentration of the resources remains in the more consolidated categories (Resende & Mafra, 2016). Microfinancing cannot overcome the inequality problems, so credit programs will always benefit the wealthy more than the poor (Binswanger, 2006).
For the knowledge vector, all knowledge-related variables (experience, technical assistance, cooperative participation, and market integration) significantly increase the intensity of the program in a municipality. According to the rural extension companies and financial institutions, farmer’s experience is an important element in access to credit. An expert farmer usually has a more structured property and better control and management of the farm. These elements guarantee higher production to farmers, enabling them to have more access to credit. Also, ITESP states that experience in farming is one of the criteria used to select the families that are settled by the land reform in the State of São Paulo. This condition was established, because it was identified that farmers with farming knowledge are the ones that prosper, while farmers that do not have practice in farming are usually the ones that are in debt with financial institutions. Moreover, the financial institutions usually avoid giving the loan right after the family is settled, because they want to be sure that the family can have steady production and a robust source of income before offering them a loan.
Technical assistance is a key aspect that affects access to credit. According to the rural extension companies and financial institutions, a rural credit program that is not coupled with extension services cannot work efficiently. The assistance of an expert improves the productivity and income of the farm, as well as the access to information and market. However, the public rural extension companies in Brazil are very deficient, and the lack of prepared technical assistance and rural extension services is one of the main obstacles that affect the quality of PRONAF (Grisa et al., 2014). The lack of staff and resources of the public extension companies has limited the work of the extension companies to only issue the DAP and to develop PRONAF projects, while the field extension services, such as the orientation and follow up with the farmers, guidance in the methods of farming and farm management, has been ignored. In addition, only a small part of the establishments in northeastern Brazil received some type of technical assistance in 2006 and the lack of technical assistance affects the poor households more because they depend on this free service (Castro, 2013). As a result of this absence of technical assistance and credit, there was a worsening in the income distribution among the family agriculture groups (Guanziroli et al., 2012).
Participation in cooperatives is a significant factor in PRONAF intensity because it ensures a higher production scale. In addition, a cooperative can help small farmers to gain access to the market and facilitate the sale of the products while reducing transaction costs and achieving higher prices. Southern Brazil is well-known for the high number of cooperatives and the robustness of these organizations. The culture of cooperatives in the south is very strong due to the immigration process (Baiardi & Mendes, 2006). Southern Brazil was colonized by European immigrants and when these immigrants arrived in Brazil, they started to work together building a business (Baiardi & Mendes, 2006). As a result, farmers from southern Brazil have a high level of organization, which facilitates access to agroindustry and market, and, consequently, to credit (Resende & Mafra, 2016).
In the Northeast Region, the rural social structure was shaped differently. The Northeast is characterized by the high concentration of land in the hands of large landowners sustained for many years by the servile work of rural workers, who lived in precarious conditions with low economic, social, and sanitary standards (Carvalho, 2014). Moreover, the level of income, education, specialization, and technology is very deficient in the region (Baiardi & Mendes, 2006; Castro, 2013). Consequently, the culture of cooperativism did not grow in the region, which limits access to larger loans. Additionally, according to the rural extension companies and farmers’ organizations, in the Northeast Region farmers have a problem with market access. As the producers grow food at a small scale and the agroindustry in that region is
weak, the main schemes through which farmers access the market are intermediate dealers. However, this system is not always beneficial to small-scale farmers. The dealers set the price, which normally is lower than the market price and may not cover the production costs. To improve access to the market, the government has created institutional food purchase programs. The main two programs are the PAA16 (Program of Food Purchase) and PNAE17
(National Program for School Feeding). However, elite capture also plagues these programs: 70% of PAA beneficiaries are the farmers of Group V (Grisa et al., 2011). Therefore, richer and larger farmers, especially the ones engaged in cooperatives, are the ones that have more access to the market and to the food purchase programs, which allows them to have a higher income level and thus larger loans.
The covariant risk climate is widely mentioned in studies as a significant factor that reduces the access to credit (Binswanger, 2006; Food and Agriculture Organization of the United Nations, 2001; Gonzalez & Rosenberg, 2006; Khandker et al., 1995; Llanto, 2005; Sharma & Zeller, 1999; Zeller & Sharma, 1998); and for PRONAF, it has a significant impact as well (Aquino & Bastos, 2015). The Northeast Region is the only region that is located in the semi-arid zone. The main problem in the semi-arid areas is the lack of infrastructure for water storage and irrigation (Castro, 2013). These factors raise the cost of agricultural financing operations, which raises the requirement for financial agents to grant the credit (Souza et al., 2015). In addition, most farmers that live in the semi-arid area are categorized in Group B. As the credit limit of this group is very low, the households cannot build water systems. Consequently, farmers in semi-arid areas have less access to credit (Castro, 2013).
Another frequent factor mentioned in the literature that hinders access to credit is the deficiency of infrastructure, such as paved roads. Many households that live in remote areas, which usually do not have paved roads, do not have access to credit due to the high transaction and transportation costs (Binswanger et al., 1993; Gonzalez & Rosenberg, 2006; Khandker et al., 1995; Sharma & Zeller, 1999; Yaron, 1992; Zeller & Sharma, 1998). This variable is also significant in the PRONAF intensity analysis. Financial institutions, as profit-seeking organizations, will always choose the municipalities that represent less cost for the business. Furthermore, the absence of paved roads hampers access to rural extension services and markets, which also reduces the income level of the farmers (Zeller & Sharma, 1998).
Hence, we can assume that PRONAF is based on an evolutionary logic that prioritizes the most capitalized segments of family agriculture (Resende & Mafra, 2016). The government has focused on giving a greater amount of resources to the wealthier, more knowledgeable, and less risky municipalities, rather than strengthening the participation of less-developed municipalities in the program. Therefore, the rural credit policy that, in theory, should function as an equalizer of inequalities, seems to be increasing the income and production concentration in rural areas, as well as excluding important segments of family farmers (Aquino et al., 2018; Mattei, 2014).
6. Conclusions and recommendations
Through our nationally representative data analysis, we statistically confirm that there is a significant unequal allocation of PRONAF resources. Moreover, the results discussed here corroborate the literature’s explanation of the main factors that impact PRONAF’s unequal distribution. The results demonstrate that the municipalities with the largest share of families, which are represented by families in Group B and also located in the Northeast Region, are not the core focus of the program. Instead, the target groups of PRONAF are the wealthier families that have a higher knowledge level and do not live in risky areas. These results indicate a tendency of the program to benefit the segment of the most capitalized family farmers.
As is extensively mentioned in the literature, income, and collateral levels are key obstacles in rural finance programs. However, it is not advisable to recommend the removal of the collateral and payment capacity criteria of the program’s rules, because it would
16Programa de Aquisição de Alimentos (PAA). 17Programa Nacional de Alimentação Escolar (PNAE).