DOI: 10.7127/rbai.v14n101152
Protocolo 1152.20 – 24/04/2019 Aprovado em 23/06/2020
AVAILABLE WATER CONTENT FOR THE MANAGEMENT OF IRRIGATED CROPS IN THE NORTHWESTERN REGION OF PARANA STATE
Jonez Fidalski1, Celso Helbel Junior2 ABSTRACT
Pedotransfer functions of the available water content (AWC) as a function of the granulometric variability may contribute to irrigation management. The aim of this study was to generate pedotransfer functions to estimate soil water retention curves and AWC fractions in soils in the Northwestern Region of Parana State (Brazil) to manage water in irrigated systems with different crops.In 2016, soil sampling was carried out for granulometric determinations (total sand content, five sand fractions, silt, clay), total organic carbon, and water retention for eight soil water tensions at 0-0.20, 0.20-0.40, and 0.40-0.60 m deep. These evaluations were made in eleven irrigated areas of six watersheds in the Northwestern of Parana, having pasture in fixed conventional sprinkler irrigation systems. The soil water retention of this region is highly dependent on the proportion of fine sand fraction and practicality to be estimated by the total sand content between 550 to 910 g kg-1. The pedotransfer functions of the AWC fractions between 20% and 65% will allow estimating the water content and tensions as a function of the total sand content in the soil for the water management of crops of these regions.
Keywords: soil water, Caiuá sandstone, water retention curve, pedotransfer functions, soil texture.
CONTEÚDO DE ÁGUA DISPONÍVEL PARA O MANEJO DAS CULTURAS IRRIGADAS NA REGIÃO NOROESTE DO PARANÁ
RESUMO
As funções de pedotransferências do conteúdo de água disponível (CAD) em função da variabilidade granulométrica poderá contribuir com o manejo da irrigação. Objetivou-se gerar funções de pedotransferências para estimar as curvas de retenção de água no solo e as frações do CAD em solos na 1 Doutor em Agronomia, Pesquisador da Área de Solos, Instituto de Desenvolvimento Rural do Paraná – IAPAR-EMATER (IDR-Paraná). Paranavaí – PR. Brazil. E-mail: [email protected]
Região no Noroeste do Estado do Paraná (Brasil) para o manejo da água em sistemas irrigados com diferentes culturas agrícolas. Em 2016 foi realizada a amostragem de solo para as determinações granulométricas (teores de areia total, cinco frações de areia, silte, argila) e carbono orgânico total, e as retenções de água para oito tensões de água no solo a 0-0,20, 0,20-0,40 e 0,40-0,60 m de profundidade. Essas avaliações foram realizadas onze áreas irrigadas em onze áreas irrigadas de seis bacias hidrográficas do Noroeste do Paraná, que apresentavam pasto em sistemas de irrigação por aspersão convencional fixos. A retenção da água nos solos desta região apresenta maior dependência à proporção da fração de areia fina e praticidade para ser estimada pelo teor de areia total entre 550 a 910 g kg-1. As funções de pedotransferências das frações de CAD entre 20% a 65% permitirão estimar os conteúdos e as tensões de água em função dos teores de areia total no solo, para o manejo hídrico das culturas agrícolas no Noroeste do Paraná.
Palavras-chave: água no solo, Arenito Caiuá, curva de retenção de água, funções de pedotrasferências, textura do solo.
INTRODUCTION
Based on soil water retention curves, it is possible to define the right moment and the adequate amount of water to be applied to the soil by irrigation (MICHELON et al., 2010; BARRETO et al., 2011).
Determinations of physical and water attributes of the soil are more complex to obtain and make it available to technical assistance and irrigators. In this regard, the models for both attributes have been developed indirectly, relating edaphic variables that are difficult to determine, from others more easily obtained, called pedotransfer functions (BOUMA, 1989).
Pedotransfer functions describe the relationships among the soil physical attributes such as texture (sand, silt, and clay), soil density, particle density, and organic matter or total organic carbon with hydraulic properties and functions, with soil water retention curve (McBRATNEY et al., 2002; FIDALSKI et al., 2010; HAGHVERDI et al., 2014).
Soil water retention prediction is increasing based on soil water stresses from pedotransfer functions by mineral and organic fractions of the soil (BARROS et al., 2013; MEDEIROS et al., 2014). It can be generated for soil water retention curve models (MEDEIROS et al., 2014), or specifically, for certain soil water tensions such as soil water content corresponding to field capacity and
permanent wilt point (BORTOLINI; ALBUQUERQUE, 2018; FIDALSKI et al., 2013; MEDEIROS et al., 2014).
Special attention should be given to peculiarities of the soil that allowed to generate the pedotransfer functions, as they present a high prediction error to their use in other regions (OLIVEIRA et al., 2002), besides the variables that will be included or excluded (ZACHARIAS; WESSOLEK, 2007). However, water retention in sandy soils has been described from pedotransfer functions by sand fractions (FIDALSKI et al., 2013; AULER et al., 2017; PARAHYBA et al., 2019) and total organic carbon content (MACHADO et al., 2008; FIDALSKI et al., 2010).
Irrigation has been used in the Northwestern Region of Parana State (Brazil) with approximately 30,000 km2, equivalent to 15% of the area of the State of Parana (HELBEL JUNIOR; FIDALSKI, 2019), in soils with a predominance of Caiuá sandstone from Bauru Group (Latosol, Argisol, and Neosol respectively, 48%, 41%, and 1%), and low frequency of basalt soil from the Serra Geral Formation of the São Bento Group, as Nitisol (OLIVEIRA et al., 2020).
The objective of this study was to generate pedotransfer functions to estimate soil water retention curves and AWC fractions in soils in the Northwest Region of Parana State to manage water in irrigated systems with different crops.
MATERIAL AND METHODS In 2016, the characterization of physical and water attributes of soils was
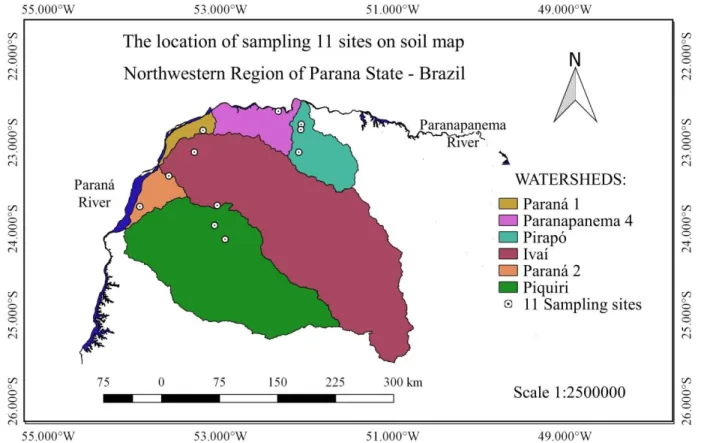
carried out in eleven fixed irrigated pasture areas, in five watersheds, in the Northwestern Region of Parana State, Brazil (Figure 1).
Figure 1. Location of the eleven sampling sites irrigated areas in six watersheds in the Northwestern Region of Parana State, Brazil (INSTITUTO DE ÁGUAS DO PARANÁ, 2020).
The physical characterization in the eleven irrigated pastures consisted of deformed soil samples composed of six replications, at layers of 0-0.20, 0.20-0.40, and 0.40-0.60 m deep, to represent a homogeneous irrigated area, followed by soil granulometric determinations using pipette method and total organic carbon (TEIXEIRA et al., 2017).
Total sand contents were divided into five fractions: very coarse sand (1 – 2 mm), coarse sand (0.5 – 1 mm), medium sand (0.25 – 0.50 mm), fine sand (0.125 – 0.250 mm), and very fine sand (0.053 – 0.125-mm), similar to the standardization of methods for granulometric analysis in Brazil (ALMEIDAS et al., 2012).
The water characterization was carried out using the soil samples collected from each of the ten irrigated areas, in layers of 0-0.20, 0.20-0.40, and 0.40-0.60 m deep, with six replications for non-deformed samples adopted for the soil water content determination using tension tables (3, 6 and, 10 kPa), and by Richards pressure chamber (33, 100, 300, 500, and 1500 kPa), as described by Teixeira et al. (2017). Subsequently, the non-deformed soil samples were dried in greenhouses (105° C), until reaching a constant weight. Then, it was weighed to determine the dry soil mass, soil density, and volumetric water content (TEIXEIRA et al., 2017).
Average data at 0-0.60 m deep (n = 33) of the soil water content for soils subjected to eight soil water tensions were adjusted to total sand contents, five sand fractions, clay, and organic carbon total through simple and multiple linear regressions, such as the angular coefficients submitted to the t-test (BEIGUELMAN, 1994), to get the pedotransfer functions.
Estimated data of the soil water content as a function of the soil water stress in pedotransfer functions from given granulometry were used to obtain the soil water retention curves by the non-linear model with the restriction m = [1 − (1/n)] (GENUCHTEN, 1980), according to procedures described by Maia et al. (2009).
The values of water content and tensions in the soil corresponding to the fractions of 20, 25, 30, 35, 40, 45, 50, 55, 60, and 65% of the AWC (n = 10), recommended for the management of irrigation of different cultures
(ALLEN et al., 1998), were obtained from the soil water retention curves for the contents of 500, 550, 600, 650, 700, 750, 800, 850, and 910 g kg-1 of total sand.
The linear regression equations (pedotransfer functions) of the water content and water stresses in the soil from each of the ten fractions of the AWC were obtained as a function of the total sand content.
RESULTS AND DISCUSSION The set of granulometric data at 0.60 m deep allows the characterization of the predominance of total sand and sand fractions of 0.250-0.125 mm, 0.50-0.25mm, and 0.125 -0.053mm, compared to the levels clay and silt (Table 1).
Table 1. Descriptive statistics for the particle size and total organic carbon variables in the layer of 0-0.60 m deep.
Variable Minimum Mean Maximum
(g kg-1)
Total sand 550 778 910
Silt 10 34 80
Clay 70 188 390
Very coarse sand (1 – 2 mm)1 0 1 5
Coarse sand (0.5 – 1 mm)1 0 15 60
Medium sand (0.25 – 0.50 mm)1 4 200 400
Fine sand (0.125 – 0.250 mm)1 172 380 584
Very fine sand (0.053 – 0.125-mm)1 71 148 256
Total organic carbon 2 7 18
1 Almeida et al. (2012).
The textural variability of the 33 layers with 0.20 m thickness was characterized by the sandy (<150 g kg-1 clay), medium (150-350 g kg-1 clay), and clay (350-390 g kg-1 clay) textural groups, respectively, 48.48%, 42.42%, and 9.09% (SANTOS et al., 2018).
In irrigated areas located on the Northwestern Region of Parana State, soils were
found with a predominance of fine sand fraction, associated with low total organic carbon contents (Table 1), typical of these sites (THOMAZ; FIDALSKI, 2020).
Coefficients of determinations (r2) of the simple pedotransfer functions grew in the increasing sequence of the total carbon, total sand, and clay contents for the estimates of the
soil water content and soil water tensions (Table 2), without the influence of the low silt contents
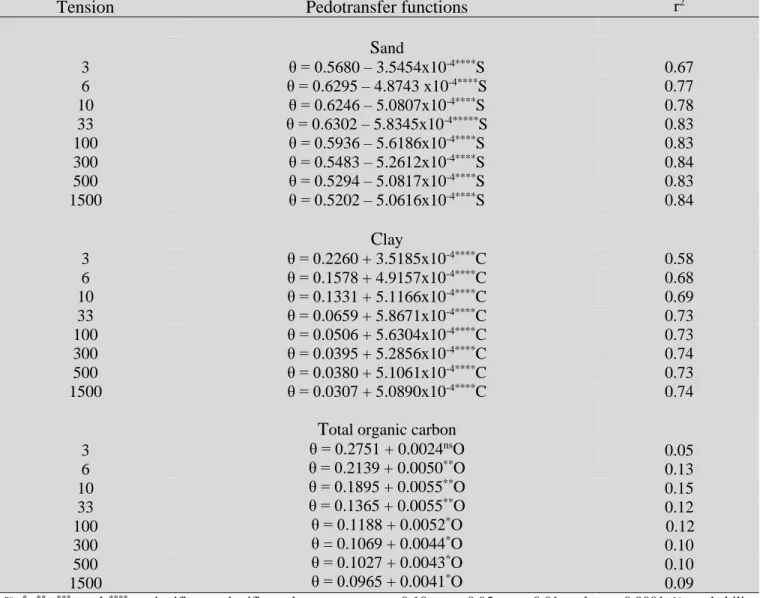
(Table 1), with angular coefficients of the linear regressions considered not significant. Table 2.Pedotransfer functions for soil water content (θ; m3 m-3) as a function of total sand content (S; g kg-1); clay content (C; g kg-1); and total organic carbon content (O; g kg-1) in the layer of 0-0.60 m deep for different soil water tensions (Tension; kPa).
Tension Pedotransfer functions r2
Sand 3 θ = 0.5680 – 3.5454x10⁻⁴****S 0.67 6 θ = 0.6295 – 4.8743 x10⁻⁴****S 0.77 10 θ = 0.6246 – 5.0807x10⁻⁴****S 0.78 33 θ = 0.6302 – 5.8345x10⁻⁴*****S 0.83 100 θ = 0.5936 – 5.6186x10⁻⁴****S 0.83 300 θ = 0.5483 – 5.2612x10⁻⁴****S 0.84 500 θ = 0.5294 – 5.0817x10⁻⁴****S 0.83 1500 θ = 0.5202 – 5.0616x10⁻⁴****S 0.84 Clay 3 θ = 0.2260 + 3.5185x10⁻⁴****C 0.58 6 θ = 0.1578 + 4.9157x10⁻⁴****C 0.68 10 θ = 0.1331 + 5.1166x10⁻⁴****C 0.69 33 θ = 0.0659 + 5.8671x10⁻⁴****C 0.73 100 θ = 0.0506 + 5.6304x10⁻⁴****C 0.73 300 θ = 0.0395 + 5.2856x10⁻⁴****C 0.74 500 θ = 0.0380 + 5.1061x10⁻⁴****C 0.73 1500 θ = 0.0307 + 5.0890x10⁻⁴****C 0.74 3 0.05 6 0.13 10 0.15 33 0.12 100 0.12 300 0.10 500 0.10 1500
Total organic carbon θ = 0.2751 + 0.0024nsO θ = 0.2139 + 0.0050**O θ = 0.1895 + 0.0055**O θ = 0.1365 + 0.0055**O θ = 0.1188 + 0.0052*O θ = 0.1069 + 0.0044*O θ = 0.1027 + 0.0043*O θ = 0.0965 + 0.0041*O 0.09
ns, *, **, ***, and **** nosignificant, significant by test-t, at p < 0.10, p < 0.05, p < 0.01 and p < 0.0001 % probability, respectively.
These results corroborate the superior water retention in soils of the Paranavaí Formation, due to the fraction of fine sand, between 0.02-0.2 mm (SANTOS et al., 2005; FIDALSKI et al., 2013), as shown in Table 1.
The high r2 values of the linear regression equations indicate that the pedotransfer
functions obtained presented good precision for the estimation of the contents and tensions of the water in the soil (Tables 2 and 3). Similar results were found by Oliveira et al. (2002), considering the fractions sand, silt, clay, and soil density to estimate the water content in the soil (MICHELON et al., 2010).
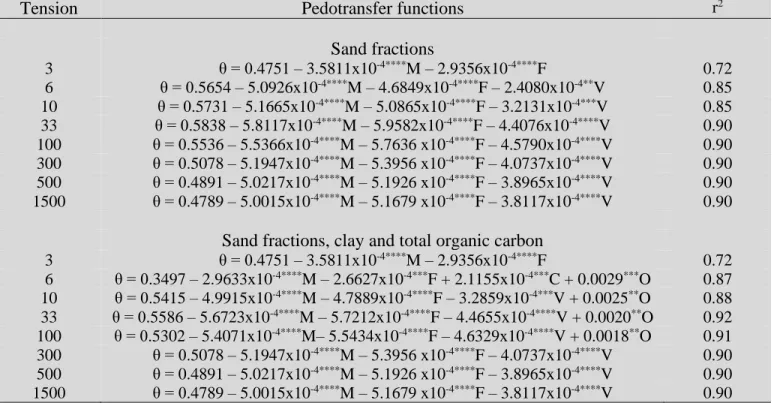
Table 3. Pedotransfer functions for soil water content (θ; m3 m-3) as a function of sand fractions, medium (M; g kg-1), fine (F; g kg-1), very fine (V; g kg-1), clay (C; g kg-1) and total organic carbon (O; g kg-1) in the layer of 0-0.60 m deep for different soil water tensions (Tension; kPa).
Tension Pedotransfer functions r2
Sand fractions 3 θ = 0.4751 – 3.5811x10⁻⁴****M – 2.9356x10⁻⁴****F 0.72 6 θ = 0.5654 – 5.0926x10⁻⁴****M – 4.6849x10⁻⁴****F – 2.4080x10⁻⁴**V 0.85 10 θ = 0.5731 – 5.1665x10⁻⁴****M – 5.0865x10⁻⁴****F – 3.2131x10⁻⁴***V 0.85 33 θ = 0.5838 – 5.8117x10⁻⁴****M – 5.9582x10⁻⁴****F – 4.4076x10⁻⁴****V 0.90 100 θ = 0.5536 – 5.5366x10⁻⁴****M – 5.7636 x10⁻⁴****F – 4.5790x10⁻⁴****V 0.90 300 θ = 0.5078 – 5.1947x10⁻⁴****M – 5.3956 x10⁻⁴****F – 4.0737x10⁻⁴****V 0.90 500 θ = 0.4891 – 5.0217x10⁻⁴****M – 5.1926 x10⁻⁴****F – 3.8965x10⁻⁴****V 0.90 1500 θ = 0.4789 – 5.0015x10⁻⁴****M – 5.1679 x10⁻⁴****F – 3.8117x10⁻⁴****V 0.90
Sand fractions, clay and total organic carbon
3 θ = 0.4751 – 3.5811x10⁻⁴****M – 2.9356x10⁻⁴****F 0.72 6 θ = 0.3497 – 2.9633x10⁻⁴****M – 2.6627x10⁻⁴***F + 2.1155x10⁻⁴***C + 0.0029***O 0.87 10 θ = 0.5415 – 4.9915x10⁻⁴****M – 4.7889x10⁻⁴****F – 3.2859x10⁻⁴***V + 0.0025**O 0.88 33 θ = 0.5586 – 5.6723x10⁻⁴****M – 5.7212x10⁻⁴****F – 4.4655x10⁻⁴****V + 0.0020**O 0.92 100 θ = 0.5302 – 5.4071x10⁻⁴****M– 5.5434x10⁻⁴****F – 4.6329x10⁻⁴****V + 0.0018**O 0.91 300 θ = 0.5078 – 5.1947x10⁻⁴****M – 5.3956 x10⁻⁴****F – 4.0737x10⁻⁴****V 0.90 500 θ = 0.4891 – 5.0217x10⁻⁴****M – 5.1926 x10⁻⁴****F – 3.8965x10⁻⁴****V 0.90 1500 θ = 0.4789 – 5.0015x10⁻⁴****M – 5.1679 x10⁻⁴****F – 3.8117x10⁻⁴****V 0.90
*, **, ***, and **** significant by test-t, at p < 0.10, p < 0.05, p < 0.01 and p < 0.0001 % probability, respectively.
Furthermore, considering the contribution of each independent variable, it was possible to verify that only the total sand content may be used to develop predictive equations of the soil water content. This option is consistent with the predominance of sand in soils located in the Northwestern Region of Parana State (Table 1).
The levels of total sand exhibited r2 broader than the descriptions of water retention in the soil at the tension of 1500 kPa as a function of total organic carbon content and clay for similar soils (MACHADO et al., 2008; FIDALSKI et al., 2010). The retention of water content in the soil was expressed by the functions of pedotransferences dependent on the sand fractions of 0.50-0.25 mm, 0.250-0.125 mm, and 0.125-0.053 mm (Table 3), presenting a higher dependence on very fine fractions (FIDALSKI et al., 2013).
Pedotransfer functions increased the r2 of the sand fractions when the contents of clay and total organic carbon were added (Table 3). In
the soil water tensions of 6 kPa, there was an influence of the content of clay and total organic carbon, and between 10 to 100 kPa there was more water retention in the soil with the addition of the total organic carbon contents for the sand fractions of 0.125-0.053 to 0.50-0.25 mm.
The total organic carbon content increased the soil water retention, from 6 to 100 kPa segment, coincided with the decrease in the soil water content, with the increase in the proportion of total sand with values between 500 to 910 g kg-1 (MACHADO et al., 2008; FIDALSKI et al., 2010, 2013).
The increase in water retention is attributed to the finer sand (0.25-0.125 mm) fraction, with a lower coefficient of variation, than by the levels of clay or total organic carbon (Tables 1, 2, and 3). That is the reason why the total sand content (Table 2) could be used to estimate the content of water and tensions in the soil (FIDALSKI et al., 2013).
The option for total sand contents is due to the lower or higher differences of r2 (0.05-0.10) with the other pedotransfer functions (Tables 2 and 3), by practicality and lower costs to farmers to determinations of the sand fractions and total organic carbon, sometimes already available for certain stands of agricultural properties.
Moreover, it is more coherent a technical discussion of water retention in sandy soils, between technical assistance and farmers in
Northwestern Region of Parana State, based on total sand content (Table 1), than based on clay and total organic carbon contents, due to the predominance of this granulometry (THOMAZ; FIDALSKI, 2020).
The inflections of water retention curves of saturated soils started draining at 6 kPa for 550 g kg-1 of total sand and decrease at 2 kPa to 910 g kg-1 of total sand (Figure 2). This characterizes the greater drainage of these soils due to the increase in the total sand contents.
Figure 2. Soil Water content (θ) as a function of soil water tension (Ψ) for the contents of 500 to 910 g kg-1 of total sand with the equations of the retention curves (GENUCHTEN, 1980). ○ It corresponds to the proportions of 20, 25, 30, 35, 40, 45, 50, 55, 60, and 65% of AWC.
The values of the parameters n of the water retention curves in the soil changed the water content in the soil corresponding to the field capacity and permanent wilting point at AWC from 0.34 to 0.10 m3 m-3, respectively, to the total sand content of 550 at 910 g kg-1 (Figure 2), compatible for sandy soils (VERMEIREN; JOBLING, 1997). Bases on pedotransfer functions from the soil water
retention curves, for the estimation of contents and tensions of water in the soil in the total sand contents of 500 to 910 g kg-1, it was possible to get these parameters to AWC fractions between 20% to 65% (Figure 2). Pedotransfer functions of the contents (0.10 to 0.34 m3; Figure 3A) and water stress (14 to 120 kPa; Figure 3B) in the soil based on the total sand contents for the 20% AWC fractions at 65%, will be useful for the 0.00 0.05 0.10 0.15 0.20 0.25 0.30 0.35 0.40 S o il w at er c o n te n t − θ ( m 3 m -3 )
Soil water tension − Ψ (kPa)
550 600 650 700 750 800 850 910 1 10 100 1500 θs=0.3869 θr=0.2107 α =0.1613 n=1.3268 θs=0.3784 θr=0.1897 α =0.2476 n=1.3347 θs=0.3734 θr=0.1689 α =0.3505 n=1.3603 θs=0.3714 θr=0.1489 α =0.4554 n=1.3974 θs=0.3703 θr=0.1285 α =0.5273 n=1.4457 θs=0.3688 θr=0.1069 α =0.5706 n=1.4985 θs=0.3628 θr=0.0847 α =0.5668 n=1.5587 θs=0.3481 θr=0.0571 α =0.5216 n=1.6379 ○ 20% a 65% AWC θ = θr + {( θs – θr) / {1 + (αΨ)n](n-1}
management of water slide replacement, thus, supplying the water needs of irrigated crops in
sandy soils in Northwestern Region of Parana State (Figure 2).
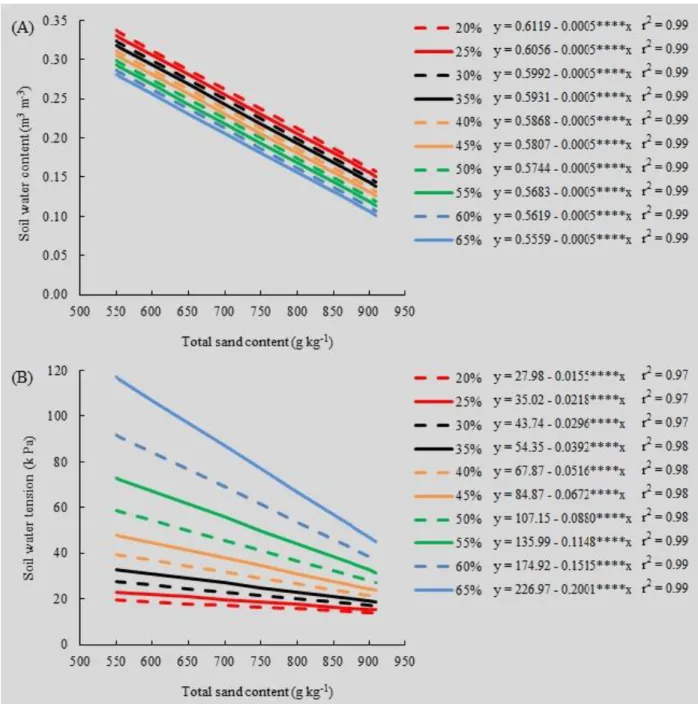
Figure 3. Soil water content (A) and soil water tension (B) as a function of the total sand content for ten AWC fractions. **** Significant by test-t at p < 0.0001 probability.
The potential for using these AWC fractions is wide, for instance, in a study conducted by Helbel Junior and Fidalski (2019), they monitored a pasture with 50% of the AWC in a sprinkler irrigation system using tensiometers below its operating capacity of 85 kPa (LIBARDI, 2012).
Alternatively, the application of these pedotransfer functions (Figure 3) can be simplified for regional technical assistance, making the values of content and water tensions in the soil available in tables for each of the fractions, as the table for pasture with 50% of AWC (FIDALSKI et al., 2020).
AWC fractions as a function of total sand content should be used to define irrigation management, estimating the water content (Figure 3A), and stresses (Figure 3B) for each of the homogeneous soil layers that occur in the Northwestern Region of Parana State (THOMAZ, FIDALSKI, 2020), enabling the monitoring of the profiles of these soils.
Pedotransfer functions of the AWC fractions are very useful for monitoring irrigation by estimating water content and tensions as a function of total sand content in the soil, either through equipment such as water meters, tensiometers, or to supply technical information in irrigation software.
CONCLUSION
Soil water retention in Northwestern Region of Parana State is highly dependent on the proportion of fine sand fraction and practicality to be estimated by the total sand content between 550 to 910 g kg-1.
Pedotransfer functions of AWC fractions between 20% and 65% will allow estimating the water and tensions contents according to the total sand content in the soil, for the water management of crops in this region.
ACKNOWLEDGMENT
To the group of the Reference Networks for Family Farming by indications of rural properties with irrigated pastures and the S&T Assistant, Paulo Henrique Almeida Parpinelli, for collecting soil samples, both from the Paraná Rural Development Institute - IAPAR-EMATER (IDR-Parana).
REFERENCES
INSTITUTO DE ÁGUAS DO PARANÁ. Bacias Hidrográficas do Paraná. Curitiba, 2020.
Disponivel em: <
http://www.aguasparana.pr.gov.br/pagina-80.html>. Acessado em: 8 jun. 2020.
ALLEN, R. G.; PEREIRA, L. S.; RAES, D.; SMITH, M. Crop evapotranspiration-guidelines for computing crop water requeriments. Rome: FAO, 1998. (FAO – Irrigationand Drainage Paper, 56).
ALMEIDA, B. G.; DONAGEMMA, G. K.; RUIZ, H. A.; BRAIDA, J. A.; VIANA, J. H. M.; REICHERT, J. M. M.; OLIVEIRA, L. B.; CEDDIA, M. B.; WADT, P. S.; FERNANDES, R. B. A.; PASSOS, R. R.; DECHEN, S. C. F.; KLEIN, V. A.; TEIXEIRA, W. G. Padronização de Métodos para Análise Granulométrica no Brasil. Embrapa: Rio de Janeiro, 2012. 11 p. (Comunicado Técnico, 16).
Disponível em:
<https://www.infoteca.cnptia.embrapa.br/bitstre am/doc/950832/1/ComTec66AnaliseGranulome trica.pdf>. Acessado em 22 abr. 2020.
AULER, A. C.; PIRES, L. F.; PINEDA, M. C. Influence of physical attributes and pedotransfer function for predicting water retention in management systems. Revista Brasileira de Engenharia Agrícola e Ambiental, v. 21, n.
11, p. 746-751, 2017.
http://dx.doi.org/10.1590/1807-1929/agriambi.v21n11p746-751
BARRETO, H. B.; BATISTA, R.O.; FREIRE, F. G. C.; SANTOS, W. O.; COSTA, F. G. B. Análises de indicadores de retenção e armazenamento de água no solo do perímetro irrigado Gorutuba, em Janaúba-MG. Revista Verde, v. 6, n. 5, p. 189-192. 2011. <http://www.gvaa.com.br/revista/index.php/RV ADS/article/view/836>. Acessado em: 22 mar. 2020.
BARROS, A. H. C.; LIER, Q. J.; MAIA, A. H. N.; SCARPARE, F. V. Pedotransfer functions to estimate water retention parameters of soils in northeastern Brazil. Revista Brasileira de
Ciência do Solo, v. 37, n. 2, p. 379-391, 2013.
http://dx.doi.org/10.1590/S0100-06832013000200009
BEIGUELMAN, B. Curso prático de bioestatística. 3 ed. Ribeirão Preto: Revista Brasileira de Genética, 1994. 244p.
BORTOLINI, D.; ALBUQUERQUE, J. A. Estimation of the retention and availability of water in soils of the State of Santa Catarina. Revista Brasileira de Ciência do Solo, v.
42(e0170250), 2018.
https://doi.org/10.1590/18069657rbcs20170250 BOUMA, J. Using soil survey data for quantitative land evaluation. In: STEWART, B. A. (Eds.). Advances in Soil Science, New York: Springer, v. 9, p. 177-213, 1989.
FIDALSKI, J.; TORMENA, C. A.; ALVES, S. J.; AULER, P. A. M. Influência das frações de areia na retenção e disponibilidade de água em solos das Formações Caiuá e Paranavaí. Revista Brasileira de Ciência do Solo, v. 37, n. 3, p.
613-621, 2013.
http://dx.doi.org/10.1590/S0100-06832013000300007
FIDALSKI, J.; TORMENA, C. A.; SILVA, Á. P. Least limiting water range and physical quality of soil under groundcover management systems in citrus. Scientia Agricola, v. 67, n. 4,
p. 448-453, 2010.
https://doi.org/10.1590/S0103-90162010000400012
FIDALSKI, J.; HELBEL JUNIOR, C.; ALMEIDA, E. L. D. Manejo de água no solo para irrigação de pastagens na região Noroeste do Paraná. Instituto Emater: Curitiba,
2020. 13 p. Disponível em:
<http://www.emater.pr.gov.br/arquivos/File/Bib lioteca_Virtual/ManejoSoloAgua/ManejoAguaS oloParaIrrigacaoPastagensNoroeste.pdf>. Acessado em: 20 abr.2020. https://doi: 10.13140/RG.2.2.21163.59685
GENUCHTEN, M. T. A closed-form equation for predicting the hydraulic conductivity of unsaturated soils. Soil Science Society of America Journal, v. 44, p. 892-898, 1980. doi: 10.2136/sssaj1980.03615995004400050002x HAGHVERDI, A.; ÖZTÜRK, H. S.; CORNELIS, W. M. Revisiting the pseudo continuous pedotransfer functions concept: Impacto of data quality and data mining method. Geoderma, v. 226-227, p. 31-38, 2014. https://doi.org/10.1016/j.geoderma.2014.02.026 HELBEL JUNIOR, C.; FIDALSKI, J. Monitoramento da tensão da água do solo em pastagem no Arenito Caiuá do Noroeste do Paraná. In: SIMPÓSIO BRASILEIRO DE SOLOS ARENOSOS, 3., Campo Grande. Anais... Brasília, DF: Embrapa, 2019. p.
165-169. Disponível
em:<https://redeilpf.org.br/arquivos/Anais-do- III-Simposio-Brasileiro-de-Solos-Arenosos-2019.pdf>. Acessado em: 20 abr. 2020.
LIBARDI, P. L. Dinâmica da água no solo. 2. ed. São Paulo: Edusp, 2012, 346 p.
MAIA, A. H. N.; RODRIGUES, L. N.; PASSO, D. P. Programa SAS para ajuste de curvas de retenção. In: CONGRESSO BRASILEIRO DE CIÊNCIA DO SOLO, 32., 2009, Fortaleza. Anais... O solo e a produção de bioenergia: perspectivas e desafios. Fortaleza: UFC: SBCS,
2009. 1 CD. Disponível em:
<http://ainfo.cnptia.embrapa.br/digital/bitstream /item/143651/1/2009AA-117.pdf>. Acessado em: 15 abr. 2020.
MACHADO, J. L.; TORMENA, C. A.; FIDALSKI, J.; SCAPIM, C. A. Inter-relações entre as propriedades físicas e os coeficientes da curva de retenção de água de um Latossolo sob diferentes sistemas de uso. Revista Brasileira de Ciência do Solo, v. 32, n. 2, p. 495-502, 2008. https://doi.org/10.1590/S0100-06832008000200004
McBRATNEY, A. B.; MINASNY, B.; CATTLE, S. R.; VERVOORT, R. W. From pedotransfer functions to soil inference systems. Geoderma, v. 109, n. 1-2, p. 41-73, 2002. https://doi.org/10.1016/S0016-7061(02)00139-8 MEDEIROS, J. C.; COOPER, M.; ROSA, J. D.; GRIMALDI, M.; COQUET. Y. Assessment of pedotransfer functions for estimating soil water retention curves for the amazon region. Revista Brasileira de Ciência do Solo, v. 38, n. 3, p.
730-743, 2014.
http://dx.doi.org/10.1590/S0100-06832014000300005.
MICHELON, C. J.; CARLESSO, R.;
OLIVEIRA, Z. B.; KNIES, A. E.; PETRY, M. T.; MARTINS, J. D. Funções de pedotransferência para estimativa da retenção de água em alguns solos do Rio Grande do Sul. Ciência Rural, v. 40, n. 4, p. 848-853, 2010. https://doi.org/10.1590/S0103-84782010005000055 OLIVEIRA, L. B.; RIBEIRO, M. R.; JACOMINE, P. K. T.; RODRIGUES, J. J. V.; MARQUES, F. A. Funções de
pedotransferência para predição da umidade retida a potenciais específicos em solos do Estado de Pernambuco. Revista Brasileira de Ciência do Solo, v. 26, n. 2, p. 315-323, 2002.
https://doi.org/10.1590/S0100-06832002000200004.
OLIVEIRA, J. G.; NOWATZKI, A.; SANTOS, L. J. C. Utilização de atributos topográficos no mapeamento de suscetibilidade erosiva na área rural do município de Paranavaí – PR. Revista Cerrados, v. 15, n, 2, p. 201-219, 2020. https://doi.org/10.22238/rc24482692v15n22017 p201a219
PARAHYBA, R. B. V.; ARAÚJO, M. do S. B.; ALMEIDA, B. G.; NETO, F. C. R.; SAMPAIO, E. V. S. B.; CALDAS, A. M. Water retention capacity in Arenosols and Ferralsols in a
semiarid area in the state of Bahia, Brazil. Anais da Academia Brasileira de Ciências, v. 91, n.
4 (e20181031), 2019.
http://dx.doi.org/10.1590/0001-3765201920181031
SANTOS, R. D.; LEMOS, R. C.; SANTOS, H. G.; KER, J. C.; ANJOS, L. H. C. Manual de descrição e coleta de solo no campo. 5. ed. Viçosa: Sociedade Brasileira de Ciência do Solo, 2005. 100 p.
SANTOS, H. G.; JACOMINE, P. K. T.; ANJOS, L. H. C.; OLIVEIRA, V. Á.; LUMBRERAS, J. F.; COELHO, M. R.; ALMEIDA, J. A.; ARAÚJO FILHO, J. C.; OLIVEIRA, J. B.; CUNHA, T. J. F. Sistema Brasileiro de Classificação de Solos. 5. ed., Brasília, DF: Embrapa, 2018. 356 p.
TEIXEIRA, P. C. DONAGEMMA, G. K.; FONTANA, A.; TEIXEIRA, W. G. Manual de métodos de análise de solo. 3 ed. Brasília, DF: Embrapa, 2017. 574 p. Disponível em: <https://www.infoteca.cnptia.embrapa.br/handle /doc/1085209>. Acessado em: 15 abr. 2020. THOMAZ, E. L.; FIDALSKI, J. Interrill erodibility of different sandy soils increases along a catena in the Caiuá Sandstone Formation. Revista Brasileira de Ciência do Solo, v. 44 (e0190064), p. 1-13, 2020. https://doi.org/10.36783/18069657rbcs2019006 4
VERMEIREN, L.; JOBLING, G. A. Irrigação localizada. Campina Grande: UFPB, 1997. 184 p. (Estudos FAO: Irrigação e Drenagem, 36).
ZACHARIAS, S.; WESSOLEK, G.
Excluding organic matter content from pedotransfer predictors of soil water retention. Soil Science Society of America, v, 71, n. 1, p. 43-50, 2007. https://doi:10.2136/sssaj2006.0098