PEDOTRANSFER FUNCTIONS TO ESTIMATE WATER
RETENTION PARAMETERS OF SOILS IN NORTHEASTERN
BRAZIL
(1)Alexandre Hugo Cezar Barros(2), Quirijn de Jong van Lier(3), Aline de Holanda Nunes Maia(2) & Fábio Vale Scarpare(4)
SUMMARY
Pedotransfer functions (PTF) were developed to estimate the parameters (ααααα, n, θθθθθr and θθθθθs) of the van Genuchten model (1980) to describe soil water retention curves. The data came from various sources, mainly from studies conducted by universities in Northeast Brazil, by the Brazilian Agricultural Research Corporation (Embrapa) and by a corporation for the development of the São Francisco and Parnaíba river basins (Codevasf), totaling 786 retention curves, which were divided into two data sets: 85 % for the development of PTFs, and 15 % for testing and validation, considered independent data. Aside from the development of general PTFs for all soils together, specific PTFs were developed for the soil classes Ultisols, Oxisols, Entisols, and Alfisols by multiple regression techniques, using a stepwise procedure (forward and backward) to select the best predictors. Two types of PTFs were developed: the first included all predictors (soil density, proportions of sand, silt, clay, and organic matter), and the second only the proportions of sand, silt and clay. The evaluation of adequacy of the PTFs was based on the correlation coefficient (R) and Willmott index (d). To evaluate the PTF for the moisture content at specific pressure heads, we used the root mean square error (RMSE). The PTF-predicted retention curve is relatively poor, except for the residual water content. The inclusion of organic matter as a PTF predictor improved the prediction of parameter ααααα of van Genuchten. The performance of soil-class-specific PTFs was not better than of the general PTF. Except for the water content of saturated soil estimated by particle size distribution, the tested models for water content prediction at specific pressure heads proved satisfactory. Predictions of water content at pressure heads more negative than -0.6 m, using a PTF considering
(1) Part of the PhD Thesis of the first author, "Luiz de Queiroz" College of Agriculture, University of São Paulo (USP). Received
for publication on March 28, 2012 and approved on December 19, 2012.
(2) Brazilian Agricultural Research Corporation (Embrapa). E-mail: [email protected]; [email protected] (3) Center for Nuclear Energy in Agriculture, University of São Paulo (CENA/USP). E-mail: [email protected]
(4) Laboratório Nacional de Ciência e Tecnologia do Bioetanol (CTBE/CNPEM). E-mail: [email protected]
particle size distribution, are only slightly lower than those obtained by PTFs including bulk density and organic matter content.
Index terms: soil water retention curve, tropical soils.
RESUMO:FUNÇÕES DE PEDOTRANSFERÊNCIA PARA A ESTIMATIVA DE
PARÂMETROS DA CURVA DE RETENÇÃO DE SOLOS DO NORDESTE BRASILEIRO
Foram desenvolvidas funções de pedotransferência (PTFs) para estimar os parâmetros (α, n, θr e θs) do modelo de van Genuchten (1980), utilizados para descrever curvas de retenção de água no solo. Os dados usados foram provenientes de diversas fontes, principalmente de estudos realizados na Região Nordeste pelas universidades, pela Embrapa e Codevasf, totalizando 786 curvas de retenção, que foram divididas em dois conjuntos de dados: 85 %, para desenvolvimento das PTFs, e 15 %, para teste e validação, considerados como dados independentes. Além do desenvolvimento das PTFs de caráter geral para todos os solos conjuntamente, desenvolveram-se PTFs específicas para as classes Argissolos, Latossolos, Neossolos e Planossolos, utilizando técnicas de regressão múltipla, com o uso do procedimento stepwise (forward e backward), para selecionar os melhores preditores. Dois tipos de PTFs foram desenvolvidos: o primeiro inclui todos os preditores, densidade do solo, teores de areia, silte, argila e de matéria orgânica, e o segundo, apenas com os teores de areia, silte e argila. A avaliação da adequação das PTFs foi com base no coeficiente de correlação (R) e índice de Willmott (d). Para avaliar as PTFs, para o teor de água em potenciais matriciais específicos, utilizou-se a raiz do erro médio quadrado (RMSE). A predição da curva de retenção por PTF é relativamente fraca, exceto para o teor de água residual. A inclusão do teor de matéria orgânica como preditor da PTF melhora a predição do parâmetro
α de van Genuchten. Não houve melhora de desempenho das PTFs específicas por classe de solo, em comparação com uma PTF geral. Exceto no caso do teor de água do solo saturado, estimado pela distribuição granulométrica, modelos para a predição do teor de água em potenciais matriciais específicos são bons. Predições do teor de água em potenciais matriciais mais negativos do que -0,6 m, usando uma PTF contendo a distribuição granulométrica, são somente um pouco inferiores àquelas obtidas por PTFs, que incluem densidade do solo e teor de matéria orgânica.
Termos de indexação: curva de retenção de água no solo, solos tropicais.
INTRODUCTION
The use of simulation models in agricultural sciences has increased significantly over the last decades. However, one of the major bottlenecks hampering model application is the lack of input data. In the case of water and solute balance modelling, data of soil hydraulic properties is the most relevant information (van Diepen et al., 1991; Pachepsky & Rawls, 1999). The direct determination of hydraulic conductivity and water retention characteristics is time-consuming and depends on expensive laboratory equipment (Wösten & van Genuchten, 1988). Therefore, indirect methods have been developed, e.g., pedotransfer functions - PTFs (Minasny, 2000; Cornelis et al., 2001; Rawls & Pachepsky, 2002; Tomasella et al., 2003) that correlate easily available information such as grain size distribution and organic matter content (OM) with soil hydraulic properties. Vaz et al. (2005) validated the Arya & Paris (1981)
model based on 104 samples of representative soils in the South and Southeast of Brazil, and concluded that the estimates of the models of retention curves are satisfactory for those soils.
content at field capacity (-33 kPa) and permanent wilting point (-1500 kPa) for the State of Pernambuco, in the northeastern region of Brazil. Another important contribution to knowledge on tropical soils was made by van den Berg et al. (1997) who developed PTFs to estimate available water content between pressure heads of -1 and -150 m based on texture and density of Oxisols in 10 tropical countries.
Considering the importance of extending the use of hydrological and agronomic models to tropical regions, in this paper we developed and validated PTFs for the prediction of water retention characteristics from sand, silt, clay, organic matter content and bulk density data for soils from northeastern Brazil.
MATERIAL AND METHODS
Data
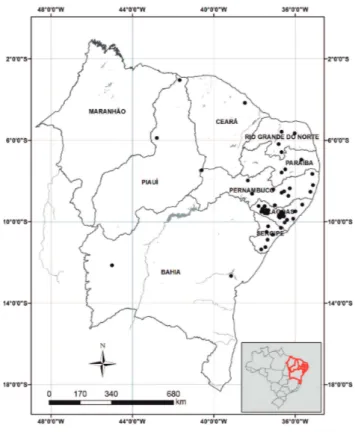
The sampling points were distributed on representative soils in northeastern Brazil, with higher concentrations in the States of Pernambuco and Alagoas (Figure 1).
A total of 786 datasets of soil water retention and grain size distribution, OM content and bulk density were selected from studies and reports from
universities, Embrapa (Brazilian Agricultural Research Corporation) and Codevasf (Corporation for the Development of the São Francisco and Parnaíba River Basins). Grain size was classified according to USDA Soil Taxonomy in clay (< 0.002 mm), loam (0.002 - 0.05 mm), fine sand (0.05 - 0.20 mm), and coarse sand (0.2 - 2 mm). Data were selected according to the similarity of determination methods. Specifically, only water retention data of undisturbed samples were used. To improve comparability, only water retention data corresponding to the pressure heads -0.6, -1, -3, -5, -10 and -150 m were used. The saturated water content θs was estimated from bulk
density (ρ) by:
(1)
where ρs is the particle density, assumed as 2700 kg m-3.
Estimation of van Genuchten model parameters
The van Genuchten (1980) model (VG, described in equation 2), was fitted to soil water retention data of each of the 786 locations:
(2)
where Se(h) is the effective saturation corresponding to pressure head h (m); θ, θr and θs are water content, residual water content and saturated water content (m3 m-3), respectively; α (m-1) and n are shape-fitting
parameters. Saturated water content θs was estimated by fitting equation 1, while θr was assumed to be equal to the observed water content at h = -150 m.
Regression model fitting
Two types of PTFs were fitted and evaluated. The first (PTF-4v) included four soil variables as candidate predictors: content of sand (S, kg kg-1), clay (C, kg
kg-1), organic matter (O, kg kg-1) and bulk density ρ
(kg m-3). The second (PTF-2v) used only two predictors,
sand and clay content:
PTF-4v yi = βi,0 + βi,1S + βi,2C + βi,3O + βi,4r + εi (3) PTF-2v yi = βi,0 + βi,1S + βi,2C + εi (4)
where yi corresponded to the respective van Genuchten model (Equation 2) parameters, here treated as PTF response variables: α = 10y1; n = y
2; θr = y3 and θs = y4; and βi,n represented the linear model coefficients (parameters): βi,0 the intercept, and βi,1, βi,2, βi,3 and
βi,4 the parameters referring to sand, clay and OM
content and bulk density, respectively. εi was the
random error associated to each observation. As proposed by Vereecken et al. (1989), the response variable log(α) was used instead of α directly, to reduce variability. The response variable y4 (corresponding to θs) was used only for PTF-2v, whereas for PTF-4v the θs value was calculated as a deterministic function of ρ (Equation 1).
PTFs were developed for all four soil types together, as well as specifically for each soil class. The fitting was performed using software Statistica 8 (StatSoft, 2007). Prior to the analysis, the dataset was divided into two subsets (subset random procedure in Statistica 8, step 1 in figure 2). Both data subsets were considered to be independent: Subset 1, containing 85 % of the data corresponding to 673 locations, was used for PTF development (Table 1). Subset 2, with 15 % of the data (113 locations), was used for model validation. PTFs per soil class were developed for Ultisols, Oxisols, Entisols, and Alfisols. Cambisols and Luvisols were also represented in the dataset, but the number of locations for these soil types was insufficient for specific PTF fitting.
After fitting of the van Genuchten (1980) model (Equation 2) to the observed data obtaining 673 (development) + 113 (validation) sets of data containing S, C, O and ρ and respective values of α, n, θr, and θs (step 2 in Figure 2), each PTF predictor and response variable (VG parameters) was checked for possible outliers using the graphical exploratory tools of Statistica 8 (StatSoft, 2007). As proposed by Tukey (1977), an observation is classified as outlier if it does not fall in the interval between the cut-offs FL - k(FU
- FL) and FU + k(FU - FL), where FL and FU are the lower and upper fourth quartiles of the sample and k is the outlier coefficient, customarily assumed as 1.5. Values of PTF predictors or response variables classified as outliers were excluded if consistency criteria related to soil physical properties were not satisfied.
Figure 2. Schematic representation of the methods used to perform external validation of pedotransfer functions.
Soil class Total Development Validation
Oxisols 343 298 45
Utilsols 179 159 20
Entisols 172 141 31
Alfisols 63 51 12
Cambisols 21 * *
Luvisols 8 * *
General 786 673 113
Table 1. Number of locations in the general dataset and grouped per soil class, used for PTF development (approx. 85 % of total) and validation (approx. 15 % of total)
Fitting of equations 3 and 4 parameters (PTF-4v and PTF-2v) for the prediction of each of the parameters
α, n and θr from equation 2 (step 3 in figure 2) was performed using the stepwise procedure at a significance level of 5 %. Parameters were estimated for the complete dataset as well as per soil class.
Goodness of fit (internal validation) and external validation of fitted PTFs
The agreement between VG parameters estimated by PTFs (step 4 in figure 2) and original VG parameters (step 5 in figure 2) was quantified using the validation subset (step 6 in figure 2). The following summary measures were adopted: the mean absolute error (MAE) correlation coefficient (r) and the index of agreement d (Willmott, 1982), given by the following expressions:
(5)
(6)
(7)
where Ei is the VG parameter estimated by PTF for location i from the validation subset and M is the respective value obtained from the original VG model fitting. E and M are the respective means. The PTF performance of estimating water content at specific pressure heads (0, -0.6, -1, -3 and -150 m) was also evaluated (Figure 3). At each pressure head, the original VG model performance was compared by its RMSE (RMSE Fit x Obs) to the performance of the VG model arising from the PTF estimation (RMSE PTF x Obs), calculating the RMSE by:
(8)
RESULTS AND DISCUSSION
Model evaluation
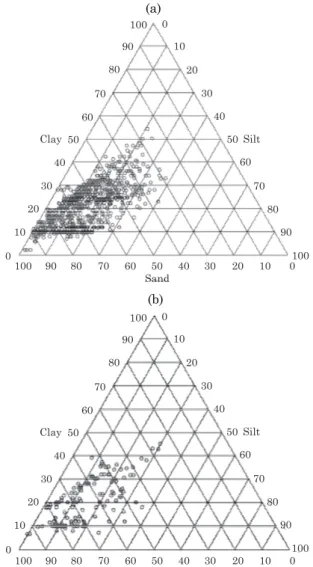
In most soils used for PTF construction in this study the sand content was high, a common trait in the Northeast of Brazil, as can be seen in the texture triangles (Figure 4). Texture classes were predominantly loam, loamy sand, sandy loam, sandy clay loam and sandy clay. Some clayey, sandy and clayey loam textures also occurred.
More statistical information on grain size distribution, organic matter content and bulk densities for the two subsets can be found in table 2. The subsets used for PTF development and validation were very similar, with comparable means and standard deviations. Clay, silt and sand mean contents were close to 0.21, 0.15 and 0.64 kg kg-1, respectively. Average bulk density was almost
1700 kg m-3. Organic matter contents were low
Figure 4. Textural properties of soil samples used for PTF development (a) and validation (b).
(0.006 kg kg-1 on average), a common feature for
soils with a low clay content from this semi-arid region. Silt contents are also very low, much lower than those observed in most soils from temperate climates. Tomasella et al. (2000) evaluated PTFs for soils from several Brazilian regions and reported silt contents between 0.15 and 0.20 kg kg-1, rarely
higher than 0.50 kg kg-1. These low silt contents
are considered one of the reasons that PTFs developed in temperate climates are inefficient when applied to tropical soils.
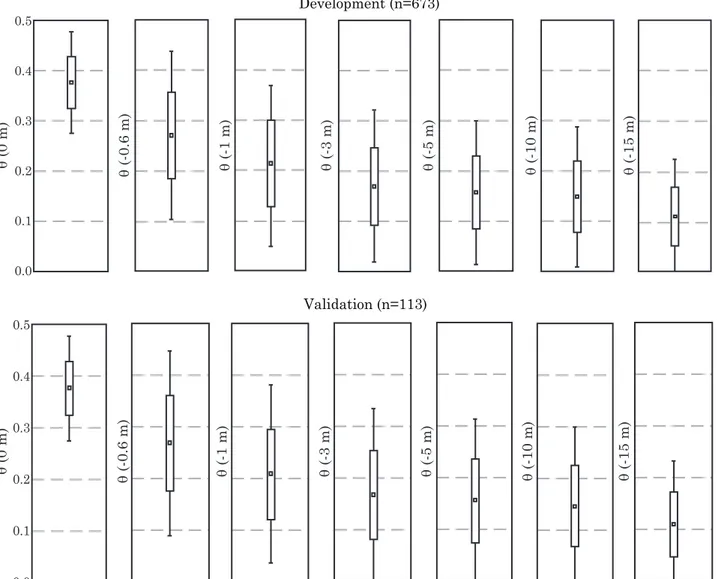
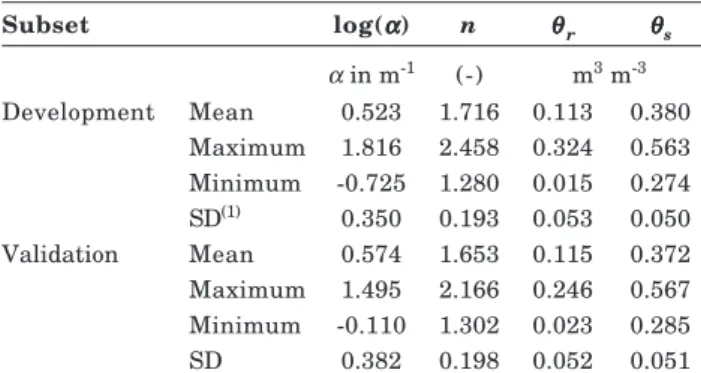
Figure 5 shows box-plots for both subsets of the observed (measured) water contents at pressure heads of 0, -0.6, -1, -3, -5, -10 and -150 m, used to establish the van Genuchten (1980) parameters (Equation 2). Mean and standard deviation were very similar in both subsets. Results of statistical analysis of estimates of the VG model parameters (Equation 2) are presented in table 3.
F i t t e d P T F s : p r e d i c t i v e c a p a c i t y f o r retention curve parameters
Parameter estimates for PTF-4v (Equation 3) and PTF-2v (Equation 4) are listed in tables 4 and 5 obtained with the complete dataset (General PTF) and for each of the soil classes Ultisols, Oxisols, Entisols, and Alfisols separately (specific PTFs).
Table 6 shows the performance indices for PTF-4v and PTF-2v. For the General PTF-4v, performance is worst for parameter n (i=2) and best for θr. The prediction of log(α) was much better with the General PTF-4v than with PTF-2v, as shown by all indicators of predictive capacity. Predictions of n and θr differ only slightly between PTF-4v and PTF-2v, which means that there was almost no correlation between these parameters and OM content or bulk density. There was no clear advantage in using the soil-specific instead of the General PTFs, in agreement with findings by Pachepsky & Rawls (1999) and Hodnett & Tomasella (2002).
In the case of PTF-2v, the predictive capacity for
θs was poor. A possible explanation is the low OM content of these tropical soils, not correlated clearly to soil structure, texture or water retention properties. Difficulties in finding adequate PTFs for
estimating parameters α and n have been reported
by several other authors (Scheinost et al., 1997; Wösten et al., 2001; Pachepsky & Rawls, 2004) and should be interpreted regarding the fact that these fitting parameters are not real soil properties and their values are very sensitive to the fitting method and criteria (Wösten & van Genuchten, 1988).
Fitted PTFs: predictive capacity for water contents at specific pressure heads
The agreement between water content at specific pressure heads predicted by PTF-derived VG models
(VGPTF models) and measured water content was
Subset OM Sand Silt Clay BD
kg kg-1 kg m-3
Development Mean 0.006 0.634 0.149 0.216 1686
Maximum 0.027 0.945 0.406 0.542 1980
Minimum 0.000 0.249 0.002 0.060 800
SD 0.004 0.139 0.079 0.091 138
Validation Mean 0.006 0.648 0.145 0.209 1682
Maximum 0.023 0.910 0.382 0.471 1900
Minimum 0.001 0.288 0.016 0.050 1170
SD 0.004 0.148 0.083 0.080 136
Table 2. Descriptive statistics (mean, maximum, minimum and standard deviation - SD) for organic matter (OM), sand, silt, clay contents and bulk density (BD), for the PTF development (N = 673) and validation subsets (N = 113)
7). In this table, these RMSEs are shown together with the RMSE from the original fitted VG models. While the original and the VGPTF-4v models show, by
construction, no error for estimating water content at h = 0 corresponding to θs (θs was assumed to be
equal to the value for h = 0 calculated from bulk density), for VGPTF-2v predictions, the error was
highest at saturation. From 0.6 to 150 m, RMSE
values decreased for both VGPTF models, and were
generally around two to three times higher than those from the original curves. The range of the RMSE for VGPTF-4v was 0.02 - 0.046 m3 m-3 and 0.029 - 0.051 m3 m-3 for VG
PTF-2v, similar to the range found by
Tomasella (2000) for tropical soils. Tomassela & Hodnett (1998) reported a range of 0.04 - 0.06 m3 m-3
when using texture information alone. Reference values for errors in water content estimation for several parts of the world were reported by Pachepsky & Rawls, (2004) and Wösten et al. (2001), showing errors between 0.02 and 0.11 m3 m-3.
Correlations between observed water contents and predicted water content by the VG models fitted to the original data and by the retention curves estimated by PTF-4v or PTF-2v are graphically represented in figure 6 (external validation) and figure 7 (internal
Subset log(ααααα) n θθθθθr θθθθθs
α in m-1 (-) m3 m-3
Development Mean 0.523 1.716 0.113 0.380 Maximum 1.816 2.458 0.324 0.563 Minimum -0.725 1.280 0.015 0.274 SD(1) 0.350 0.193 0.053 0.050
Validation Mean 0.574 1.653 0.115 0.372 Maximum 1.495 2.166 0.246 0.567 Minimum -0.110 1.302 0.023 0.285
SD 0.382 0.198 0.052 0.051
Table 3. Descriptive statistics for estimates of equation 2 parameters a, n, qr and qs of the fitted
original van Genuchten model for the PTF development (N = 673) and validation subsets (N = 113)
SD: standard deviation.
Regression model parameter Refers to van Genuchten parameter (PTF response variable)
I = 1 I = 2 I = 3
log(ααααα), m-1 (n) (θθθθθr)
General PTF βi,0 intercept 2.8118 1.5662 0.0858
βi,1 sand content 0.8861 0.3292 -0.1671
βi,2 clay content -1.1907 -0.4135 0.3516
βi,3 OM content 0 -5.5341 1.1846
βi,4 bulk density -0.0015140 0 0.0000290
Soil-specific PTF
Ultisols βi,0 intercept 3.0739 1.2928 0.0644
βi,1 sand content 1.1474 0.6770 -0.1632
βi,2 clay content -0.8766 0 0.3283
βi,3 OM content 0 -10.6304 0
βi,4 bulk density -0.0017960 0 0.000046497
Oxisols βi,0 intercept 2.6691 2.6394 0.0783
βi,1 sand content 1.8309 -0.6655 -0.1892
βi,2 clay content 0 -2.0951 0.2716
βi,3 OM content 16.14177 -9.21339 1.164808
βi,4 bulk density -0.0020035 0 0.000053056
Entisols βi,0 intercept 4.6653 0.4604 0.0283
βi,1 sand content -1.6290 1.4886 -0.1020
βi,2 clay content -5.4629 1.4886 0.5265
βi,3 OM content -14.3409 0 1.247318
βi,4 bulk density -0.0011875 0 0.000020888
Alfisols βi,0 intercept 0.9107 1.8741 0.1768
βi,1 sand content 2.0321 0 -0.2276
βi,2 clay content 0 -1.0329 0.4761
βi,3 OM content 0 0 0
βi,4 bulk density -0.00107199 0 0
Table 4. Estimates of linear multiple regression parameters for general PTF-4v as well as for soil-class-specific PTF-4v, obtained from the development subset (N = 673)
vG parameter
PTF-4v PTF-2v
r d(1) r d r d r d
internal external internal external
General
log α (i=1) 0.66 0.77 0.69 0.78 0.40 0.71 0.37 0.45
n (i=2) 0.40 0.52 0.49 0.55 0.38 0.50 0.47 0.52
θr (i=3) 0.94 0.97 0.89 0.94 0.93 0.96 0.89 0.94
θs (i=4) - - - - 0.47 0.59 0.39 0.54
Ultisols
log α (i=1) 0.71 0.80 0.55 0.72 0.34 0.46 0.32 0.46
n (i=2) 0.46 0.53 0.61 0.62 0.41 0.52 0.61 0.62
θr (i=3) 0.95 0.97 0.96 0.98 0.94 0.97 0.96 0.97
θs (i=4) - - - - 0.45 0.59 0.69 0.71
Oxisols
log α (i=1) 0.74 0.84 0.83 0.87 0.41 0.54 0.49 0.47
n (i=2) 0.42 0.55 0.46 0.53 0.41 0.53 0.46 0.53
θr (i=3) 0.94 0.97 0.95 0.97 0.94 0.97 0.94 0.97
θs (i=4) - - - 0.56 0.68 0.32 0.53
Entisols
log α (i=1) 0.60 0.72 0.57 0.65 0.32 0.42 0.30 0.26
n (i=2) 0.55 0.67 0.66 0.71 0.55 0.67 0.66 0.71
θr (i=3) 0.82 0.96 0.86 0.93 0.80 0.95 0.79 0.88
θs (i=4) - - - 0.32 0.38 0.32 0.37
Alfisols
log α (i=1) 0.66 0.78 0.58 0.61 0.50 0.62 0.54 0.52
n (i=2) 0.36 0.51 0.31 0.49 0.36 0.51 0.31 0.49
θr (i=3) 0.90 0.95 0.83 0.86 0.90 0.93 0.83 0.86
θs (i=4) - - - - 0.62 0.74 0.84 0.70
Table 6. Statistical performance (correlation coefficient, r and index of agreement, d for general PTFs as well as for soil-class-specific PTFs for each VG parameter (internal validation: development subset, N = 673; external validation: validation subset, N = 113)
(1) Willmott (1982).
Regression model parameter van Genuchten parameter (PTF response variable)
i = 1 i = 2 i = 3 i = 4
log(ααααα), m-1 (n) (θθθθθr) (θθθθθs)
General PTF βi,0 (intercept) 0.9267 1.5299 0.1286 0.5526
βi,1 (sand content)(1) 0 0.3265 -0.1484 -0.2320
βi,2 (clay content) -1.5958 -0.3957 0.3571 -0.1178
Soil-specific PTF
Ultisols βi,0 (intercept) 0.0344 1.3047 0.1419 0.3106
βi,1 (sand content) 0.8187 0.5528 -0.1537 0
βi,2 (clay content) 0 0 0.3078 0.2723
Oxisols βi,0 (intercept) -0.1451 2.6262 0.1594 0.4804
βi,1 (sand content) 1.0508 -0.7463 -0.1584 -0.1748
βi,2 (clay content) 0 -2.0688 0.2594 0
Entisols βi,0 (intercept) 2.4415 0.4604 0.0747 0.3305
βi,1 (sand content) -1.5168 1.4886 -0.1137 0
βi,2 (clay content) -4.6631 1.4886 0.5552 0.4592
Alfisols βi,0 (intercept) -0.3196 1.8741 0.1768 0.5750
βi,1 (sand content) 1.2254 0 -0.2276 -0.2790
βi,2 (clay content) 0 -1.0329 0.4761 0
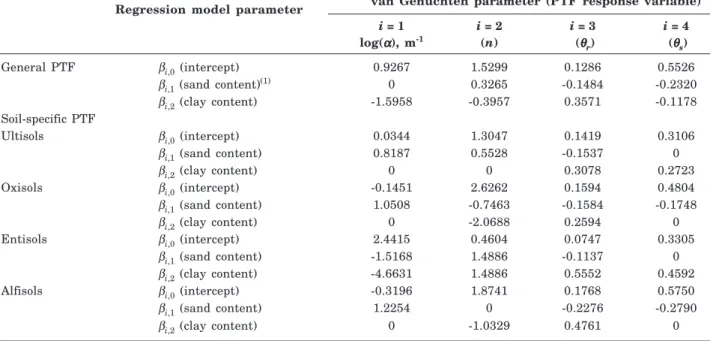
Table 5. Estimates of linear multiple regression parameters for general PTF-2v as well as for soil-class-specific PTF-2v, obtained from the development-subset (N = 673)
Table 7. Root mean square error (RMSE) of different prediction approaches for water content at specific pressure head values: original van Genuchten (VG) models and VG models derived from parameters estimated by PTFs (VGPTF-4v and VGPTF-2v, N = 673)
Pressure head RMSE - Original VG RMSE - VGPTF-4v RMSE - VGPTF-2v
m m3 m-3
0 0 0 0.051
-0.6 0.014 0.046 0.050
-1 0.017 0.031 0.038
-3 0.009 0.027 0.034
-150 0.008 0.020 0.029
Mean RMSE 0.012 0.031 0.040
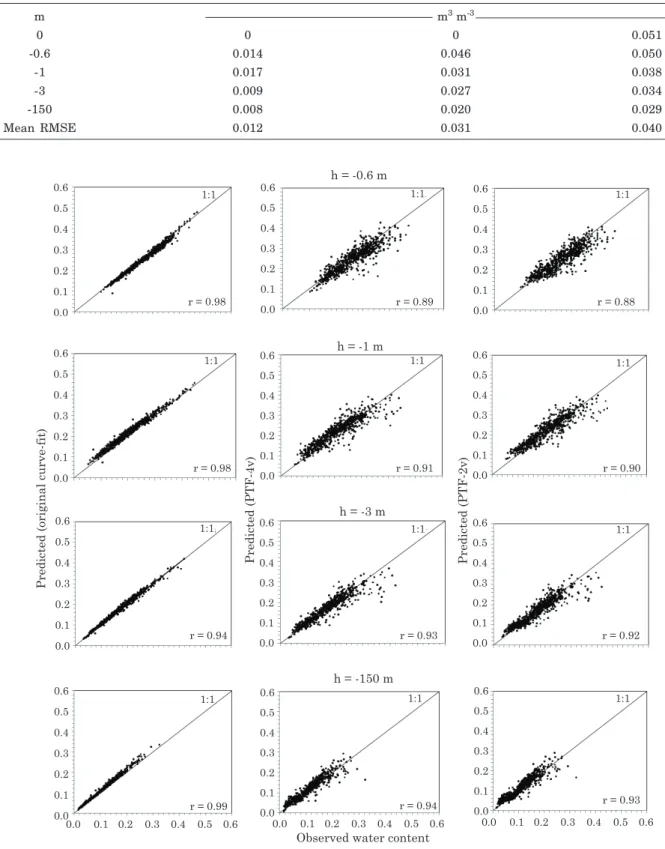
Figure 6. Observed water contents (m3 m-3) at four specific pressure heads versus respective water contents
Figure 7. Observed water contents (m3 m-3) at five specific pressure heads versus respective water contents
validation). Similarly to table 7, the correspondence between PTF predictions and observed values was reasonably good, except for θs estimated by VGPTF-2v. Based on model quality summary measures (Table 6), it was observed that the predictive capacity for water contents at specific pressure heads (r-values
from figures 6 and 7), with the exception of θs
estimated by PTF-2v, was much better than VG parameter prediction. This is important for the interpretation of the overall results of PTF development: although the predictive capacity for fitting parameters may seem low, water contents calculated using these parameters agree fairly well with observed water contents, encouraging the use of PTF-derived water retention models for soil water prediction. Generally, PTFs for specific pressure heads (h) lead to better results than PTFs based on estimation of parameters of water retention curves (Pachepsky & Rawls, 2004). Tomasella et al. (2008) suggested that, even when fitting PTFs for retention parameters, the water content should be estimated for specific h and those estimates used to obtain water retention curves via interpolation methods to reduce uncertainty.
CONCLUSIONS
1. The PTF prediction of retention curve parameters is generally relatively poor, with best estimates for the residual water content.
2. Including organic matter content as a PTF predictor improves predictions of the van Genuchten a parameter.
3. The performance of soil-class-specific PTFs is not clearly better than that of the general PTF.
4. Except for the saturated water content estimated by grain size distribution alone, the model performance for water content prediction at specific pressure heads was good, with r values of 0.89 – 0.94, versus r of 0.94 – 1 for the original water retention model.
5. Predictions of water content for pressure heads more negative than -0.6 m using a PTF based on grain size distribution alone are only slightly inferior to those obtained by PTFs including bulk density and organic matter content.
LITERATURE CITED
ARYA, L.M. & PARIS, J.F. A physicoempirical model to predict the soil moisture characteristic from particle-size distribution and bulk density data. Soil Sci. Soc. Am. J., 45:1023-1030, 1981.
CORNELIS, W.M.; RONSYN, J.; MEIRVENNE, M.V. & HARTMANN, R. Evaluation of pedotransfer functions for predicting the soil moisture retention curve. Soil Sci. Soc. Am. J., 65:638-648, 2001.
HODNETT, M.G. & TOMASELLA, J. Marked differences between van Genuchten soil water-retention parameters for temperature and tropical soils: A new water-retention pedotransfer functions developed for tropical soils. Geoderma, 108:155-180, 2002.
MINASNY, B. Efficient methods for predicting soil hydraulic properties. Sydney, University of Sydney, New South Wales, 2000. 396p. (Tese de Doutorado)
OLIVEIRA, L.B.; RIBEIRO, M.R.; JACOMINE, P.K.T.; RODRIGUES, J.J.V. & MARQUES, F.A. Funções de pedotransferência para predição da umidade retida a potenciais específicos em solos do Estado de Pernambuco. R. Bras. Ci. Solo, 26:315-323, 2002.
PACHEPSKY, Y.A. & RAWLS, W.J. Accuracy and reliability of pedotransfer functions as affected by grouping soils. Soil Sci. Soc. Am. J., 63:1748-1756, 1999.
PACHEPSKY, Y.A. & RAWLS, W.J. Development of pedotransfer functions in soil hydrology. New York, Elsevier, 2004. (Developments in Soil Science, 30) RAWLS, W.J. & PACHEPSKY, Y.A. Using field topographic
descriptors to estimate soil water retention. Soil Sci., 167:423-435, 2002.
SCHEINOST, A.C.; SINOWSKI, W. & AUERSWALD, K. Regionalization of soil water retention curves in a highly variable soils cape, I. Developing a new pedotransfer function. Geoderma, 78:129-143, 1997.
SILVA, A.S.S.; BRITO, L.T.L.; OLIVEIRA, C.A.V. & MOITA, A.W. Parâmetros de solo em função da umidade na capacidade de campo em área irrigáveis do trópico semi-árido brasileiro. Pesq. Agropec. Bras., 25:103-116, 1990.
STATSOFT INC. Statistica (data analysis software system), version 8.0. Cary, 2007.
TOMASELLA, J. & HODNETT, M.G. Estimating soil water characteristics from limited data in Brazilian Amazonia. Soil Sci., 163:190-202, 1998.
TOMASELLA, J.; HODNETT, M.G. & ROSSATO, L. Pedotransfer functions for the estimation of soil water retention in Brazilian soils. Soil Sci. Soc. Am. J., 64:327-338, 2000.
TOMASELLA, J.; PACHEPSKY, Y.A.; CRESTANA, S. & RAWLS, W.J. Comparison of two approximation techniques to develop pedotransfer functions for Brazilian soil. Soil Sci. Soc. Am. J., 67:1085-1092, 2003.
TOMASELLA, J.; HODNETT, M.G.; CUARTAS, L.A.; NOBRE, A.D.; WATERLOO, M.J. & OLIVEIRA, S.M. The water balance of an Amazonian micro-catchment: The effect of interannual variability of rainfall on hydrological behavior. Hydrol. Proc., 22:2133-2147, 2008.
van den BERG, M.; KLAMT, E.; van REEUWIJK, L.P. & SOMBROEK, W.G. Pedotransfer functions for the estimation of moisture retention characteristics of Ferralsols and related soils. Geoderma, 78:161-180, 1997. van DIEPEN, C.; van KEULEN.; WOLK, J. & BERKHOUT, J. Land evaluation: From intuition to quantification. Adv. Soil Sci., 15:139-204, 1991.
van GENUCHTEN, M.T. A closed-form equation for predicting the hydraulic conductivity of unsatured soils. Soil Sci. Soc. Am. J., 44:892-898, 1980.
VAZ, C.M.P.; IOSSI, M.F.; NAIME, J.M.; MACEDO, A.; REICHERT, J.M.; REINERT, D.J. & COOPER, M. Validation of the Arya and Paris water retention model for Brazilian soils. Soil Sci. Soc. Am. J., 69:577-583, 2005.
VEREECKEN, H.; MAES, J.; FEYEN, J. & DARIUS, P. Estimating the soil moisture retention characteristics from texture, bulk density, and carbon content. Soil Sci., 148:389-403, 1989.
WILLMOTT, C.J. Some comments on the evaluation of model performance. B. Am. Meteorol. Soc., 63:1309-1313, 1982.
WÖSTEN, J.H.M.; PACHEPSKY, Y.A. & RAWLS, W.J. Pedotransfer functions: bridging the gap between available basic soil data and missing soil hydraulic characteristics. J. Hydrol., 251:123-150, 2001.