E C O L O G Y Copyright © 2017 The Authors, some rights reserved; exclusive licensee American Association for the Advancement of Science. No claim to original U.S. Government Works. Distributed under a Creative Commons Attribution NonCommercial License 4.0 (CC BY-NC).
Networks of global bird invasion altered by
regional trade ban
Luís Reino,1,2,3Rui Figueira,1,3,4Pedro Beja,1,3 Miguel B. Araújo,2,5,6 César Capinha,1,7* Diederik Strubbe6,8,9†
Wildlife trade is a major pathway for introduction of invasive species worldwide. However, how exactly wildlife trade influences invasion risk, beyond the transportation of individuals to novel areas, remains unknown. We analyze the global trade network of wild-caught birds from 1995 to 2011 as reported by CITES (Convention on International Trade in Endangered Species of Wild Fauna and Flora). We found that before the European Union ban on imports of wild-caught birds, declared in 2005, invasion risk was closely associated with numbers of imported birds, diversity of import sources, and degree of network centrality of importer countries. After the ban, fluxes of global bird trade declined sharply. However, new trade routes emerged, primarily toward the Nearctic, Afrotropical, and Indo-Malay regions. Although regional bans can curtail invasion risk globally, to be fully effective and prevent rerouting of trade flows, bans should be global.
INTRODUCTION
Global wildlife trade has attracted public attention in recent years
be-cause it is a major driver of species extinctions around the world (1, 2),
and because it helps promote the spread of invasive species (3) and of
diseases to both humans and other animals (4). Outright bans on wildlife trade of both threatened and potentially damaging species have been proposed as a strategy to reduce its negative effects (5). This strategy can have major social and economic costs, so its effectiveness needs to be thoroughly evaluated. Arguably, the most prominent application of trade bans was enacted by the European Union (EU), which placed a temporary ban on wild bird imports in October 2005
to prevent the spread of avian influenza (6). The ban was made
perma-nent in July 2007 and comprised all wild bird imports regardless of spe-cies’ conservation status (7). Although supported by a coalition of
conservation and animal welfare organizations (8), the decision was
cri-ticized on the grounds that blanket trade bans would risk stimulating
illegal activities (9) and, when imposed by northern on southern
con-stituencies, run counter to values of equity and sustainable development
(10). Also, rather than reducing market demands, trade bans could lead
to the opening of alternative markets and trade routes, thus contributing to spread of invasive species into areas otherwise disconnected from major trade networks. The effectiveness of trade bans as a generic
con-servation approach has been actively debated (11); although it is known
that gross metrics of international trade generally correlate with the
global distribution of invasive alien species (12–14), exactly how trade
networks influence the success of biological invasions remains un-known (15). However, this knowledge is key to effectively manage trade networks in relation to their potential effects on global patterns of inva-sive species establishment.
We assess how the topology of the global bird trade network relates to the establishment of imported non-native bird species. We also in-vestigate how the unilateral EU import ban on wild-caught birds has changed the species traded, their traded volumes, and the network of trading relationships and balance among countries. To do so, we com-bine a large data set on wild bird trade among biogeographical realms derived from CITES (Convention on International Trade in Endangered Species of Wild Fauna and Flora) with the analysis of trade network topology. Our focus on birds and the EU import ban is especially rele-vant because the EU has been, historically, the main importer of wild
birds worldwide (16). Moreover, birds are among the most
internation-ally traded animal taxa (17), and highly traded avian orders such as
the Psittaciformes represent both the most threatened (18) and most
invasive (19) bird group. Results of our analysis have broader im-plications to understand the links between trade networks and bio-logical invasions, and thus to devise trade policies reducing invasion risks.
RESULTS
Avian invasion success is related to global fluxes of wild-caught birds, and as expected, countries that import more birds are more prone to being invaded by birds (Table 1). In addition, a number of intrinsic properties of the trade network topology also relate to invasion prob-ability. Regardless of levels of bird importation, countries that have a
more diversified number of importation sources (that is, high“indegree”
centrality) are more likely to be invaded. The same is true for subgroups of countries that form a dense interconnection of trading relationships
among themselves (that is, having a high“clustering coefficient”). Last,
invasion risks are higher for countries that have a more central position
in the whole trade network (that is, that have higher values for
“close-ness centrality”; see Table 1). Before the EU ban (1995–2005), trade in 1CIBIO/InBIO-Centro de Investigação em Biodiversidade e Recursos Genéticos,
Universidade do Porto, Campus Agrário de Vairão, Rua Padre Armando Quintas, n°9, 4485-661 Vairão, Portugal.2CIBIO/InBIO-Centro de Investigação em Biodiver-sidade e Recursos Genéticos, UniverBiodiver-sidade de Évora, 7004-516 Évora, Portugal.
3CEABN/InBIO-Centro de Estudos Ambientais‘Prof. Baeta Neves’, Instituto Superior
de Agronomia, Universidade de Lisboa, Tapada da Ajuda, 1349-017 Lisboa, Portugal.
4LEAF-Linking Landscape, Environment, Agriculture and Food, Instituto Superior de
Agronomia, Universidade de Lisboa, Tapada da Ajuda, 1349-017 Lisboa, Portugal.
5
Museo Nacional de Ciencias Naturales, CSIC, Calle José Gutiérrez Abascal, 2, 28006 Madrid, Spain.6Center for Macroecology, Evolution and Climate, Natural History Museum of Denmark, University of Copenhagen, Universitetsparken 15, 2100 Copenhagen, Denmark.7Zoologisches Forschungsmuseum Alexander Koenig,
Museumsmeile Bonn, Adenauerallee 160, 53113 Bonn, Germany.8Terrestrial Ecology Unit, Ghent University, K.L. Ledeganckstraat 32, 9000 Ghent, Belgium.9Evolutionary
Ecology Group, University of Antwerp, Campus Drie Eiken, Universiteitsplein 1, 2610 Wilrijk, Belgium.
*Present address: Global Health and Tropical Medicine, Instituto de Higiene e Medicina Tropical, Universidade Nova de Lisboa, Rua da Junqueira 100, 1349-008 Lisboa, Portugal.
†Corresponding author. Email: diederik.strubbe@snm.ku.dk
on March 5, 2018
http://advances.sciencemag.org/
CITES-listed wild birds between biogeographical realms totalized ca. 1.3 million individuals annually.
The EU ban reduced trade volumes to about 10% of their former levels while strongly redistributing the remaining trade flows across the globe (Figs. 1 and 2 and table S1). Before the ban, trade volume was the dominant invasion risk parameter for 59% of countries globally, followed by closeness centrality (27%), clustering coefficient (8%), and indegree (5%). Network parameters were especially influential across
Europe, North America, and parts of Latin America and Asia (fig. S1). The EU bird trade ban reduced the importance of trade volume globally (dominant in 47% of countries) and increased the contribution of network parameters for explaining invasion success [closeness centrality (27%), clustering coefficient (19%), indegree (6%); fig. S2]. In the period
1995–2005, European and North American countries were most central
to the global trade network. After the ban, the United States remained among the most densely connected trading countries, whereas EU
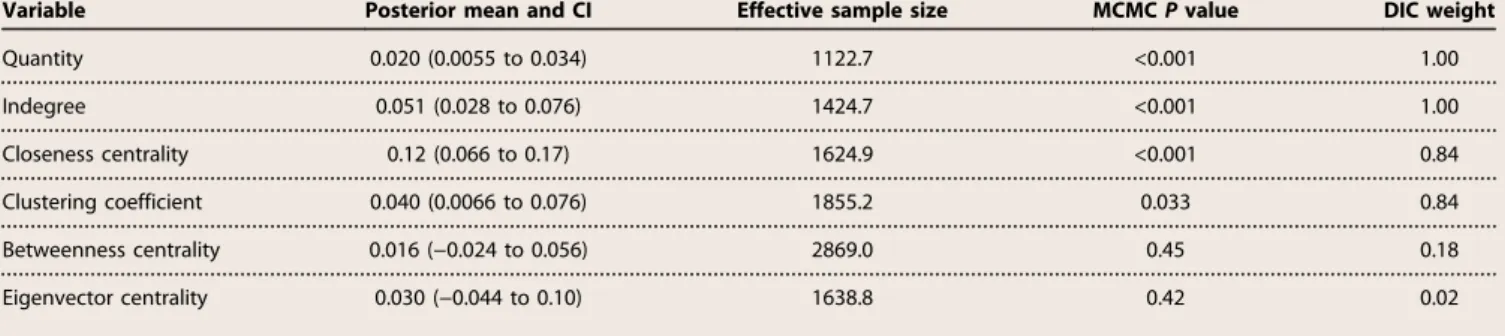
Table 1. Relationships between trade network topology and avian invasion. The variable quantity refers to the total number of individual of the species that were imported. Indegree describes the number of countries from which a country imports birds. Closeness centrality indicates how close a country is to all other countries in the trade network. The eigenvector centrality measures the influence of a country in the trade network, whereas betweenness centrality measures the role of countries as“pass-through” centers. The clustering coefficient quantifies the extent to which a country is integrated into a subgroup of countries that have a highly interconnected trade network among themselves. Avian invasion success was best explained by the quantity of birds traded and by having more closely connected trade networks [that is, high values for indegree centrality, closeness centrality, and the clustering coefficient; model deviance information criteria (DIC) weight, 0.82;DDIC with the second-best model > 3]. Quantity and indegree centrality were also included in the second-best model, as was betweenness centrality, but this model was only weakly supported (DIC weight, 0.16). All other models had virtually no support (all DIC weights≤ 0.021). Variable DIC weights and posterior means and confidence intervals (CIs) support the relevance of the four variables included in the best-ranked model (all DIC weights≥ 0.82, 95% CI excluding 0). Heidelberger convergence diagnostics indicate that models reached stationarity.
Variable Posterior mean and CI Effective sample size MCMC P value DIC weight
Quantity 0.020 (0.0055 to 0.034) 1122.7 <0.001 1.00 Indegree 0.051 (0.028 to 0.076) 1424.7 <0.001 1.00 Closeness centrality 0.12 (0.066 to 0.17) 1624.9 <0.001 0.84 Clustering coefficient 0.040 (0.0066 to 0.076) 1855.2 0.033 0.84 Betweenness centrality 0.016 (−0.024 to 0.056) 2869.0 0.45 0.18 Eigenvector centrality 0.030 (−0.044 to 0.10) 1638.8 0.42 0.02
Fig. 1. Global wild bird trade fluxes. Flows of wild bird trade among different biogeographical regions, before (A) and after (B) the EU ban.
on March 5, 2018
http://advances.sciencemag.org/
member states were replaced by predominantly Asian nations and South Africa (table S2). Overall, network parameter values were reduced to 18 to 21% of their former levels (fig. S3), and this reduction was es-pecially strong across the western Palearctic (table S3). Corresponding-ly, overall avian invasion risks have decreased strongly across much of the globe, and especially so in (western) Europe, where invasion risks were the highest before the ban. Minor to moderate increases in inva-sion risk attributable to rerouted trade flows are apparent especially in the Nearctic and, to a lesser extent, in parts of the Indo-Malay and Afro-tropical regions (Fig. 3 and figs. S4 and S5). Almost 90% of pre-ban trade fluxes corresponded to imports into the western Palearctic, mainly coming from the Afrotropical region, with secondary fluxes from the Neotropical and Indo-Malayan regions (Fig. 1 and Tables 2 and 3).
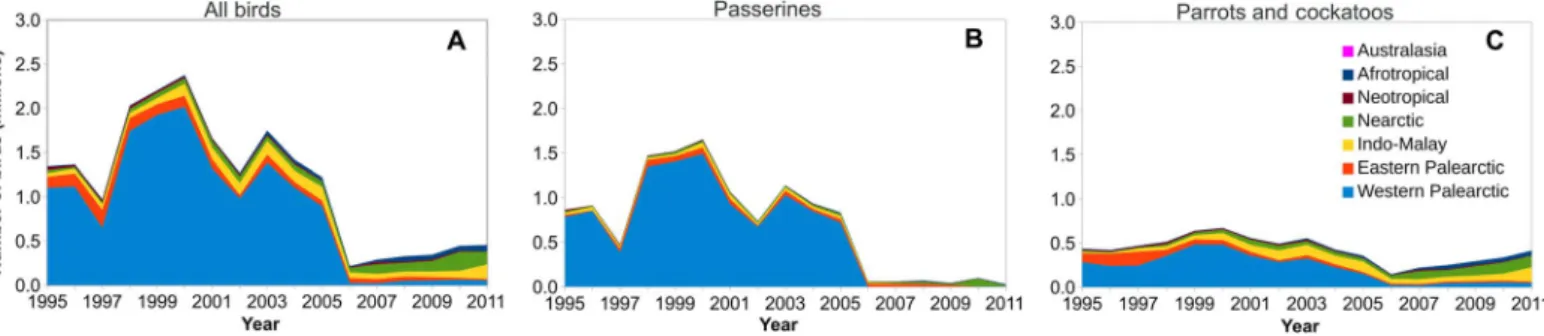
Before the ban, a small set of countries was responsible for a large share of global wild bird trade because, overall, about 66% of global bird imports were made by only five EU countries (Belgium, Italy, Netherlands, Portugal, and Spain), whereas three West African countries (Guinea, Mali, and Senegal) were responsible for more than 70% of bird exports (table S1). Most birds traded were passerines (almost 80%), of which
about 75% belonged to 12 Afrotropical species, with the main trade fluxes concentrated from West Africa to western Europe (fig. S6 and tables S4 and S5). Parrots and allies (Psittaciformes) were the second most traded group (17.5% of trade). As for passerines, main trade fluxes were toward western Europe, but they came from a more varied range of source countries across South and Central America, South Africa, and Southeast Asia (fig. S7 and tables S4 and S5).
After the EU ban, exports toward the western Palearctic and exports from the Afrotropical region were reduced to a mere 1.25% (Table 2) and 4.34% (Table 3) of their pre-ban level, respectively. The Neotropical region gained importance as a main source of wild birds, generating over 50% of global wild bird exports (Table 3). The role of the EU as the predominant bird importer shifted toward other regions, principally to the Nearctic, and especially to Mexico and the United States, where imports increased from over 23,000 to more than 82,000 birds annually (Figs. 1 and 2, Table 2, and table S1). The Indo-Malay and Afrotropical regions also gained (relative) importance in the global trade network, because bird imports into countries such as Singapore and South Africa declined less strongly than in the western Palearctic (59% and 17% of
Fig. 2. Annual number of birds exported to different biogeographical realms (1995–2011). Total annual numbers of imported birds (A), passerines (B), and parrots and cockatoos (C). Color codes correspond to the different biogeographical regions depicted in Fig. 1 (light blue, western Palearctic; red, eastern Palearctic; yellow, Indo-Malay; green, Nearctic; brown, Neotropical; dark blue, Afrotropical; pink, Australasia).
Fig. 3. Trade ban–driven changes in avian invasion risk. Predicted changes in wild bird trade–driven invasion risk caused by the EU wild bird import ban. Country-level invasion risk estimates were obtained by summing model invasion probabilities for all bird species exported to a given country in the pre-ban (1995–2005) versus post-ban (2006–2011) period. Green and orange hues indicate decreases and increases in invasion risk, respectively; color gradients are on the same scales; and maps have been drawn using equally spaced intervals. Invasion risks have most strongly declined across (western) Europe, whereas more moderate increases can be ob-served across parts of the Nearctic and Indo-Malay regions.
on March 5, 2018
http://advances.sciencemag.org/
pre-ban volumes, respectively; table S1). The taxonomic composition of the trade also changed, because passerine birds are no longer the
dom-inant traded taxon (annual trade volumes in the period 2006–2011
amounted to only 2.40% of the pre-ban volume; tables S4 and S5). Parrot trade declined as well (on average about 45% of its pre-ban volumes; tables S4 and S5), although trade volumes had recovered to almost 60% of their pre-ban levels by 2011 (Fig. 2). Consequently, parrots are now the most traded group (accounting for 78% of global annual trade), followed by Passeriformes (at 19%).
DISCUSSION
We show how detailed characterization of trade networks can reveal the strong connection between global trade pressure and success in biological invasions. The drastic drop in the global number of birds (le-gally) traded following the 2005 EU ban on bird trade underscores the importance of internationally coordinated policies in conservation. The
number of birds traded is one of the most important factors in determining avian invasion risk, and the EU bird trade ban has effectively reduced global bird invasion risks. However, alternative trade routes have opened since then, leading to potential increases in invasion risks in countries that otherwise had remained relatively less affected by bird invasions. Remaining trade flows have also been redirected toward developing countries, mainly around the tropical belt where biodiversity
is high but resources to manage invasive species are limited (20).
Global changes in trade volumes, however, cannot alone predict the magnitude, sometimes even the direction, of regional changes in invasion risk. Network centrality measures are also needed to reliably predict in-vasion risk. For example, in the Nearctic, exports to both Mexico and the United States increased and yet invasion risk declined in the former but increased in the latter (Fig. 3). This asymmetry seems to be a con-sequence of the United States holding on to its central position in the global trade network (indegree was largely stable, and closeness central-ity and clustering coefficient increased; table S2 and figs. S1 and S2). In
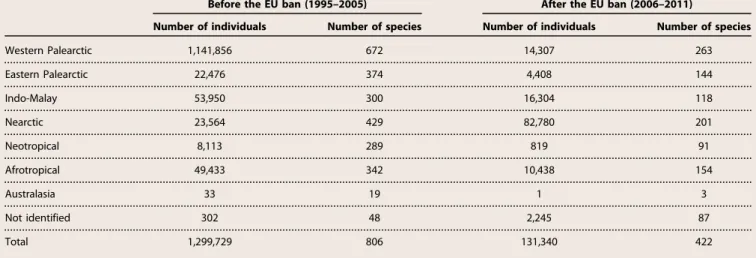
Table 2. Annual number of birds exported to different biogeographical realms before and after the 2005 EU ban.
Before the EU ban (1995–2005) After the EU ban (2006–2011)
Number of individuals Number of species Number of individuals Number of species
Western Palearctic 1,141,856 672 14,307 263 Eastern Palearctic 22,476 374 4,408 144 Indo-Malay 53,950 300 16,304 118 Nearctic 23,564 429 82,780 201 Neotropical 8,113 289 819 91 Afrotropical 49,433 342 10,438 154 Australasia 33 19 1 3 Not identified 302 48 2,245 87 Total 1,299,729 806 131,340 422
Table 3. Annual number of birds exported from different biogeographical realms before and after the 2005 EU ban.
Before the EU ban (1995–2005) After the EU ban (2006–2011)
Number of individuals Number of species Number of individuals Number of species
Afrotropical 1,057,819 358 45,937 224 Western Palearctic 82,052 453 2,853 153 Neotropical 52,531 248 69,206 114 Indo-Malay 45,805 252 3,127 90 Eastern Palearctic 38,099 155 841 64 Nearctic 20,979 267 8,457 129 Australasia 2,187 40 810 13 Not identified 254 147 102 44 Total 1,299,729 806 131,340 422 on March 5, 2018 http://advances.sciencemag.org/ Downloaded from
contrast, Mexico’s influx of bird trade is largely driven by a strong
in-crease in imports of monk parakeet (Myiopsitta monachus), resulting in
increased invasion rates for this single species only (21). Whereas before the EU ban, 47 countries exported 189 different bird species to Mexico, after the ban, trade was limited to 13 countries exporting only 55 species, and the country became more marginal to global trade network (network centrality measures fell to 14 to 69% of their former levels; table S2 and figs. S1 and S2). This interplay between trade volumes and network centrality generates complex, regional dynamics in invasion risk, necessitating the use of network models to obtain more realistic predictions of how trade politics affect pathways and success of biological invasions. East Asia is a region with a prominent culture of bird keeping and
strong economic development (22, 23), and as wild bird trade in the
region has declined to a lesser extent than globally, it has gained a more prominent role in the global bird trade network. However, whereas our results lead to predicting a decline in trade-driven invasion risk in parts of East Asia, recent studies suggest that the rate of avian invasions in the
region is increasing (24, 25). This apparent discrepancy might be a
sequence of potential biases arising from the fact that here, we only con-sider trade in wild-caught birds among biogeographical realms. Much of the bird trade in East Asia involves either wild-caught birds that are native
to the Indo-Malay region or birds that have been bred in captivity (26, 27).
It should be noted that whereas captive breeding is common
across Indonesia (28), evidence strongly suggests that, for example,
in Singapore—the main regional bird trade hub—many of the birds reported to CITES as captive-bred are in reality taken from the wild
(29, 30). Illegal wild bird trade likely is vast, but its trade routes and
volumes are difficult to quantify (31) and it remains unclear to what extent illegal trade contributes to invasions globally. A recent review on illegal parrot trade concluded that poached parrots are much more likely to be sold on local markets within the biogeographical area of capture than to be exported internationally (32). If this correlation holds true for other bird taxa and biogeographical regions, this observation suggests that birds invading localities within their biogeographical region of origin should also be considered to detect signals of illegal
wildlife trade–driven avian invasion risks.
For many taxa, current rates of invasion may reflect historical, rather
than contemporary, human activities [termed“invasion debts”; (33)].
However, taxonomic groups with good dispersal capacities, such as birds, are more strongly associated with recent socioeconomic drivers (33). Four of six invasion events we uncovered in the post-ban period refer to Portugal and Greece, where no legal wild bird imports took place in that period and thus likely reflect such an invasion debt. The low number of avian invasions attributable to post-ban wild bird trade confirms that birds react rapidly to changes in factors underlying inva-sion success, and demonstrates that trade bans are an effective means to halt avian invasions.
An additional source of uncertainty comes from an increase in the discrepancy between exporter- and importer-reported bird quantities after the implementation of the ban (fig. S8). For example, increased invasion risks in the United States partly depend on post-ban exports of African passerines reported by Senegal but never recorded as imports by the United States. These discrepancies are attributable to a range of
factors (34). For instance, exporters must obtain CITES documents
before the export, and because the process can take time, they may re-quest permits before the birds are actually available for export. Occa-sionally, documents may be issued for birds that are never exported
(35). When exporters report bird trade volumes larger than reported
by the importer, our models are likely to overestimate post-ban invasion
risks (fig. S8). Therefore, to better understand how shifting trade
patterns influence species’ introductions and invasion success, we
re-commend that implementations of graph theory can be used to inte-grate CITES trade data with actual international trade statistics (for example, see UN Comtrade, https://comtrade.un.org). Furthermore, fu-ture assessments should take into account the environmental suitability of the non-native area to which traded species are transported. These assessments could be achieved through correlative modeling of climatic similarities between native and invaded areas [for example, see the
studies of Thuilleret al. (12), Capinha et al. (14), and Cardador et al.
(36)]. However, predictions of environmental suitability assume perfect
transferability of realized niches, which is generally unlikely (37). Changes in the shape and size of realized niches between native and invaded ranges can result in both over- and underprediction of the
extent of area suitable for species establishment (38), so caution would
be required when interpreting the results of pooled network and environmental suitability analyses. We note that our data set on suc-cessful bird invasions is dominated by parrot species and, to a lesser extent, passerine invasions across Europe (table S6). This is to be expected, because these are the two most traded bird taxa, the known taxonomic bias in CITES-listed species and the pre-ban trade
predom-inance of bird imports into Europe (16).
In conclusion, trade bans unilaterally implemented by a major eco-nomic power can effectively reduce species invasion risk globally. How-ever, by definition of their regional nature, these bans cannot eliminate trade-driven invasion risk fully. New, generally smaller trade routes have opened since the European ban took place, driven by the availa-bility of transport infrastructures and the vagaries of supply and demand
(39, 40). Although it remains to be seen how important the network
topology parameters identified here are for invasions of other taxa and to other areas, our study highlights how network theory and tools can be applied to quantify the probability of successful species invasions via trade and transport networks. In particular, network models can be used to identify countries or regions emerging as central to these newly formed trade relations, where new invasions may thus be likely to occur. Investing in better biosecurity, surveillance for likely high-risk invasive species, and improved socioeconomic governance (20) in such countries will enable the global community to more effectively prevent and mit-igate future biological invasions.
MATERIALS AND METHODS Experimental design CITES trade data
Data on global bird trade between biogeographical realms were ob-tained from the CITES database (available online at https://trade.cites. org/). This database is maintained by the Secretariat of the CITES and registers trade between signatory countries. The database holds trade information on about 5600 animal species listed in the different CITES Annexes, though it is not without limitations. First, it covers only 1700 of 2600 bird species known to be traded. World bird trade markets are dominated by the trade in Passeriformes and Psittaciformes, and whereas
the latter are well characterized, the former are underrepresented (16).
Second, CITES relies on information communicated by governments of exporter and importer countries, and data are, therefore, not free of errors or biases. For example, there are chances that governments might occasionally fail to correctly report transactions, that species might be misidentified, and that the number of individuals involved might be
poorly estimated (34). Despite these potential errors and biases in the
on March 5, 2018
http://advances.sciencemag.org/
documentation of trade, CITES represents the only global, legally binding, convention addressing international trade in wildlife in a structured and verifiable manner, and it constitutes a valuable source of information to assess the relationships between species invasions and international trade.
Data were downloaded from the CITES database, using the global checklist Catalogue of Life (www.catalogueoflife.org) as the taxonomic authority. Queries on the database were performed at the genus level, for the periods 1995–2005 (before the EU ban) and 2006–2011 (after the
EU ban), using the following criteria:“live” for trade term, “all
coun-tries” for export and import countries, “wild” for source of species,
and“all purposes” for purpose of trade transaction. We selected these
periods because by 1995, 75% of the parties had already signed the con-vention, and data could be considered representative of general, global trade patterns. Also, from 1995 onward, the accuracy of the database improved by the implementation of taxonomic and species distribution checks. The year of 2011 was chosen as the upper limit to allow for the identification of successful establishment of introduced non-native birds (see below) (41). Several database quality verification steps were undertaken. First, duplicated data lines and records that equate import-er and exportimport-er countries wimport-ere removed from the data set. Second, to obtain the number of live wild birds traded in each transaction, we followed the conservative approach recommended by the Guide of the CITES Trade Database, by selecting the higher figure between the quantity reported by the exporter and the importer. Third, we only re-tained exporter-importer species transactions whereby the number of individuals traded cutoff of five birds, because this cutoff represents a >95% probability that both sexes have been traded to a given country (assuming equal sex ratios). Fourth, the biogeographical realms used
in this study to filter trade transactions were adapted from Olsonet al.
(42), and the Palearctic region was divided in western and eastern
regions following the study of Cramp and Simmons (43). All trading countries were classified according to the realm to which they belong. In the event that a country was crossed by a realm border, it was placed in the realm that covers the largest area. Bird species were similarly classified in terms of the biogeographical realm to which they are native. If the native area covers more than one realm, the species was classified as native to all of them. Last, we verified the agreement between importer and exporter reported (log) quantities, and found that while agreement
was high before the EU trade ban (Pearson’s r = 0.82; 95% CI, 0.76 to
0.86), larger discrepancies were apparent after the ban (r = 0.61; 95% CI, 0.51 to 0.70). The slope of a linear regression between (log) export-er and importexport-er quantities was not diffexport-erent from the one before the EU ban (slope, 0.93; 95% CI, 0.84 to 1.02), but it was after the ban (slope, 0.63; 95% CI, 0.51 to 0.75). Post-ban CITES discrepancies are illustrated as the difference between declared (log) exports and imports in fig. S8.
Trade network metrics
On the basis of the CITES trade database, we derived several variables relevant to species invasion risk from the global bird trade. First, for each species, the annual total number of live, wild-caught birds that have
been (legally) exported to a given country in the periods 1995–2005
and 2006–2011 is given by the variable “quantity.” Second, to test our hypothesis that wildlife trade determines species invasion risk not only by increasing the number of individuals that are eventually introduced to new ranges but also through specific features of the trade network, we apply a set of network metrics that were developed within the
framework of graph theory (44). The trade network for the pre- and
post-ban period was created as a directed graph for each bird species
such that the“nodes” refer to countries and “edges” refer to the trade
observed between an exporter and an importer country. The“weight” of
the edge is represented by the quantity of birds traded. We selected the following metrics to describe the topological properties of countries in the trade network: indegree, closeness centrality, eigenvector centrality, betweenness centrality, and clustering coefficient. The variable indegree describes the number of incoming links (edges) to a country (node), thus reporting the number of countries from which a certain country imports birds. Closeness centrality indicates how closely connected a country is to all other countries in the trade network, considering the shortest path between countries. We calculated this metric on an inverted network—source and target countries were swapped—so that the parameter measures the average of the number of steps in the trade network between the exporter (source) and the importer (target) country. The higher the value is, the more central (shortest distance) the country is, that is, the shorter the trade routes of imported birds
are. The“eigenvector centrality” is another measure of the influence
of a country in the trade network, and it computes the centrality of a country based on the centrality scores of its connections. Thus, a country is considered influential to a trade network (receives a high ei-genvector centrality score) if it trades a lot with countries that are also
influential.“Betweenness centrality” reports how often a country is
found on a shortest path between two countries in the network, and thus measures the extent to which the overall trade flow must pass through a particular country or, in other words, a country’s gatekeeping role. Last, the clustering coefficient measures the probability that the trading partners of a country are connected, and higher values of the coefficient indicate the presence of highly interconnected groups of countries in the trade network. Trade metrics were not strongly
correlated to each other (allr < 0.64). To visualize changes in global
network structure before and after the EU bird trade ban, (standardized) network parameter values were first summed per country to plot the highest-ranking parameter (figs. S1 and S2). Trade networks and asso-ciated statistics were obtained for each taxa, using a custom design java application for this purpose (https://github.com/rpfigueira/ trademetrics) and the open-source Gephi Toolkit library (https:// gephi.org/toolkit/).
Non-native bird occurrence data
To be included in our data set, bird invasions to areas outside species’ natural ranges had to comply with the following conditions. First, inva-sions before 1995 were not included (because of CITES trade data set limitations; see above). Second, bird invasions were considered success-ful if a population was still reported as present at least 5 years after the introduction event [introductions after the year 2011 were thus not
considered, sensu Chironet al. (41)]. Third, and logically, only
CITES-listed bird species were considered. Fourth, island systems that are not an independent party to CITES were excluded. Fifth, multiple successful invasions of the same species to the same country were considered as a single successful invasion of that country for that spe-cies. Sixth, invasive bird populations that likely resulted from range ex-pansion of species introduced to neighboring countries were not retained. Last, as for the trade data, only species invasions across bio-geographical realms were considered to discriminate anthropogenic species introductions from possible natural (for example, climate change–driven) range expansion. Of the 1470 birds species identified up to the species level that are listed in the Index of CITES species (http://checklist.cites.org), 566 species met these criteria. Bird invasion events for these species were assessed and updated from previously
published databases, such as the European DAISIE database (41) and
on March 5, 2018
http://advances.sciencemag.org/
global databases on avian invasions compiled by Dyeret al. (19),
Lever (45), and Sol et al. (46). In addition, for each of the 566 species
retained, we searched Google Scholar with the search string“invasive
OR non-native AND species scientific name” using the time period
1995–2016. For each species, we checked the title and abstract of up to the first 100 hits to decide whether the mentioned (scientific or gray literature) report might hold information on introduction events to non-native ranges. When uncertainty existed on the status of introduc-tion events (that is, successful invasion or not), we searched for recent
species’ observations on the online databases eBird (http://ebird.
org), iNaturalist (www.inaturalist.org), and Global Biodiversity Information Facility (www.gbif.org). In addition, we consulted a leading bird trip report repository (www.cloudbirders.com). For 21 of 566 bird species complying with our inclusion criteria, we found qualified, successful invasion events. In total, 42 (36 pre-ban versus 6 post-ban) successful invasion events were uncovered across 23 dif-ferent countries (table S6).
Statistical analysis
We modeled the probability of each of the species traded in the period 1995–2005 establishing non-native populations in that period as a function of the trade metrics described above, using a phylogenetic generalized linear mixed model in a Bayesian framework. We applied
a probit model in MCMCglmm (47, 48), with invasion success or failure
as a binary response variable, and weak priors for all predictors treated as fixed effects [that is, the trade metrics described above; prior struc-ture as follows: R=list(V=1,fix=1), G=list(G1=list(V=1, nu=0.002), G2 = list(V=1, nu=0.002))]. Note that because binary response varia-bles do not provide enough information to estimate residual variance, the residual variance has been fixed to 1 (47, 48). Location (that is, country), species identity, and phylogeny were included as random
factors. We took the phylogeny from Jetzet al. (49). However, this source
does not provide a unique consensus tree, and following Ruboliniet al.
(50), we downloaded 1000 trees from the http://birdtree.org site and
sum-marized the phylogenetic information into a 50% majority-rule consen-sus tree. All variables were standardized before analyses. MCMCglmm models were run for 50,000,000 iterations with a burn-in of 10,000 and a thinning interval of 500. Model convergence and mixing were assessed by ensuring that the effective sample size for all estimates was larger than 1000; in addition, we used the Heidelberg stationary test as implemented
in the R package“coda” (51) to verify whether sampled values come
from a stationary distribution. Variable selection was carried out using
the R MuMIn package (52), which ran all possible additive combinations
of fixed effect variables, ranking models based on DIC values (53). The
resulting best-supported (“baseline”) model was then projected onto the
2006–2011 trade network data to obtain estimates of wild bird trade– related invasion risk after the implementation of the EU ban. These baseline model forecasts rely on stable response-to-predictor variable re-lationships. Although measuring the stability of these relationships is not currently possible because of the low number of successful post-ban in-vasion events, our baseline model is calibrated on the wide, global-scale heterogeneity in trade flows present before the ban. As the current, post-ban global trade network is a subset of the pre-post-ban network (fig. S3), our invasion risk forecasts do not extend beyond the parameter space in which the baseline model was calibrated. To visualize invasion risks in
the pre- and post-ban periods, species’ fitted (pre-ban) or predicted
(post-ban) invasion probabilities were summed per country (figs. S3 and S4); changes in invasion risk were visualized as the difference in summed pre- and post-ban probabilities (Fig. 3).
SUPPLEMENTARY MATERIALS
Supplementary material for this article is available at http://advances.sciencemag.org/cgi/ content/full/3/11/e1700783/DC1
table S1. CITES bird trade data before and after the 2005 EU ban.
table S2. Overview of the 10 highest-ranked countries in terms of network centrality measures. table S3. Overview of network parameter values per biogeographical region.
table S4. Birds annually exported to different biogeographical realms. table S5. Birds annually exported from different biogeographical realms. table S6. Invasion events of CITES-listed species before and after the 2005 EU ban. fig. S1. Highest-ranking trade volume/network structure parameters in the period 1995–2005. fig. S2. Highest-ranking trade volume/network structure parameters in the period 1995–2005. fig. S3. Histograms of network centrality measures in the period 1995–2005 versus 2006–2011. fig. S4. Global wild bird trade–driven invasion risk in the period 1995–2005.
fig. S5. Global wild bird trade–driven invasion risk in the period 2006–2011. fig. S6. Trade fluxes of CITES-listed passerine birds in the period 1995–2005. fig. S7. Trade fluxes of CITES-listed Psittaciformes birds in the period 1995–2005. fig. S8. Discrepancies between exporter- and importer-listed quantities of traded wild birds.
REFERENCES AND NOTES
1. L. Pejchar, H. A. Mooney, Invasive species, ecosystem services and human well-being. Trends Ecol. Evol. 24, 497–504 (2009).
2. K. F. Smith, M. Behrens, L. M. Schloegel, N. Marano, S. Burgiel, P. Daszak, Reducing the risks of the wildlife trade. Science 324, 594–595 (2009).
3. M. Carrete, J. L. Tella, Wild-bird trade and exotic invasions: A new link of conservation concern? Front. Ecol. Environ. 6, 207–211 (2008).
4. W. B. Karesh, R. A. Cook, E. L. Bennett, J. Newcomb, Wildlife trade and global disease emergence. Emerg. Infect. Dis. 11, 1000–1002 (2005).
5. D. W. S. Challender, S. R. Harrop, D. C. MacMillan, Towards informed and multi-faceted wildlife trade interventions. Glob. Ecol. Conserv. 3, 129–148 (2015).
6. Commission Decision, Commission decision of 27 October 2005 concerning certain protection measures in relation to highly pathogenic avian influenza in certain third countries for the import of captive birds. Off. J. Eur. Union (2005).
7. Commission Regulation, Commission regulation (EC) No 318/2007 of 23 March 2007 laying down animal health conditions for imports of certain birds into the community and the quarantine conditions thereof. Off. J. Eur. Union (2007).
8. World Parrot Trust, The European Union Wild Bird Declaration: An NGO Call to Halt Wild Bird Imports into the European Union (World Parrot Trust, 2004); www.ibrarian.net/navon/ paper/The_European_Union_Wild_Bird_Declaration.pdf?paperid=2495640.
9. K. Conrad, Trade bans: A perfect storm for poaching? Trop. Conserv. Sci. 5, 245–254 (2012).
10. R. Cooney, P. Jepson, The international wild bird trade: What’s wrong with blanket bans? Oryx 40, 18–23 (2006).
11. D. S. Weber, T. Mandler, M. Dyck, P. J. Van Coeverden De Groot, D. S. Lee, D. A. Clark, Unexpected and undesired conservation outcomes of wildlife trade bans—An emerging problem for stakeholders? Glob. Ecol. Conserv. 3, 389–400 (2015).
12. W. Thuiller, D. M. Richardson, P. Pyšek, G. F. Midgley, G. O. Hughes, M. Rouget, Niche-based modelling as a tool for predicting the risk of alien plant invasions at a global scale. Global Change Biol. 11, 2234–2250 (2005).
13. M. I. Westphal, M. Browne, K. MacKinnon, I. Noble, The link between international trade and the global distribution of invasive alien species. Biol. Invasions 10, 391–398 (2008). 14. C. Capinha, F. Essl, H. Seebens, D. Moser, H. M. Pereira, The dispersal of alien species
redefines biogeography in the Anthropocene. Science 348, 1248–1251 (2015). 15. N. C. Banks, D. R. Paini, K. L. Bayliss, M. Hodda, The role of global trade and transport
network topology in the human-mediated dispersal of alien species. Ecol. Lett. 18, 188–199 (2015).
16. Food and Agriculture Organization of the United Nations, International Trade in Wild Birds, and Related Bird Movements, in Latin America and the Caribbean (Animal Production and Health Paper No. 166, Food and Agriculture Organization of the United Nations, 2011). 17. E. R. Bush, S. E. Baker, D. W. MacDonald, Global trade in exotic pets 2006–2012.
Conserv. Biol. 28, 663–676 (2014).
18. G. Olah, S. H. M. Butchart, A. Symes, I. M. Guzmán, R. Cunningham, D. J. Brightsmith, R. Heinsohn, Ecological and socio-economic factors affecting extinction risk in parrots. Biodivers. Conserv. 25, 205–223 (2016).
19. E. E. Dyer, P. Cassey, D. W. Redding, B. Collen, V. Franks, K. J. Gaston, K. E. Jones, S. Kark, C. D. L. Orme, T. M. Blackburn, The global distribution and drivers of alien bird species richness. PLOS Biol. 15, e2000942 (2017).
20. E. C. Brenton-Rule, R. F. Barbieri, P. J. Lester, Corruption, development and governance indicators predict invasive species risk from trade. Proc. R. Soc. B Biol. Sci. 283, 20160901 (2016).
on March 5, 2018
http://advances.sciencemag.org/
21. I. MacGregor-Fors, R. Calderón-Parra, A. Meléndez-Herrada, S. López-López, J. E. Schondube, Pretty, but dangerous! Records of non-native Monk Parakeets (Myiopsitta monachus) in Mexico. Rev. Mex. Biodivers. 82, 1053–1056 (2011).
22. M. Gilbert, C. Sokha, P. H. Joyner, R. L. Thomson, C. Poole, Characterizing the trade of wild birds for merit release in Phnom Penh, Cambodia and associated risks to health and ecology. Biol. Conserv. 153, 10–16 (2012).
23. X. Liu, M. E. McGarrity, Y. Li, The influence of traditional Buddhist wildlife release on biological invasions. Conserv. Lett. 5, 107–114 (2012).
24. S. Su, P. Cassey, T. Blackburn, Patterns of non-randomness in the composition and characteristics of the Taiwanese bird trade. Biol. Invasions 16, 2563–2575 (2014). 25. H. Seebens, T. M. Blackburn, E. E. Dyer, P. Genovesi, P. E. Hulme, J. M. Jeschke, S. Pagad,
P. Pyšek, M. Winter, M. Arianoutsou, S. Bacher, B. Blasius, G. Brundu, C. Capinha, L. Celesti-Grapow, W. Dawson, S. Dullinger, N. Fuentes, H. Jäger, J. Kartesz, M. Kenis, H. Kreft, I. Kühn, B. Lenzner, A. Liebhold, A. Mosena, D. Moser, M. Nishino, D. Pearman, J. Pergl, W. Rabitsch, J. Rojas-Sandoval, A. Roques, S. Rorke, S. Rossinelli, H. E. Roy, R. Scalera, S. Schindler, K.Štajerová, B. Tokarska-Guzik, M. van Kleunen, K. Walker, P. Weigelt, T. Yamanaka, F. Essl, No saturation in the accumulation of alien species worldwide. Nat. Commun. 8, 14435 (2017).
26. J. B. C. Harris, M. W. Tingley, F. Hua, D. L. Yong, J. M. Adeney, T. M. Lee, W. Marthy, D. M. Prawiradilaga, C. H. Sekercioglu, Suyadi, N. Winarni, D. S. Wilcove, Measuring the impact of the pet trade on Indonesian birds. Conserv. Biol. 31, 394–405 (2017). 27. C. R. Shepherd, The bird trade in Medan, North Sumatra: An overview. BirdingASIA 5,
16–24 (2006).
28. P. Jepson, R. J. Ladle, Bird-keeping in Indonesia: Conservation impacts and the potential for substitution-based conservation responses. Oryx 39, 442–448 (2005).
29. C. M. Poole, C. R. Shepherd, Shades of grey: The legal trade in CITES-listed birds in Singapore, notably the globally threatened African grey parrot Psittacus erithacus. Oryx 51, 411–417 (2016).
30. C. R. Shepherd, J. A. Eaton, S. C. L. Chng, Nothing to laugh about—The ongoing illegal trade in laughingthrushes (Garrulax species) in the bird markets of Java, Indonesia. Bird Conserv. Int. 26, 524–530 (2016).
31. J. Phelps, D. Biggs, E. L. Webb, Tools and terms for understanding illegal wildlife trade. Front. Ecol. Environ. 14, 479–489 (2016).
32. S. F. Pires, The illegal parrot trade: A literature review. Global Crime 13, 176–190 (2012).
33. F. Essl, S. Dullinger, W. Rabitsch, P. E. Hulme, K. Hülber, V. Jarošík, I. Kleinbauer, F. Krausmann, I. Kühn, W. Nentwig, M. Vilà, P. Genovesi, F. Gherardi,
M.-L. Desprez-Loustau, A. Roques, P. Pyšek, Socioeconomic legacy yields an invasion debt. Proc. Natl. Acad. Sci. U.S.A. 108, 203–207 (2011).
34. A. G. Blundell, M. B. Mascia, Discrepancies in reported levels of international wildlife trade. Conserv. Biol. 19, 2020–2025 (2005).
35. A. G. Blundell, B. D. Rodan, Mahogany and CITES: Moving beyond the veneer of legality. Oryx 37, 85–90 (2003).
36. L. Cardador, M. Lattuada, D. Strubbe, J. L. Tella, L. Reino, R. Figueira, M. Carrete, Regional bans on wild-bird trade modify invasion risks at a global scale. Conserv. Lett. (2017).
37. O. Broennimann, M. C. Fitzpatrick, P. B. Pearman, B. Petitpierre, L. Pellissier, N. G. Yoccoz, W. Thuiller, M.-J. Fortin, C. Randin, N. E. Zimmermann, C. H. Graham, A. Guisan, Measuring ecological niche overlap from occurrence and spatial environmental data. Glob. Ecol. Biogeogr. 21, 481–497 (2012).
38. D. Strubbe, O. Broennimann, F. Chiron, E. Matthysen, Niche conservatism in non-native birds in Europe: Niche unfilling rather than niche expansion. Glob. Ecol. Biogeogr. 22, 962–970 (2013).
39. D. Chapman, B. V. Purse, H. E. Roy, J. M. Bullock, Global trade networks determine the distribution of invasive non-native species. Glob. Ecol. Biogeogr. 26, 907–917 (2017). 40. R. Early, B. A. Bradley, J. S. Dukes, J. J. Lawler, J. D. Olden, D. M. Blumenthal, P. Gonzalez,
E. D. Grosholz, I. Ibañez, L. P. Miller, C. J. B. Sorte, A. J. Tatem, Global threats from invasive alien species in the twenty-first century and national response capacities. Nat. Commun. 7, 12485 (2016).
41. F. Chiron, S. Shirley, S. Kark, Human-related processes drive the richness of exotic birds in Europe. Proc. R. Soc. B Biol. Sci. 276, 47–53 (2009).
42. D. M. Olson, E. Dinerstein, E. D. Wikramanayake, N. D. Burgess, G. V. N. Powell, E. C. Underwood, J. A. D’Amico, I. Itoua, H. E. Strand, J. C. Morrison, C. J. Loucks, T. F. Allnutt, T. H. Ricketts, Y. Kura, J. F. Lamoreux, W. W. Wettengel, P. Hedao, K. R. Kassem, Terrestrial ecoregions of the world: A new map of life on earth: A new global map of terrestrial ecoregions provides an innovative tool for conserving biodiversity. Bioscience 51, 933–938 (2001).
43. S. Cramp, K. E. L. Simmons, The Birds of the Western Palearctic, Volume I (Oxford Univ. Press, 1977).
44. D. M. P. Jacoby, R. Freeman, Emerging network-based tools in movement ecology. Trends Ecol. Evol. 31, 301–314 (2016).
45. C. Lever, Naturalized Birds of the World (T. & A. D. Poyser, 2005).
46. D. Sol, J. Maspons, M. Vall-llosera, I. Bartomeus, G. E. García-Peña, J. Piñol, R. P. Freckleton, Unraveling the life history of successful invaders. Science 337, 580–583 (2012). 47. J. D. Hadfield, MCMC methods for multi-response generalized linear mixed models: The
MCMCglmm R package. J. Stat. Softw. 33, 1–22 (2010).
48. P. de Villemereuil, O. Gimenez, B. Doligez, Comparing parent–offspring regression with frequentist and Bayesian animal models to estimate heritability in wild populations: A simulation study for Gaussian and binary traits. Methods Ecol. Evol.4, 260–275 (2013). 49. W. Jetz, G. H. Thomas, J. B. Joy, K. Hartmann, A. O. Mooers, The global diversity of birds in
space and time. Nature 491, 444–448 (2012).
50. D. Rubolini, A. Liker, L. Z. Garamszegi, A. P. Møller, N. Saino, Using the BirdTree.org website to obtain robust phylogenies for avian comparative studies: A primer. Curr. Zool. 61, 959–965 (2015).
51. M. Plummer, N. Best, K. Cowles, L. Vines, CODA: Convergence diagnosis and output analysis for MCMC. R News 6, 7–11 (2006).
52. K. Barton, MuMIn: Multi-Model Inference, R package version 1.15.6 (2016); https://CRAN. R-project.org/package=MuMIn.
53. D. J. Spiegelhalter, N. G. Best, B. P. Carlin, A. Van Der Linde, Bayesian measures of model complexity and fit. J. R. Stat. Soc. Ser. B Stat. Methodol. 64, 583–639 (2002).
Acknowledgments: We thank COST Action ES1304 (ParrotNet) for sponsoring discussions contributing to the manuscript development. Funding: This study was funded by FEDER Funds through the Operational Competitiveness Factors Program“COMPETE”, and by National Funds through the Foundation for Science and Technology (FCT) within the framework of project”PTDC/AAG-GLO/0463/2014-POCI-01-0145-FEDER-016583.” L.R. and C.C. acknowledge support from the FCT through grants SFRH/BPD/93079/2013 and SFRH/BPD/84422/2012, respectively. D.S. is funded by a Marie Skłodowska-Curie Action (H2020-MSCA-IF-2015, grant 706318) and, together with M.B.A., acknowledges the Danish National Research Foundation for support to the Center for Macroecology, Evolution and Climate (grant DNRF96). P.B. was supported by EDP (Energias de Portugal) Biodiversity Chair. Author contributions: L.R., M.B.A., P.B., D.S., and R.F. designed the study. L.R. and R.F. extracted data from the CITES database. R.F. calculated network topology and metrics variables. L.R. and D.S. gathered data on bird invasion events. D.S. performed statistical analyses. D.S., L.R., M.B.A., P.B., and C.C. led the manuscript writing. All authors contributed to interpreting the results and revising the manuscript and approved the final manuscript. Competing interests: The authors declare that they have no competing interests. Data and materials availability: The data that support the findings of this study are made available in the supplementary tables and/or can be freely downloaded at https://trade.cites.org/ and http://birdtree.org/.
Submitted 14 March 2017 Accepted 31 October 2017 Published 22 November 2017 10.1126/sciadv.1700783
Citation:L. Reino, R. Figueira, P. Beja, M. B. Araújo, C. Capinha, D. Strubbe, Networks of global bird invasion altered by regional trade ban. Sci. Adv. 3, e1700783 (2017).
on March 5, 2018
http://advances.sciencemag.org/
Luís Reino, Rui Figueira, Pedro Beja, Miguel B. Araújo, César Capinha and Diederik Strubbe
DOI: 10.1126/sciadv.1700783 (11), e1700783. 3
Sci Adv
ARTICLE TOOLS http://advances.sciencemag.org/content/3/11/e1700783
MATERIALS
SUPPLEMENTARY http://advances.sciencemag.org/content/suppl/2017/11/17/3.11.e1700783.DC1
REFERENCES
http://advances.sciencemag.org/content/3/11/e1700783#BIBL This article cites 45 articles, 6 of which you can access for free
PERMISSIONS http://www.sciencemag.org/help/reprints-and-permissions
Terms of Service Use of this article is subject to the
registered trademark of AAAS.
is a
Science Advances
Association for the Advancement of Science. No claim to original U.S. Government Works. The title
York Avenue NW, Washington, DC 20005. 2017 © The Authors, some rights reserved; exclusive licensee American (ISSN 2375-2548) is published by the American Association for the Advancement of Science, 1200 New
Science Advances
on March 5, 2018
http://advances.sciencemag.org/