Active removal of inorganic phosphate from cerebrospinal fluid by the
choroid plexus
Pedro M. Guerreiro,1,3Amy M. Bataille,2Sonda L. Parker,2and J. Larry Renfro2,3
1Centre of Marine Sciences, Universidade do Algarve, Faro, Portugal;2Department of Physiology and Neurobiology, University of Connecticut, Storrs, Connecticut; and3Mount Desert Island Biological Laboratory, Salisbury Cove, Maine Submitted 14 August 2013; accepted in final form 8 April 2014
Guerreiro PM, Bataille AM, Parker SL, Renfro JL. Active removal of inorganic phosphate from cerebrospinal fluid by the choroid plexus. Am J Physiol Renal Physiol 306: F1275–F1284, 2014. First published April 16, 2014; doi:10.1152/ajprenal.00458.2013.— The Piconcentration of mammalian cerebrospinal fluid (CSF) is about
one-half that of plasma, a phenomenon also shown here in the spiny dogfish, Squalus acanthias. The objective of the present study was to characterize the possible role of the choroid plexus (CP) in determin-ing CSF Piconcentration. The large sheet-like fourth CP of the shark
was mounted in Ussing chambers where unidirectional 33P i fluxes
revealed potent active transport from CSF to the blood side under short-circuited conditions. The flux ratio was 8:1 with an average transepithelial resistance of 87⫾ 17.9 ⍀·cm2and electrical potential
difference of⫹0.9 ⫾ 0.17 mV (CSF side positive). Active Pi
absorp-tion from CSF was inhibited by 10 mM arsenate, 0.2 mM ouabain, Na⫹-free medium, and increasing the K⫹concentration from 5 to 100 mM. Li⫹stimulated transport twofold compared with Na⫹-free me-dium. Phosphonoformic acid (1 mM) had no effect on active Pi
transport. RT-PCR revealed both Pi transporter (PiT)1 and PiT2
(SLC20 family) gene expression, but no Na⫹-Pi cotransporter II
(SLC34 family) expression, in the shark CP. PiT2 immunoreactivity was shown by immunoblot analysis and localized by immunohisto-chemistry in (or near) the CP apical microvillar membranes of both the shark and rat. PiT1 appeared to be localized primarily to vascular endothelial cells. Taken together, these data indicate that the CP actively removes Pifrom CSF. This process has transport properties
consistent with a PiT2, Na⫹-dependent transporter that is located in the apical region of the CP epithelium.
phosphate transport; cerebrospinal fluid composition; choroid plexus; Slc34; Slc20; inorganic phosphate transporter 1; inorganic phosphate transporter 2; Na⫹-inorganic phosphate cotransporter II
THE INORGANIC PHOSPHATE CONCENTRATION([Pi]) in human ven-tricular cerebrospinal fluid (CSF) ([Pi]CSF) is maintained at ⬃0.4 mM compared with plasma at ⬃1.8 mM (11, 16). How and why [Pi]CSF is controlled at this lower concentration is unknown. Despite the importance of [Pi] for the control of normal cellular metabolic activity, extracellular and intracellu-lar pH and [Ca2⫹] (8), characterization of Pitransport by the choroid plexus (CP) seems not to have been done in any vertebrate. The CP forms 70 – 80% of the CSF and helps stabilize and regulate its composition. The blood-brain barrier (BBB) and metabolic water (20) are the apparent sources of the remaining 20 –30% of CSF. In addition to its buoying (cush-ioning) effect, CSF provides a buffer for brain tissues against variations in plasma composition (4). Specific epithelial trans-port processes selectively mediate the exchange of various
substrates between plasma and brain interstitial fluid (ISF) and CSF. Together, BBB and CP membrane transporters can per-form a multitude of functions including the removal of organic wastes from brain ISF and CSF while actively managing the inorganic ion composition and rate of formation of these fluids. CSF is ⬃15 meq higher in Cl⫺ than plasma with only about one-half the plasma [K⫹]. [Na⫹] and pH are about the same as plasma, and [HCO3⫺] in CSF ([HCO3⫺]CSF) can vary but is usually similar to or less than that of plasma (4).
The mechanism of regulation of [Pi]CSFis unclear. Several factors leading to significant changes in [HCO3⫺]CSFand [Cl⫺] in CSF evoked modifications in [Pi]CSF(15, 16). Whether these reflect direct or indirect effects over specific Pi transport mechanisms was not established. The existence of a Pi/HCO3⫺ exchange process in isolated BBB capillaries has been sug-gested (5, 6). ISF enters CSF by slow bulk flow and most likely travels along perivascular pathways and axon tracts. CSF may circulate and mix with ISF along these same pathways (1). Therefore, the BBB could, at least in part, contribute to the Pi balance in CSF. However, these studies were not further explored, and the existence and possible relevance of such transporters have not been demonstrated in the CP. While we lack a detailed understanding of the mechanisms that mediate and modulate the establishment and maintenance of [Pi]CSF, our understanding of the major processes influencing plasma [Pi] are fairly well understood and have been reviewed (see Ref. 36). To summarize, in the intestine and kidney, members of the Na⫹-Picotransporter type II (NaPiII) family (SLC34), located in the apical membrane of enterocytes and the proximal tubule epithelium, are well-characterized carriers responsible for Pientry into epithelial cells (SLC34b for intestinal absorp-tion and SLC34a and, to a lesser extent, SLC34c for renal reabsorption). Two other Na⫹-Pi cotransporter types are known: type III (SLC20) and type I (SLC17). The latter has a low specificity for Pi transport and rather more for organic anions, including glutamate. The two SLC20 family members, Pi transporter (PiT)1 (SLC20A1) and PiT2 (SLC20A2), are ubiquitously expressed and thought to have mainly a cellular Pi housekeeping role, but other more specific roles are emerging for these transporters.
Direct determination of the cellular mechanisms that medi-ate transepithelial transport of Pi and other solutes across the intact mammalian blood-CSF barrier is limited by the tissue’s complex morphology, relatively small size, and limited acces-sibility. The frond-like folds of the mammalian CP prevent direct access to the basolateral membranes of the epithelium with techniques relying on ventriculocisternal perfusion or an isolated, intact CP. In the dogfish shark, Squalus acanthias, the fourth ventricle of the brain is covered by a sheet of choroidal epithelium with shallow convolutions, which, unlike the highly Address for reprint requests and other correspondence: J. L. Renfro, Dept. of
Physiology and Neurobiology, Univ. of Connecticut, 75 N. Eagleville Rd., U3156, Torrey Life Sciences, Rm. 63A, Storrs, CT 06269-3156 (e-mail: [email protected]).
enfolded CP of mammals, lies on the surface of the brain and can be removed and mounted in Ussing chambers. The dogfish CP tissue is also 25-fold larger than that of humans (as a percentage of brain weight) and has proven to be an effective means of modeling this tissue’s transepithelial transport prop-erties (25, 34, 35).
Here, we report that spiny dogfish shark [Pi]CSF is main-tained below that of plasma, as in humans, and that this is likely due to a powerful Pitransport system in the CP, active in the CSF-to-blood direction, and with PiT (Slc20)-like transport properties. We found no evidence of Slc34 (NaPiII family of Pi transporters) expression in the shark CP; however, both PiT1 and PiT2 were expressed there. PiT1 appears to be located mainly in the vascular endothelium, whereas PiT2 is localized in, or in close proximity to, the apical microvillar membranes of the CP epithelium at the ventricular surface in both the shark and rat.
MATERIALS AND METHODS
Animals. Adult male and female spiny dogfish sharks (S. acanthias
L., ⬃2-kg body mass) were collected from the coastal waters off Woods Hole, MA, by the Marine Biological Laboratory or off Mount Desert Island, ME, and transported to Mount Desert Island Biological Laboratory, where they were held in large (⬃12,000 liter) tanks of flowing seawater for 5–10 days before use. Experiments were con-ducted in the period from mid-July to mid-September, during which tank temperature ranged from 13 to 17°C. Animals were decapitated, and the cranial compartment was immediately removed, flooded with ice-cold elasmobranch Ringer (ER) solution (see below and Table 1), and placed on ice. The brain was removed, and, while the brain was submerged in ice-cold sterile ER solution, the two halves of the fourth plexus were excised and cleared of extraneous tissue. Tissues were then prepared for immunoblot analysis, immunohistochemistry, or RNA extraction or mounted in Ussing chambers for measurements of transepithelial transport.
The mammalian lateral CP was removed from albino laboratory rats (Rattus norveigicus), which were anesthetized with isoflurane and decapitated within 10 min postmortem. The present study adhered to
the “Guiding Principles for Research” as outlined by the American Physiological Society (2002). All investigations involving animals reported in this study were conducted in conformity with these principles. The animal protocol for sharks was approved by the Institutional Animal Care and Use Committee of Mount Desert Island Biological Laboratory (protocol no. 0606, MDIBL Institutional As-surance no. A3562-01), and the protocol for rats was approved by the Institutional Animal Care and Use Committee of the University of Connecticut (no. A11 038R).
Solutions and chemicals. ER solutions in original and modified
forms [Na⫹-free ER, Li⫹-containing ER (Li⫹-ER), and high-K⫹ER solutions] were prepared according to the specifications shown in Table 1. Saline solutions were prepared in advance and kept at 4°C, and labile substances such as urea, trimethylamine N-oxide, and glucose were added to the working volume just before use. For treatment with sodium arsenate (10 mM), phosphonoformic acid (PFA; 1 mM), or ouabain (0.2 mM), working solutions were prepared fresh each day. The protein-free nature of the ER solution closely resembled artificial elasmobranch CSF (12) and, consistent with a short-circuited state, was used on both sides of the tissue during transport measurements.
Plasma and CSF ionic composition. Blood samples were collected
from the caudal vein and placed at 4°C until completely clotted, at which time serum was removed to a fresh tube. After animals had been decapitated, CSF was collected from the cranial cavity with a 1-ml syringe fitted with a blunted pipette tip. Both fluids were either immediately analyzed or frozen for later evaluation of cation and anion composition. [Na⫹], [K⫹], [Mg2⫹], [Ca2⫹], [Cl⫺], [Pi], and
[SO42⫺] were determined using a Dionex DX-120 ion chromatograph.
Transepithelial Pitransport. Excised halves of the fourth CP were mounted in Ussing chambers with an aperture size of 0.197 cm2and
fluid volume (ER solution) of 1.9 ml/hemichamber. The temperature was maintained at a constant 14°C, and fluid inside the chambers was constantly and vigorously stirred with small magnetic stir bars turned by external stir plates and insufflated with humidified 99% O2-1%
CO2. The transepithelial potential difference (TPD) was determined
with Ag/AgCl electrodes connected to the CSF and interstitial (blood side) compartments with 3 M KCl-2% agar bridges. Electrical prop-erties were determined with a computer-controlled, high-impedance automatic dual-voltage clamp (DVC 4000, World Precision Instru-ments, Sarasota, FL). Electrode asymmetry was corrected at the beginning and end of each experiment. Short-circuiting electrodes were connected to the CSF and interstitial solutions with 3 M KCl-2% agar bridges. The transepithelial resistance (TER) was determined from the change in TPD produced by a brief 10-A pulse controlled by the voltage clamps. TER was corrected for fluid resistance. During flux determinations, the tissues were continuously short circuited (i.e., clamped at TPD⫽ 0 mV), and the integrity of the tissues was assessed by measurements of TPD and TER at various time points during and at the end of each experiment.
Unidirectional tracer fluxes were initiated by the addition of 1.0 Ci H333PO4 (MP Biomedicals) to the appropriate hemichamber.
Duplicate 50-l samples were taken from the unlabeled side at 30-min intervals over a period of 2 h and replaced with equal volumes of unlabeled solution. Radioactivity was measured by liquid scintillation (Packard TriCarb 2200CA). The specific activity of the labeled solution was determined at the beginning and end of each experiment. Net flux was calculated as the difference between unidirectional secretory (blood side to CSF side) and reabsorptive (CSF side to blood side) fluxes.
To determine the effects of arsenate, PFA, or ouabain on active Pi
transport, tissues in Ussing chambers were initially incubated in ER solution (with H333PO4added to the CSF side) for 60 min to establish
basal transport, and this solution was then removed and replaced with ER solution containing the appropriate inhibitor at the described concentrations. Isotope was added to the CSF side, and transport was measured for 60 min. To establish the roles of Na⫹and Li⫹, transport
Table 1. Composition of the saline solutions used for measurements of transepithelial transport
ER Solutions Regular ER solution Na⫹-free ER solution Li⫹-containing ER solution High-K⫹ER solution NaCl 280 180 LiCl 280 KCl 6 4 4 106 CaCl2 4 4 4 4 MgCl2 3 3 2.5 3 NaH2PO4 1 1 K2HPO4 1 1 NaHCO3 8 8 Na2SO4 0.5 0.5 MgSO4 0.5 0.5 N-methyl-D-glucamine titrated with HCl 280 Trimethylamine N-oxide 72 72 72 72 Urea 350 350 350 350 HEPES 25 25 25 25 Glucose 5 5 5 5 pH adjusted to 7.8 7.8 7.8 7.8
was initially measured in Na⫹-free ER solution for 60 min; the tissue was then rinsed, and Li⫹-ER solution was added for 60 min followed by a rinse and the addition of normal Na⫹-containing ER solution for an additional 60 min. To determine the effects of changing the plasma membrane K⫹gradient, transport was measured in control ER solu-tion for 60 min, and the solusolu-tion was then replaced with high-K⫹ER solution for an additional 60-min measurement. To establish whether this effect was reversible, some tissues were then returned to control ER solution for an additional 60-min flux measurement. Control flux measurements were done by changing solutions as described above using only control ER solution.
Isolation of mRNA and RT-PCR. Freshly isolated tissues were
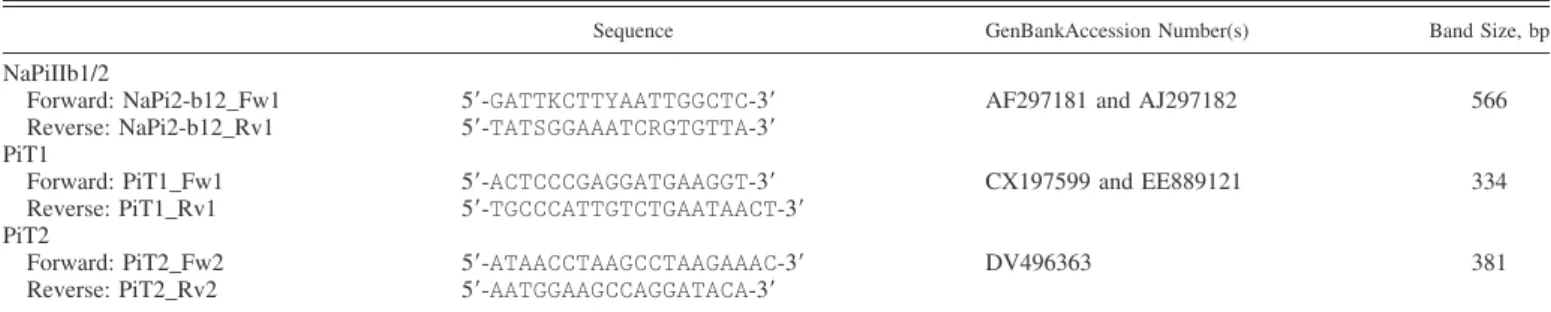
collected into RNAlater (Sigma) and stored at 4°C until further processed. RNA was isolated from tissues using the Qiagen RNeasy kit according to the manufacturer’s instructions. RNA concentrations and purity were measured at 260 and 280 nm using a UV Nanodrop spectrophotometer (Thermo Scientific) to ensure the same total RNA from each tissue per reaction. Synthesis of cDNA and semiquantita-tive PCR were performed using the Qiagen OneStep RT-PCR kit, and primers were generated (Integrated DNA Technologies) against the partial sequences for spiny dogfish shark NaPiII, PiT1, and PiT2 retrieved from MDIBL expressed sequence tags (for primer sequences and respective GenBank Accession Numbers, see Table 2). The RT reaction was performed at 50°C for 30 min followed by 95°C incubation for 15 min to denature the reverse transcriptase. This was immediately followed by the PCR, which had a denaturing tempera-ture of 94°C for 1 min, an annealing temperatempera-ture of 54°C for 1 min, and an extending temperature of 72°C for 1 min for 30 cycles. Identical amounts of PCR products were separated on a 1% agarose gel and stained with Gel-Star (Lonza Rockland, Rockland, ME).
Immunolocalization. Immunohistochemistry of PiT1 and PiT2 was
done with polyclonal rabbit anti-human antibodies (PiT1: sc-98814, Santa Cruz Biotechnology; PiT2: HPA026540, Sigma-Aldrich) di-luted 1:1,600 and 1:1,000, respectively. Shark fourth CPs were fixed in 10% formalin and paraffin embedded. Five-micrometer sections were quenched with 3% H2O2for 10 min (PiT2) or 30 min (PiT1).
Antigen retrieval for PiT2 was done with Target Retrieval Solution (Dako) for 20 min in steam. PiT1 antigen retrieval was done by treatment with Dako’s Proteinase K solution for 10 min. After blockade with Animal-Free Block solution (Vector), primary antibody exposure was done for 60 min (PiT2) or overnight (PiT1). In all cases, the secondary antibody was Dako’s Envision⫹ Dual Link Polymer (catalog. no. K4063) exposure for 30 min. Chromogen was nova red (SK-4800, Vector) applied for 10 min and counterstained with hema-toxylin. Isotype controls were treated with nonimmune rabbit IgG instead of primary antibody.
Immunohistochemistry of PiT2 in the rat lateral CP was done with a goat anti-human antibody (sc-50274, Santa Cruz Biothechnology) and fivefold excess blocking peptide (sc-50274P, Santa Cruz Bioth-echnology). Rat tissues were prepared for immunohistochemistry as described above.
Protein isolation, SDS-PAGE, and immunoblot analysis. CPs were
placed in sample buffer (2.3% SDS, 5% -mercaptoethanol, 10%
glycerol, 0.5% bromophenol blue, and 62.5 mM Tris·HCl, pH 6.8) containing a mixture of protease inhibitors, vortexed vigorously, and centrifuged. The supernatant was collected and used for SDS-PAGE (12% resolving gel, 4% stacking gel). Gel products were transferred to a polyvinylidene fluoride (PVDF) membrane (Millipore). PVDF membranes were treated with blocking buffer (PBS containing 137 mM NaCl, 2.7 mM KCl, 4.3 mM Na2HPO4, and 1.5 mM KH2PO4, pH
7.3 with HCl) with 3% nonfat dry milk and 0.05% Tween 20 for 2 h at room temperature. Spiny dogfish shark PiT2 was detected using an affinity-purified polyclonal rabbit anti-rat antibody (kindly provided by Dr. Victor Sorribas, University of Zaragoza, Zaragoza, Spain) diluted 1:500 and a rabbit anti-human polyclonal antibody (SLC20A2, HPA026540, Sigma-Aldrich) diluted 1:500. Rat lateral CP PiT2 was detected with the antibody provided by Dr. Sorribas as described above and with a commercially available goat anti-human antibody (sc-50274 and blocking peptide sc-50274P, Santa Cruz Biotechnol-ogy) diluted 1:500.-Actin was detected with a commercially avail-able affinity-purified polyclonal rabbit anti--actin antibody diluted 1:1,000 (Sigma) (30). PVDF membranes were incubated in the PBS-dry milk-Tween 20 solution containing the primary antibodies at 4°C for 1 h (-actin) or overnight (PiT2), washed three times for 10 min in the PBS-dry milk-Tween 20 solution, and incubated with secondary goat anti-rabbit (Sigma) or donkey anti-goat (Santa Cruz, sc2020) IgG peroxidase conjugate diluted 1:2,000 and 1:5,000, respectively, in the PBS-dry milk-Tween 20 solution for 1 h at room temperature. Mem-branes were washed three times for 10 min in the PBS-dry milk-Tween 20 solution and then rinsed twice with PBS. Signals were detected using ECL Western blotting reagents (Pierce) according to the manufacturer’s instructions and developed on X-ray film (Fujifilm).
Statistics. Experimental results are expressed as means ⫾ SE of
4 –7 individual tissues or fluid samples. To determine differences between the composition of plasma and CSF, a Student’s t-test was used. For comparison between two sets of data showing transport function, the hypothesis that two values recorded in the same tissue at 60 min after exposure to each treatment were identical was tested using a paired t-test. The same method was used for the analysis of TER data. Values were considered different at a 95% confidence level. Statistical analyses were done using SigmaStat 3.0 (SYSTAT Software).
RESULTS
Plasma and CSF composition. The concentrations of several inorganic components of shark serum and CSF are shown in Table 3. CSF taken from the fourth ventricle and serum from the caudal hemal vein blood was no different in cation or sulfate concentrations. Very significant differences in the two fluids were apparent in [Cl⫺] and [Pi]. As in mammals, [Cl⫺] was ⬃15 mM higher in CSF, and [Pi]CSFwas about one-half that of serum.
Table 2. Primer sequences used for the amplification of NaPiII, PiT1, and PiT2 from dogfish shark tissues
Sequence GenBankAccession Number(s) Band Size, bp
NaPiIIb1/2
Forward: NaPi2-b12_Fw1 5=-GATTKCTTYAATTGGCTC-3= AF297181 and AJ297182 566
Reverse: NaPi2-b12_Rv1 5=-TATSGGAAATCRGTGTTA-3= PiT1
Forward: PiT1_Fw1 5=-ACTCCCGAGGATGAAGGT-3= CX197599 and EE889121 334
Reverse: PiT1_Rv1 5=-TGCCCATTGTCTGAATAACT-3=
PiT2
Forward: PiT2_Fw2 5=-ATAACCTAAGCCTAAGAAAC-3= DV496363 381
Reverse: PiT2_Rv2 5=-AATGGAAGCCAGGATACA-3=
Unidirectional Pifluxes. With transepithelial voltage (⫹0.9 ⫾
0.17 mV, sign refers to the ventricular side) clamped at zero and identical ER solution on each side, 33P-labeled P
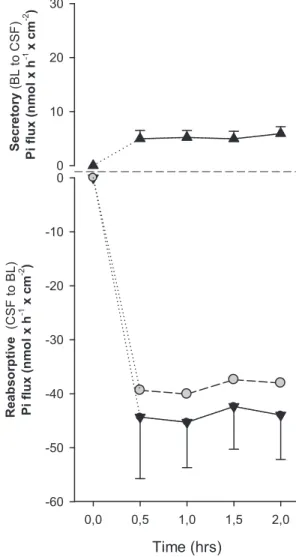
i unidi-rectional fluxes across the freshly dissected dogfish shark fourth CP were measured. The summary of a few time courses (Fig. 1) showed that while transepithelial transport in the blood-to-CSF direction was low and rather homogeneous, CSF-to-blood fluxes were much greater and somewhat more variable between preparations from individual animals. In most preparations, steady-state Piflux was achieved within 30 min after the addition of 33P
i, and, although typical experiments lasted only 2 h, the tissues maintained stable transport rates for at least 4 h (data not shown). The magnitude of the fluxes in the CSF-to-blood direction averaged approximately eight times that measured in the opposite direction, but, in some cases, flux ratios of up to 30:1 were observed. The two halves of the same fourth CP generally had very similar TER; however, prepara-tions from different individuals varied somewhat more (86.6⫾ 17.9⍀·cm2for the tissues shown in Fig. 1).
The transport properties of the prominent members of Slc34 and Slc20 in the gut and renal tubule have been determined in heterologous expression systems (see Ref. 36). Three members of the Slc34 family, NaPiIIa and NaPiIIc in the renal proximal tubule and NaPiIIb in the duodenum and jejunum, together with two members of the Slc20 family, PiT1 and PiT2, have been compared. These reported functional properties were used here to partially characterize the CP active Pitransport process.
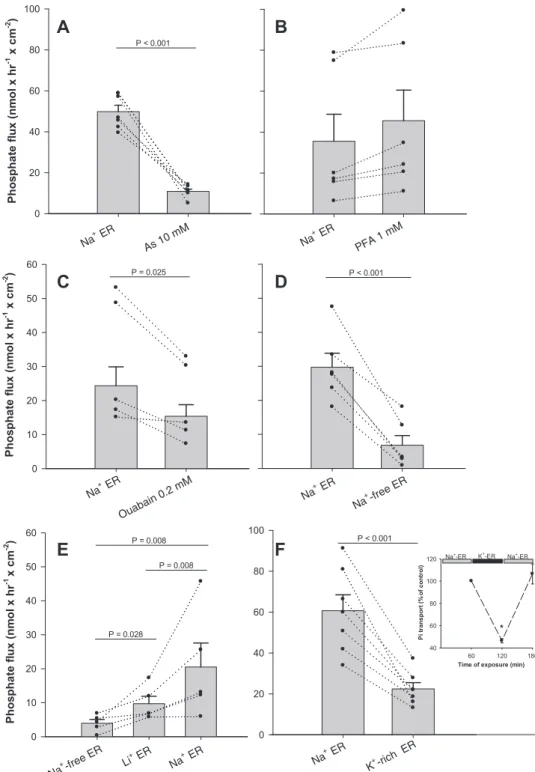
Effects of arsenate and PFA. Incubation of tissues with the Pi mimetic arsenate (10 mM) for 60 min clearly reduced Pi transport across the CP (Fig. 2A). Fluxes were reduced from 49.9⫾ 3.10 to 10.9 ⫾ 1.11 nmol·h⫺1·cm⫺2, roughly a fivefold reduction, but no significant change was observed in TER (71.0⫾ 4.77 and 66.3 ⫾ 5.45 ⍀·cm2for control and arsenate-treated periods, respectively). Treatment with PFA, however, had no significant effect on Pi transport (Fig. 2B) or TER. During the control and PFA treatment periods, mean fluxes and TER were 35.5 ⫾ 13.21 nmol·h⫺1·cm⫺2 and 77.4 ⫾ 13.91 ⍀·cm2 and 45.5 ⫾ 14.96 nmol·h⫺1·cm⫺2 and 79.0 ⫾ 13.54 ⍀·cm2, respectively. In our laboratory, 1 mM PFA strongly inhibited Pi uptake by mouse renal proximal tubule primary cultures (30) (56.4⫾ 1.73% of control, n ⫽ 3), confirming the observations of others on the effectiveness of PFA in a tissue where NaPiIIa transport predominates.
Na⫹/Li⫹-dependent Pitransport. Treatment of tissues with
0.2 mM ouabain induced a 1.5-fold reduction in Piflux (Fig. 2C), but the Na⫹-K⫹-ATPase inhibitor had no effect on tissue
TER, which was 77.0⫾ 14.64 ⍀·cm2after 60 min in regular ER solution and 80.6 ⫾ 16.94 ⍀·cm2 after 60 min in ER solution containing ouabain. In another set of tissues, substi-tution of regular ER solution with Na⫹-free ER solution greatly reduced Pitransport from CSF to the blood side (Fig. 2D). In this series of measurements, average Pi transport in Na⫹-free ER solution (6.8 ⫾ 2.82 nmol·h⫺1·cm⫺2) was roughly 4.5-fold lower than in regular ER solution (29.7 ⫾ 4.12 nmol·h⫺1·cm⫺2), which was accompanied by significantly different (P ⬎ 0.004) TER, with recorded mean values of 56.4 ⫾ 5.70 and 126.6 ⫾ 17.56 ⍀·cm2for ER and Na⫹-free ER solutions, respectively.
Substitution of Li⫹for all of the N-methyl-D-glucamine⫹in Na⫹-free ER solution (Li⫹-ER solution) induced a significant 2.5-fold increase in Pitransport by tissues previously incubated in Na⫹-free ER solution (from 3.9 ⫾ 1.11 to 9.7 ⫾ 2.18 nmol·h⫺1·cm⫺2). When Li⫹-ER solution was replaced with regular Na⫹-containing ER solution, the Pi flux further
in-Time (hrs) 0,0 0,5 1,0 1,5 2,0 Re ab so rp tive (CSF t o B L ) Pi fl ux (n m ol x h -1 x cm -2 ) -60 -50 -40 -30 -20 -10 0 S ecr et or y (B L t o CSF ) P i fl ux (n m ol x h -1 x cm -2 ) 0 10 20 30
Fig. 1. Representative data showing the unidirectional [secretory: blood (BL) to cerebrospinal fluid (CSF) and reabsorptive: CSF to BL] transport (solid triangles) and net transepithelial transport (gray circles) of radiolabeled Piby the shark fourth (IVth) choroid plexus (CP) mounted in Ussing chambers and short circuited, i.e., elasmobranch Ringer (ER) solution was on both sides, and transepithelial potential difference was clamped at zero.33P
iwas added at time
0, and steady-state flux was usually reached within 30 – 60 min. Data points are
means⫾ SE; n ⫽ 4. Table 3. Comparison of the ionic composition of serum and
cerebrospinal fluid in the spiny dogfish
Component Serum Cerebrospinal Fluid
Major cations Sodium 270⫾ 3.8 275⫾ 4.5 Potassium 2.7⫾ 0.36 2.7⫾ 0.10 Magnesium 1.4⫾ 0.15 1.6⫾ 0.13 Calcium 5.2⫾ 0.17 5.2⫾ 0.12 Major anions Chloride 240⫾ 5.2 254⫾ 2.9† Phosphate 1.3⫾ 0.33 0.6⫾ 0.11* Sulfate 0.5⫾ 0.20 0.4⫾ 0.16
Values (in mM) are means⫾ SE; n ⫽ 6–8. Significant differences from serum at *P⬍ 0.05 and †P ⬍ 0.001, respectively.
creased to 20.5 ⫾ 7.06 nmol·h⫺1·cm⫺2, more than twice that observed in Li⫹-ER solution and about five times higher than in Na⫹-free ER solution (Fig. 2E). TERs in these tissues averaged 139.9 ⫾ 19.74 ⍀·cm2 in Na⫹-free ER solution, 93.0 ⫾ 20.34 ⍀·cm2 in Li⫹-ER solution, and 70.8 ⫾ 20.50 ⍀·cm2 in regular ER solution. The differences among treat-ments were all statistically significant on a paired basis (P ⬍ 0.001).
K⫹ gradient dependence. Substitution of ER solution with
K⫹-rich ER solution (⬃100 mM K⫹) resulted in an approxi-mately threefold decrease in the Pitransport rate (Fig. 2F). These changes (from 60.7⫾ 7.77 to 22.5 ⫾ 3.05 nmol·h⫺1·cm⫺2) were
not caused by changes in TER, which averaged 48.7⫾ 3.35 and 43.0 ⫾ 3.42 ⍀·cm2 for ER and K⫹-rich ER solutions, respec-tively. In experiments aimed to evaluate the reversibility of this effect, when K⫹-rich ER solution was removed and tissues were incubated with regular ER solution again for an additional 60 min, the Piflux recovered to the initial level (see Fig. 2F, inset). K⫹ was increased by substituting 100 mM K⫹for 100 mM Na⫹, and it should be noted that the remaining Na⫹ of 180 mM is well above the saturating concentration for mammalian PiT2 expressed in Xenopus oocytes (26).
Pitransporter expression and localization. Data “mining” of
the MDIBL S. acanthias expressed sequence tag database 0 10 20 30 40 50 60 P hos pha te fl ux (n m ol x hr -1 x cm -2 ) P = 0.025 P < 0.001 0 20 40 60 80 100 P < 0.001
Time of exposure (min) 60 120 180 P i tr an sp or t (% o f c ontr ol ) 40 60 80 100 120 Na+-ER K+ -ER Na+-ER * 0 10 20 30 40 50 60 P ho sph at e fl ux (n m ol x hr -1 x c m -2 ) P = 0.008 P = 0.008 P = 0.028 0 20 40 60 80 100 P hos pha te fl ux (n m ol x h r -1 x cm -2) P < 0.001
A
F
E
D
C
B
Fig. 2. Effects of two classical inhibitors of Pi transport and treatments altering Na⫹and K⫹ plasma membrane gradients on net transepi-thelial transport across the isolated shark IVth CP. A: tissues were exposed (on both CSF and BL sides) to standard ER solution for 60 min and then to the same solution containing sodium arsenate for another 60 min (n ⫽ 6). B: in a similar experiment, tissues initially exposed to ER solution for 60 min were subsequently treated with 1 mM phosphonoformic acid (PFA; n⫽ 6). C: tis-sues were exposed (on both CSF and BL sides) to standard Na⫹-containing ER solu-tion for 60 min with a subsequent exposure to the same solution containing 0.2 mM ouabain (n ⫽ 6). D: tissues were bathed in Na⫹ -containing ER solution for 60 min followed by an exposure to Na⫹-free ER solution for 60 min (n⫽ 6). E: Pitransport by the isolated shark IVth CP exposed (on both CSF and BL sides) to Na⫹-free ER soltuion (with 280 mM
N-methyl-D-glucamine) for 60 min, to Li⫹
-containing ER solution (280 mM LiCl) for 60 min, and then to standard Na⫹-containing ER solution (280 mM NaCl) for another 60 min (n⫽ 5). F: the shark IVth CP was exposed (on both CSF and BL sides) to standard ER solution for 60 min and then to K⫹-enriched ER solution (100 mM KCl substituted for 100 mM NaCl) for another 60 min (n⫽ 7).
Inset: plot demonstrating that the tissue
trans-port capability was not permanently compro-mised by high K⫹ (n ⫽ 4). *Significantly different from control (P⬍ 0.01). Data are means ⫾ SE. Solid circles connected by dotted lines show changes in transport rates for individual preparations before and after exposure to the respective solution.
(DeCypher.MDIBL.org) identified several partial DNA se-quences that showed considerable conservation with zebrafish (Danio rerio, NP_997753, NP_998344 and NP_001071014), green pufferfish (Tetraodon negroviridis, CAG08601), African clawed frogs (Xenopus laevis, NP_001083287 and NP_ 001088186), rats (R. norvegicus, NP_112410 and NP_058919), and humans (Homo sapiens, NP_005406 and NP_006740.1) PiT1 and PiT2 proteins. Two of these sequences corresponded to 76 (PiT1) and 100 (PiT2) amino acids in a very conserved region near the NH2-terminus, encompassing the extracellular domain and first and second transmembrane domains, the first (intra-cellular) loop and extending into part of the second (extracel-lular) loop (PiT1), and the third transmembrane domain (PiT2). These sequences shared 72% nucleotide and 82% protein identity and cluster differently with PiT1 and PiT2. A third fragment was found with a high correspondence to a 232-amino acid region that spans from approximately half of the seventh loop (intracellular) to the tenth loop (extracellular), thus comprising transmembrane domains seven, eight, and nine. This sequence shared considerably higher identity with the amino acid sequence of PiT1 than of PiT2 in X. laevis (72% vs. 60%), R. norvegicus (84% vs. 59%), and H. sapiens (86% vs. 59%).
Partial DNA sequences for S. acanthias NaPiIIb (Slc34A2) can be found in the GenBank database, named as NaPiIIb1 and NaPiIIb2. These correspond to protein fragments of 230 and 290 amino acids, spanning from the end of the fourth to the beginning of the tenth transmembrane domains. The dogfish NaPiIIb1 fragment shares 66% identity with NaPiIIb2 and 59% with rat NaPiIIa (Slc34A1) and 68% with rat NaPiIIb equiva-lent regions, whereas the dogfish NaPiIIb2 fragment shares 65% identity with rat NaPiIIa and 66% with rat NaPiIIb.
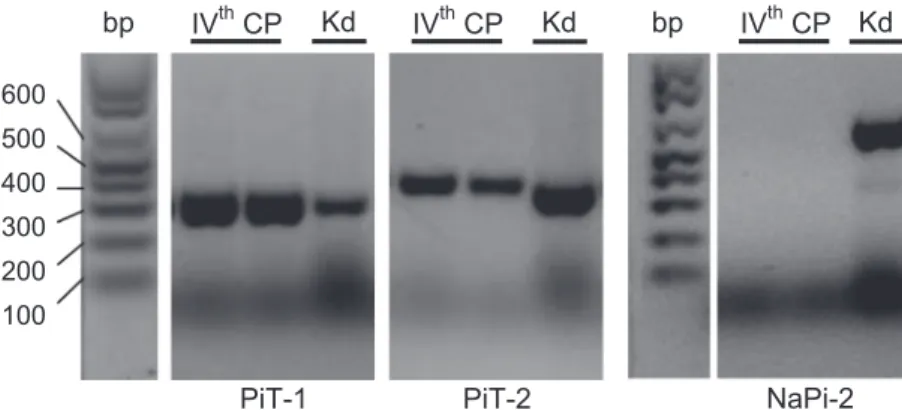
Electrophoresis of RT-PCR products obtained using PiT1-or PiT2-specific primers (Table 2) showed bands of the ex-pected size in the shark fourth CP as well as in the shark kidney (used as a positive control tissue; Fig. 3). For the RT-PCR performed using degenerate primers for NaPiII (these were designed for regions with high homology between the Na-PiIIb1 and NaPiIIb2 shark sequences to detect the presence of either or both mRNA types), no bands appeared in lanes corresponding to the CP, but bands of the expected size were present for products obtained with shark kidney cDNA.
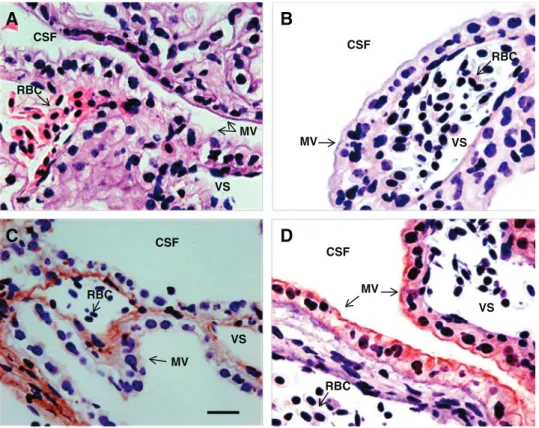
Immunohistochemical analyses of PiT1 and PiT2 in the shark fourth CP are shown in Fig. 4. The presence of nucleated red blood cells in the vascular spaces helped to locate endo-thelial cells, which have flattened nuclei compared with the CP
epithelium (Fig. 4A). Immunostaining revealed that PiT1 was located predominantly in vascular endothelial cells, although a weak signal may be in the basolateral membranes of the CP epithelium (Fig. 4C). There was no indication of PiT1 in the microvilli of the ventricular surface. The PiT1 subcellular location within the highly attenuated endothelial cells was not resolvable.
PiT2 immunostaining revealed a very clear localization of PiT2 in the shark CP epithelium (Fig. 4D). The strongest PiT2 signal was in the microvilli of the ventricular surface, although weak staining in the basolateral membranes and cytosol could not be ruled out. There was no indication of PiT2 staining in any other part of the CP. Localization of PiT2 immunostaining was the same in the rat lateral CP as in the shark CP (Fig. 5). Staining in the apical microvilli (Fig. 5A) was absent in the presence of the blocking peptide (Fig. 5D).
Shark and rat lateral CP and shark fourth CP immunoblots are shown in Fig. 6. Lanes 1 and 2 show that anti-human and anti-rat PiT2 antibodies worked equally well to reveal a distinct single band at 72 kDa in the shark fourth CP, which corre-sponds to the expected mass based on the amino acid sequence for rat PiT2. Lanes 2 and 3 show that the shark fourth CP and shark lateral CP had the same PiT2 signal. Lanes 4 and 5 show that the anti-rat PiT2 antibody worked equally well in shark and rat CPs. Lanes 6 and 7 confirmed the effectiveness of the blocking peptide used for immunolocalization of the PiT2 signal in the rat CP shown in Fig. 5. The presence of a band corresponding to-actin (of ⬃42 kDa) was also identified in these samples and used as a relative internal standard to control for the integrity of the protein extracts.
DISCUSSION
[Pi]CSFof the dogfish shark was consistently lower than that of serum, and [Cl⫺] in CSF was higher than in serum. These characteristics are also normal in mammals, including humans (4, 16). The values reported here for the inorganic ion concen-trations in spiny dogfish CSF are in agreement with previously reported measurements (12); however, this seems to be the first determination of [Pi] and [SO42⫺] in S. acanthias CSF. Con-sidering the phylogenetic distance, the relationships between the concentrations of Cl⫺1and phosphate in plasma and CSF are apparently very highly conserved.
The potent active transepithelial transport process in the CP described above likely participates in maintaining the lower [Pi]CSF. The advantageous anatomic arrangement of the fourth
600 500 400 300 200 100 IVthCP Kd IVthCP Kd IVthCP Kd
PiT-1 PiT-2 NaPi-2
bp bp
Fig. 3. Gene expression of Pitransporter (PiT)1 and PiT2 (Slc20) and Na⫹-Picotransporter type IIb [NaPiIIb (NaPi-2);
Slc34] in the spiny dogfish shark. A representative agarose gel
is shown loaded with equal amounts of RT-PCR products from RNA extracted from the IVth shark CP and dogfish shark kidney (Kd). There was no expression of NaPiIIb in the IVth CP. No bands were detected when the reactions were run without the RT step.
ventricle and CP of the spiny dogfish shark as well as its suitability for Ussing chamber work make the determination of active Pi transport relatively certain. With the CP epithelia chemically and electrically short circuited, the Pi flux ratios were as high as 30:1. The in vitro transepithelial potential was about⫹1 mV, ventricular side positive, with identical, protein-free ER solution on each side. This is consistent with the earlier measurements of⫹2 to ⫹4 mV also done in Ussing chambers (23). The mammalian transepithelial potential determined in vivo is also⫹2 to ⫹7 mV, CSF side positive (14).
Several of the criteria we used to categorize the active Pi transport process were based on heterologous expression sys-tems for SLC20 and SLC34 gene families (36). The five Pitransporters known to participate in Piuptake by mammalian tissues capable of transepithelial Pi transport are PiT1, PiT2,
NaPiIIa, NaPiIIb, and NaPiIIc. Distinctive features include the following: 1) all are Na⫹symporters and competitively inhib-ited by arsenate; 2) PFA blocks NaPiII types much more effectively than PiT types; 3) only NaPiIIc is electroneutral; 4) Li⫹, in the complete absence of Na⫹(2), can drive transport on the PiT types but not NaPiII types; and 5) PiT-type proteins preferentially transport the monovalent form H2PO4⫺, whereas NaPiII type proteins all preferentially transport HPO42⫺.
Arsenate is commonly used to inhibit Pi transport in numerous assays (see Ref. 32) and, as a Pianalog, interacts relatively effectively with NaPiIIa, NaPiIIb, and NaPiIIc as well as with PiT1 and PiT2, but with much lower affinity than Pi. Although TER was unchanged by arsenate treat-ment, general metabolic effects may have contributed to the inhibition of transport; nevertheless, the arsenate effect
A
B
C
D
RBC CSF CSF CSF CSF VS RBC MV VS RBC MV VS RBC MV VS MVFig. 4. Immunohistochemistry of paraffin-em-bedded spiny dogfish shark CPs. A: hematox-ylin and eosin stain. B: isotype for PiT1 and PiT2 showing no nonspecific staining. C: PiT1 (1:1,600) showing light staining in the vas-cular endothelium. D: PiT2 (1:1,000) showed heavier staining localized to the apical mem-brane region. CSF, ventricular location of CSF; RBC, nucleated shark red blood cells; MV, microvilli of apical surface; VS, intra-vascular space. Scale bar⫽ 25 m.
A
B
C
D
MV CSF RBC CSF RBC MV CSF CSF MV RBC RBC MVFig. 5. Immunohistochemistry of parafifin-embedded rat lateral CPs. A: hematoxylin and eosin stain. B: isotype control for goat non-immune IgG. C: rat lateral CP stained with goat anti-human PiT2 antibody. D: rat lateral CP stained with goat human PiT2 anti-body in the presence of blocking antigen. Scale bar⫽ 25 m.
observed was consistent with facilitation of Pi transport by specific transporters.
The active transepithelial transport reported here was dra-matically, and reversibly, influenced by the cellular K⫹ gradi-ent, consistent with a reversible plasma membrane depolariza-tion and arguing against electroneutral transport (NaPiIIc-like). The lack of effect of PFA at 1 mM on net Pitransport by the CP is consistent with PiT-type transport and the fact that we detected no NaPiII gene expression there. Phosphonocarboxy-lic acids, including PFA, are effective inhibitors of Piuptake by renal brush-border membrane vesicles (26, 39), where NaPiII transporters predominate; however, they have no effect on PiT1 or PiT2 when these transporters are overexpressed in oocytes (26) or in vascular smooth muscle cells at 1 mM and inhibited only 47% even at 10 mM (31).
Early work showed no significant driving ability by a Li⫹ gradient on NaPiII (3, 36), and although more recent work has indicated that Li⫹does appear to have a very low potential to drive NaPiII phosphate transport, this cation interacts much more readily with PiT types than with NaPiII types. Work on rat vascular smooth muscle PiT1 and PiT2 has indicated that Li⫹will support⬃5% of the PiT1 phosphate transport capacity seen with normal [Na⫹] and⬃12% of PiT2 transport (31). In the present study, Li⫹, in the complete absence of Na⫹, drove almost one-half of Na⫹-dependent phosphate transport, adding support for a significant role of PiT types in CP active Pi transport.
The degenerate primers used for the detection of NaPiIIb isoforms, the only known type II transporters in the shark, gave no evidence that these genes were expressed in the CP even though a strong signal was present in kidney samples. This does not rule out the presence of type II transporters in the CP, but it is consistent with the PiT-like transport data. Further-more, immunolocalization indicated that PiT2 is appropriately positioned in the tissue to move Piin the CSF-to-blood direc-tion. The extent of heterologous antibody specificity and un-known tissue-specific antigenicity notwithstanding, there is a high degree of sequence conservancy in PiT2 across phyla, and, together with the PCR gene expression data, the present
findings strongly indicate that the molecular correlate of trans-epithelial Pi transport by CP is PiT2.
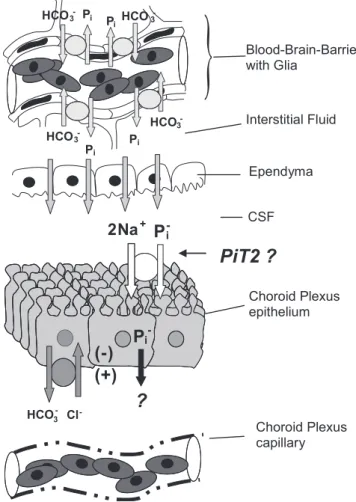
It is possible that part of the control of [Pi]CSFmay reside in the BBB. An anion exchange process in the BBB (or associated glia) may have an important contribution to the buffering capacity of the extracellular compartment of the brain (24), and studies (9, 10) on isolated BBB capillaries revealed a Pi/HCO3⫺ exchange process. The influence of the BBB on [Pi] in ISF could impact CSF through drainage of ISF across the ependy-mal lining of the ventricles. A hypothetical model incorporat-ing a possible source (BBB via the ISF) and exit pathway for Piis shown in Fig. 7.
The overall structure of the Pi-transporting motif in the ubiquitously expressed SLC20 family has remained virtually unchanged during evolution, leading to the idea that PiTs generally fulfill housekeeping roles in cellular Pihomeostasis (7). There is also evidence for specific functional roles in bone mineralization and cell proliferation (PiT1) as well as [Pi ]-sensitive and pH-]-sensitive renal reabsorption (PiT2) (18). In-terestingly, the modification of PiT2 caused by changing [Pi] seems to be independent of its transport capability and suggests an involvement in Pi sensing (29). Blood-Brain-Barrier with Glia Interstitial Fluid Ependyma CSF Choroid Plexus epithelium Choroid Plexus capillary
}
Pi HCO3 -Pi Pi Pi HCO3 -HCO3 -HCO3 -3 -2Na+P
-iP
i-(-)
(+)
-Cl HCOPiT2 ?
?
Fig. 7. The tissues that form and define CSF are shown in this hypothetical model of Pientry and exit. Pimay enter interstitial fluid via the blood-brain barrier in exchange for HCO3⫺(9). The interstitial fluid presumably mixes with CSF by bulk flow through the ependymal lining of the ventricles, which generally lack tight junctions, adding Pi to CSF. The CP epithelium is hypothesized to use PiT2 in the apical microvilli to actively transport Piinto the cell and then to the CP interstitium, by unknown processes, where it is carried away by the highly fenestrated CP capillaries.
Fig. 6. A representative immunoblot of PiT2 in the dogfish IVth CP and lateral CP and rat lateral CP. The single band at⬃70 kDa (top) was coincident with the published PiT2 protein amino acid sequence in the rat. The lower band (bottom) indicates the presence of -actin (⬇42 kDa). Bands were made visible using either goat anti-rabbit peroxidase-conjugated secondary antibody (lanes 1–5) or donkey anti-goat peroxidase-conjugated secondary antibody (lanes 6 and 7). Lane 1, shark IVth CP stained with rabbit anti-human antibody HPA026540 (Sigma); lanes 2 and 3, shark IVth CP and shark lateral CP, respectively, stained with rabbit anti-rat antibody (gift of Dr. Sorribas);
lanes 4 and 5, shark and rat lateral CPs, respectively, stained with rabbit
anti-rat antibody (gift of Dr. Sorribas); lanes 6 and 7, rat lateral CPs stained with goat anti-human antibody (Santa Cruz Biotechnology) in the presence and absence of blocking antigen, respectively.
Perspectives. Because of the role of Pi in vital cellular activities, perturbation of [Pi]CSFmay have notable physiolog-ical consequences, such as energy stress, an important patho-genic consequence in many neurodegenerative diseases (19). Low [Pi] can cause membrane fragility and central nervous system dysfunction (18), whereas high [Pi] in the extracellular fluid can stimulate an increased expression of PiT1 and PiT2, which may be related to increased calcium phosphate deposi-tion in soft tissues (38), including the basal ganglia, where mutations in SCL20A2 are linked to disturbed regional phos-phate homeostasis (Fahr disease) (37). On the other hand, after excitotoxicity or oxidative stress, high extracellular Pi in-creases neuronal survival (13). Understanding the mechanisms responsible for the control of [Pi]CSF could have significance beyond immediate metabolic status of neurons and glia. The acid-base buffering capacity of CSF, for example, is minimal, and at the pH of CSF, Pi is a nearly ideal buffer system; therefore, keeping [Pi]CSF low may help maintain a high sensitivity to small shifts in CO2 and [HCO3⫺] in CSF. In humans, a downward shift of CSF pH by only 0.05 units can cause a 10-fold increase in breathing rate (27). Another pH-related implication of regulation by PiT2 is that the H2PO4⫺ substrate availability will be significantly impacted by small shifts in CSF pH. Whether one considers shark CSF, with a pH of⬃7.8 and [Pi] of 0.6 mM, or mammalian CSF, with a pH of ⬃7.2 and [Pi] of 0.4 mM, [H2PO4⫺] is in the range of 50 – 60 M and is not far from the PiKmof PiT2 reported for rats (25 M), mice (38 M), and humans (K0.5⬃160 M) (see Ref. 6). Finally, in vivo experiments in rats have indicated that changes in [Pi]CSF may have rapid and dramatic effects on renal Pi excretion and on Piappetite (21). Thus, the process we describe here for the removal of CSF Pimay be an important aspect of Pi, and Ca2⫹, homeostasis. Whereas a specific Ca2⫹-sensing receptor has been identified, and its roles in the maintenance of stable systemic Ca2⫹ levels and in hormone secretion have been well characterized, a similar Pi-sensing mechanism has not been described. Changes in [Pi] can produce changes in PiT2 activity that seem to be due to structural changes, not the amount of PiT2 in the membrane (28). The active state of PiT2 is reported to involve assembly of oligomers in response to extracellular Pideprivation. In a bone cell line, this heightened activity can increase intracellular [Pi] and decrease cAMP (22). PiT2 activity is also modulated by PKC-ε (17). Thus, choroidal epithelial PiT2 could be part of a Pi-sensing/regulatory path-way analogous to the signaling axis proposed for intestinal phosphate modulation of renal Pireabsorption (5).
ACKNOWLEDGMENTS
The authors gratefully acknowledge the assistance of Michelle Bailey with animal care and maintenance, Alice R. Villalobos and Robin K. Young for advice and use of equipment, and Denise Long for troubleshooting the immunohistochemical analyses.
GRANTS
This work was supported by National Science Foundation Grant 0843253 and Fundação para a Ciência e a Tecnologia, Portugal.
REFERENCES
1. Abbott NJ. Evidence for bulk flow of brain interstitial fluid: significance for physiology and pathology. Neurochem Int 45: 545–552, 2004. 2. Andrini O, Meinild AK, Ghezzi C, Murer H, Forster IC. Lithium
interactions with Na⫹-coupled inorganic phosphate cotransporters:
in-sights into the mechanism of sequential cation binding. Am J Physiol Cell
Physiol 302: C539 –C554, 2012.
3. Bacconi A, Virkki LV, Biber Murer H Jr, Forster IC. Renouncing electroneutrality is not free of charge: switching on electrogenicity in a Na⫹-coupled phosphate cotransporter. Proc Natl Acad Sci USA 102: 12606 –12611, 2005.
4. Barshes N, Demopoulos A, Engelhard HH. Anatomy and physiology of the leptomeninges and CSF space. Cancer Treat Res 125: 1–16, 2005. 5. Berndt T, Thomas LF, Craig TA, Sommer S, Li X, Bergstralh EJ,
Kumar R. Evidence for a signaling axis by which intestinal phosphate rapidly modulates renal phosphate reabsorption. Proc Natl Acad Sci USA 104: 11085–11090, 2007.
6. Bøttger P, Hede SE, Grunnet M, Høyer B, Klaerke DA, Pedersen L. Characterization of transport mechanisms and determinants critical for Na⫹-dependent Pisymport of the PiT family paralogs human PiT1 and PiT2. Am J Physiol Cell Physiol 291: C1377–C1387, 2006.
7. Bøttger P, Pedersen L. Evolutionary and experimental analyses of inorganic phosphate transporter PiT family reveals two related signature sequences harboring highly conserved aspartic acids critical for sodium-dependent phosphate transport function of human PiT2. FEBS J 272: 3060 –3074, 2005.
8. Brazy PC, Gullans SR, Mandel LJ, Dennis VW. Metabolic requirement for inorganic phosphate by the rabbit proximal tubule. J Clin Invest 70: 53–62, 1982.
9. Dallaire L, Beliveau R. Phosphate transport by capillaries of the blood-brain barrier. J Biol Chem 267: 22323–22327, 1992.
10. Dallaire L, Giroux S, Beliveau R. Regulation of phosphate transport by second messengers in capillaries of ythe blood-brain barrier. Biochim
Biophys Acta 1110: 59 –64, 1992.
11. Fishman RA. Cerebrospinal Fluid in Diseases of the Nervous System. Philadelphia, PA: Saunders, 1992, p. 431.
12. Gilbert PW, Mathewson RF, Rall DP. Sharks, Skates and Rays. Balti-more, MD: The Johns Hopkins Press, 1967, p. 624.
13. Glinn M, Ni B, Irwin RP, Kelley SW, Lin SZ, Paul SM. Inorganic Pi increases neuronal survival in the acute early phase following excitotoxic/ oxidative insults. J Neurochem 70: 1850 –1858, 1998.
14. Held D, Fencl V, Pappenheimer JR. Electrical potential of cerebrospinal fluid. J Neurophysiol 27: 942–959, 1964.
15. Javaheri S, Weyne J, Demeester G, Leusen I. Effects of acetazolamide on ionic composition of cisternal fluid during acute respiratory acidosis. J
Appl Physiol 57: 85–91, 1984.
16. Javaheri S, Weyne J, Demeester G, Leusen I. Effects of SITS, an anion transport blocker, on CSF ionic composition in metabolic alkalosis. J Appl
Physiol 57: 92–97, 1984.
17. Jobbagy Z, Olah Z, Petrovics G, Eiden MV, Leverett BD, Dean NM, Anderson WB. Up-regulation of the Pit-2 phosphate transporter/retrovi-rus receptor by protein kinase C epsilon. J Biol Chem 274: 7067–7071, 1999.
18. Khoshniat S, Bourgine A, Julien M, Weiss P, Guicheuxm Jr, Beck L. The emergence of phosphate as a specific signaling molecule in bone and other cell types in mammals. Cell Mol Life Sci 68: 205–218.
19. Mandemakers W, Morais VA, De Strooper B. A cell biological per-spective on mitochondrial dysfunction in Parkinson disease and other neurodegenerative diseases. J Cell Sci 120: 1707–1716, 2007.
20. Moody DM. The blood-brain barrier and blood-cerebral spinal fluid barrier. Semin Cardiothorac Vasc Anesth 10: 128 –131, 2006.
21. Mulroney SE, Woda CB, Halaihel N, Louie B, McDonnell K, Schulkin J, Haramati A, Levi M. Central control of renal sodium-phosphate (NaPi-2) transporters. Am J Physiol Renal Physiol 286: F647–F652, 2004. 22. Naviglio S, Spina A, Chiosi E, Fusco A, Illiano F, Pagano M, Romano M, Senatore G, Sorrentino A, Sorvillo L, Illiano G. Inorganic phosphate inhibits growth of human osteosarcoma U2OS cells via adenylate cyclase/ cAMP pathway. J Cell Biochem 98: 1584 –1596, 2006.
23. Patlak CSAR, Oppelt WW, Rall DP. Potential differences of the ven-tricular fluid in vivo and in vitro in the dogfish. Life Sci 5: 2011–2015, 1966.
24. Portman MA, Lassen NA, Cooper TG, Sills AM, Potchen EJ. Intra-and extracellular pH of the brain in vivo studied by31P-NMR during hyper- and hypocapnia. J Appl Physiol 71: 2168 –2172, 1991.
25. Rall DP, Sheldon W. Transport of organic acid dyes by the isolated choroid plexus of the spiny dogfish, S. acanthias. Biochem Pharmacol 11: 169 –170, 1962.
26. Ravera S, Virkki LV, Murer H, Forster IC. Deciphering PiT transport kinetics and substrate specificity using electrophysiology and flux mea-surements. Am J Physiol Cell Physiol 293: C606 –C620, 2007. 27. Rhoades RA, Bell DR. Medical Physiology. Baltimore, MD: Lippincott,
Williams & Wilkins, 2013, p. 819.
28. Rodrigues P, Heard JM. Modulation of phosphate uptake and ampho-tropic murine leukemia virus entry by posttranslational modifications of PIT-2. J Virol 73: 3789 –3799, 1999.
29. Salaun C, Marechal V, Heard JM. Transport-deficient PiT2 phosphate transporters still modify cell surface oligomers structure in response to inorganic phosphate. J Mol Biol 340: 39 –47, 2004.
30. Terryn S, Jouret Fo, Vandenabeele F, Smolders I, Moreels M, De-vuyst O, Steels P, Kerkhove EV. A primary culture of mouse proximal tubular cells, established on collagen-coated membranes. Am J Physiol
Renal Physiol 293: F476 –F485, 2007.
31. Villa-Bellosta R, Bogaert YE, Levi M, Sorribas V. Characterization of phosphate transport in rat vascular smooth muscle cells. Arterioscler
Thromb Vasc Biol 27: 1030 –1036, 2007.
32. Villa-Bellosta R, Sorribas V. Arsenate transport by sodium/phosphate cotransporter type IIb. Toxicol Appl Pharmacol 247: 36 –40, 2010. 33. Villa-Bellosta R, Sorribas V. Different effects of arsenate and
phospho-noformate on Pi transport adaptation in opossum kidney cells. Am J
Physiol Cell Physiol 297: C516 –C525, 2009.
34. Villalobos ARA, Miller DS, Renfro JL. Transepithelial organic anion transport by shark choroid plexus. Am J Physiol Regul Integr Comp
Physiol 282: R1308 –R1316, 2002.
35. Villalobos ARA, Renfro JL. Trimethylamine oxide suppresses stress-induced alteration of organic anion transport in choroid plexus. J Exp Biol 210: 541–552, 2007.
36. Virkki LV, Biber J, Murer H, Forster IC. Phosphate transporters: a tale of two solute carrier families. Am J Physiol Renal Physiol 293: F643– F654, 2007.
37. Wang C, Li Y, Shi L, Ren J, Patti M, Wang T, de Oliveira JR, Sobrido MJ, Quintans B, Baquero M, Cui X, Zhang XY, Wang L, Xu H, Wang J, Yao J, Dai X, Liu J, Zhang L, Ma H, Gao Y, Ma X, Feng S, Liu M, Wang QK, Forster IC, Zhang X, Liu JY. Mutations in SLC20A2 link familial idiopathic basal ganglia calcification with phosphate homeostasis.
Nat Genet 44: 254 –256, 2012.
38. Wittrant Y, Bourgine A, Khoshniat S, Alliot-Licht B, Masson M, Gatius M, Rouillon T, Weiss P, Beck L, Guicheux J. Inorganic phos-phate regulates Glvr-1 and -2 expression: Role of calcium and ERK1/2.
Biochem Biophys Res Comm 381: 259 –263, 2009.
39. Yusufi ANK, Szczepanska-Konkel M, Kempson SA, McAteer JA,
Dousa TP. Inhibition of human renal epithelial Na⫹/Pi cotransport by