Contents lists available atScienceDirect
Energy Reports
journal homepage:www.elsevier.com/locate/egyr
Consumer energy management system with integration of smart
meters
R. Pereira
a,d, J. Figueiredo
a,b,∗, R. Melicio
a,b, V.M.F. Mendes
a,d, J. Martins
c, J.C. Quadrado
daCEM/IDMEC, Universidade Évora, R. Romão Ramalho, 59; 7000-671 Évora, Portugal bIDMEC, Instituto Superior Tecnico, Technical University of Lisbon; 1049-001 Lisboa, Portugal cCentre of Technology and Systems/FCT, Universidade Nova Lisboa; 2829-516 Caparicaç, Portugal
dISEL, Instituto Superior de Engenharia de Lisboa, Department of Electrical Engineering and Automation, R. Conselheiro Emídio Navarro, 1959-007 Lisbon, Portugal
a r t i c l e i n f o
Article history:
Received 18 September 2014 Received in revised form 17 October 2014 Accepted 29 October 2014 Available online 14 January 2015
a b s t r a c t
This paper develops an energy management system with integration of smart meters for electricity consumers in a smart grid context. The integration of two types of smart meters (SM) are developed: (i) consumer owned SM and (ii) distributor owned SM. The consumer owned SM runs over a wireless platform – ZigBee protocol and the distributor owned SM uses the wired environment – ModBus proto-col. The SM are connected to a SCADA system (Supervisory Control And Data Acquisition) that supervises a network of Programmable Logic Controllers (PLC). The SCADA system/PLC network integrates different types of information coming from several technologies present in modern buildings.
The developed control strategy implements a hierarchical cascade controller where inner loops are performed by local PLCs, and the outer loop is managed by a centralized SCADA system, which interacts with the entire local PLC network.
In order to implement advanced controllers, a communication channel was developed to allow the communication between the SCADA system and the MATLAB software.
©2014 The Authors. Published by Elsevier Ltd. This is an open access article under the CC BY-NC-ND license (http://creativecommons.org/licenses/by-nc-nd/4.0/).
1. Introduction
The power grid is an aggregation of several networks and mul-tiple generation companies which have different operators that use diverse levels of communication and coordination. The transi-tion from traditransi-tional power grid towards smart grid is a movement from a static to a flexible infrastructure with improved observabil-ity, controllability and efficiency (Vijayapriya and Kothari, 2011). Smart grid implies a smart generation, smart transmission, smart storage and smart sensors.
Smart grid will promote a bidirectional flow of electric power and communication between consumers and suppliers, through-out the inclusion of information and communication technologies which contributes for the transformation of passive end-consumers into active players (Gangale et al., 2013).
∗Corresponding author at: CEM/IDMEC, Universidade Évora, R. Romão Ramalho, 59; 7000-671 Évora, Portugal.
E-mail address:[email protected](J. Figueiredo).
It is considered essential to comprehend and engage consumers to assume their new role as active participants in the electric-ity system in a successful way. This consumer engagement also depends on the characteristics of the Information and Communi-cation Technologies (ICT), which improvement is driven by con-sumers’ needs, interests and benefits. ICT will play a vital role in smart grid. The smart grid objectives will not be achieved with-out a parallel developing of complex ICT systems (Melvin, 2014). The communication infrastructure should be simple, robust, secure and flexible in order to allow monitoring, management, control and dispatching operations from distribution to consumers ( Vi-jayapriya and Kothari, 2011).
An intelligent smart home controller providing information about consumption patterns is useful to raise energy consumption awareness and to encourage consumers to real energy savings ( Vi-jayapriya and Kothari, 2011). Among available products for resi-dential end-user are smart appliances, smart meters and energy monitoring and control systems (Geelen et al., 2013).
Smart meters are digital electricity meters that accurately mea-sures both electricity consumption and production and commu-nicate this data to the energy supplier. These meters have the http://dx.doi.org/10.1016/j.egyr.2014.10.001
surements and energy prices to end-consumers (Simõeset al., 2012).
A smart meter system has several control devices, sensors to identify parameters and devices used to transfer data and com-mand signals. Smart meters applied into distribution grids will play a relevant role in monitoring the load energy usage characteris-tics and performance on the grid. The energy consumption data collected on a regular basis allows utility companies to efficiently manage electricity demand and to advise consumers to efficiently use their appliances (Krishnamurti et al.,2012;Depuru et al.,2011). The communication technologies employed in smart meters have to be cost efficient and must provide simultaneously a good transmission range, enhanced signal-security characteristics and improved bandwidth and power quality (Depuru et al., 2011).
There are basically two information infrastructure types needed for information flow in a smart grid system. The first flow is from electrical appliances and sensors to smart meters and the second is between smart meters and utilities’ data centers. It is considered that first data flow can be accomplished resorting to power line or wireless communications such as ZigBee, 6LowPAN, Z-wave, among others (Güngör et al., 2011). The second information data flow can be accomplished resorting to cellular technologies or Internet.
In this paper, emphasis is given to the smart technology which promotes the interface between the Portuguese power grid and Portuguese consumers of the InovGrid Project located in the city of Évora.
InovGrid is an innovator project which is based on a transfor-mation process towards a new technical platform for power grid control and management. At a technical level this project relies on third generation technologies to merge both communication and power grid networks.
The InovGrid reference technical architecture is based on a hier-archical structure, which performs simultaneously and separately technical and commercial management. The referred hierarchical structure has three levels: prosumer level, Medium–Low voltage (MV/LV) transformation level and data control and management level (Dias, 2010).
In prosumer level, energy boxes (EB) are implemented. The EB are smart meters that provide real consumption values as well as perform in-home energy management. In MV/LV transformation level, distribution transformer controllers (DTC) are implemented. DTCs allow load monitoring and power quality analysis. They manage the EBs, control the transformation station and control the public street lights. Finally, the data control and management level assembles the commercial information and performs the grid management.
This paper focuses on the prosumer level, as it is found to con-tribute clear and directly to consumers’ economical savings, thus developing the consumers’ awareness of the efficient use of elec-tricity. It develops the integration of two types of Smart Meters (SM): (i) consumer owned SM and (ii) distributor owned SM, in a SCADA system (Supervisory Control And Data Acquisition) that supervises a network of Programmable Logic Controllers (PLC) in order to optimize the electricity consumption. The SCADA sys-tem/PLC network integrates different types of information coming from the several technologies present in modern buildings—BAS (Building Automation Systems).
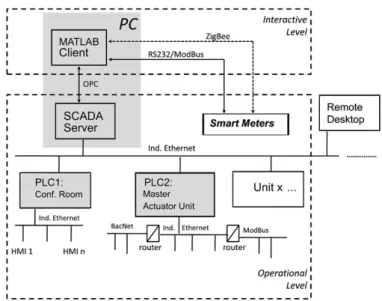
SCADA systems fit very well with hierarchical control (Silva et al., 2007; Figueiredo and Martins, 2010; Figueiredo and Sá da Costa, 2008). The present work follows the advanced con-trol structure composed by two inter-related levels: the Opera-tional level(SCADA system) and theInteractive levelthat optimize the preferences of the building users in relation to control refer-ences (Figueiredo and Sá da Costa, 2012).Fig. 1shows the infor-mation flux defined in this strategy.
At theOperational levelthe operations are performed by dis-tributed PLCs. The communication flow between the SCADA sys-tem and the distributed PLCs is performed on an Ethernet bus. This main communication network allows also the use of other common networks widely used in lower operational levels of BAS (Neumann, 2007), namely: ModBushttp://www.modbus.org/,
Bac-Nethttp://www.bacnet.org/and LonWorkshttp://www.echelon.
com/lonworks. The integration of these lower level communica-tion structures in the developed strategy follows a vertical in-tegrated approach with the use of routers, as it was previously illustrated inFig. 1.
The two types of smart meters here studied characterize the 2 common standards in the smart consumer environment (con-sumer owned SM and distributor owned SM). The con(con-sumer owned SM runs over a wireless platform – ZigBee protocol and the distributor owned SM uses the wired environment – ModBus pro-tocol.
The concept here developed for building automation allows multi-users to interact with the building control unit, which has an intelligent controller with time-varying references that accommodates advanced strategies of control.
2.1. Consumer owned smart meters
The consumer owned SM are simple devices that are mainly composed of a sensor unit and a mobile display, and run usually over a wireless network, thus suitable for domestic purposes. The main purpose of these devices is to supply simple data to support the consuming pattern of consumers.
In this paper a typical SM is developed with double inter-face for mobile displays and SCADA systems. It uses the ZigBee protocol which is suitable for small distances, typical for domes-tic environments. The used hardware is based on Arduino plat-formhttp://www.arduino.cc/en/main/software.
2.2. Distributor owned smart meters
Fig. 1. Two-level supervisory control architecture.
This type of SM is now beginning to appear in specific envi-ronments selected by the electricity national distributors, in order to gain experience with the new hardware and software, allowing the correction of technical problems before its deployment in large scale consumer areas. In Portugal, the EDP distributor selected the city of Evora, with ca. 50,000 inhabitants to install these SM. This pilot, named Evora InovGrid, was completely implemented in 2010 (EDP Distribuicao, 2011). These installed SM can be con-nected to specific displays, also supplied by the distributor, under the payment of a monthly fee.
2.3. Supervisory control strategy
The presented strategy follows the advanced control structure composed by two inter-related levels: theOperational level(SCADA system) and theInteractive levelthat optimize the preferences of the building users in relation to control references (Figueiredo and Sá da Costa, 2012).
TheOperational-levelcontroller developed in this paper is com-monly known as a hierarchical cascade controller which integrates a first control loop (inner loop) managed by local PLCs and a sec-ond control loop (outer loop) controlled by a SCADA system.Fig. 2 shows the developedOperational Level—SCADA supervisory con-trol.
The input functions of the SCADA supervisory loop are men-tioned as comfort laws (F1(t), . . . , Fj(t)). These comfort laws must observe criteria of human health, system security and energy ef-ficiency and are supplied by the 2nd level control structure—
Interactive level(Fig. 1). ObservingFig. 1it can be seen that the
Operational Level(SCADA supervisory control) receives the main references (comfort laws) from theInteractive Level, which devel-ops these comfort laws considering the inhabitants’ preferences and the measured variables (e.g. temperature, luminosity, electric-ity consumption supplied by the smart meters) according to a de-veloped optimization criterion, which defines the input references to the Master Actuator System (MAS). This criterion optimizes the inhabitants’ preferences constrained by the available resources. On the other hand, theOperational Levelsupplies all the necessary data (inputs/outputs) to theInteractive Level, through the SCADA plat-form (Fig. 1).
In the developedOperational Levela network of distributed PLCs manages a set of distributed sensors and actuators (temperature, luminosity, HVAC, etc.) and all this distributed information is supplied to the SCADA system.
Fig. 2. Operational level controller.
3. System development
In this section the main focus is on the development of the interface for the smart meters to integrate the energy management system. A quick summary of the energy management system with a Model-based Predictive Controller (MPC) (Maciejowski, 2002) is here presented. A detailed explanation of the design of this high performance controller can be found in a previous work from the authors (Figueiredo and Sá da Costa, 2012).
3.1. Development of the interactive level controller
Considering a general MIMO system (multiple input, multiple output), withnuinputs andnyoutputs, it can be described in the state-space formulation, as:
xk+1
=
A·
xk+
Bu·
uk+
Bv·
ν
k+
Bd·
dk (1)ykm
=
Cm·
xk+
Cvm·
v
k+
Ddm·
dk (2)yk
u
=
Cu·
xk+
Dvu·
v
k+
Ddu·
dk+
Duu·
uk (3)where:
u
=
controllable input;ν
=
measured perturbations vector;d
=
non-measured perturbations vector;ym
=
measured output vector;yu
=
non-measured output vector;k
=
sample time.
Referring now the specific problem of temperature controlling in buildings, one developed a mathematical model, adjusted to each building floor (each floor has its own linear model). This mathematical model was derived from the simple SISO model of a thermal system with a thermal source, a thermal capacitance and a thermal resistance:
˙
T
(
t)
=
1C
qi
(
t)
−
1R
(
T(
t)
−
Te(t))
(4)
where:
T
=
room temperature;C
=
room thermal capacitance(mainly dependent on room geometry and air pressure);
R
=
room thermal resistance(mainly dependent on wall properties);
Te
=
external temperature;qi
=
heat flow(
dependent on Sun received radiation,
presence of machinery and people, AC devices, etc.).
Expanding this model for a complete building floor, with several rooms, with specific characteristics (Ti,Ci,Ri,qi,Tei), one obtained the state-space model:
˙
T1..
.
˙
Ti..
.
˙
Tn
=
−1
/
C1R1 0· · ·
0 0..
.
..
.
· · ·
..
.
..
.
0
· · ·
−1
/
CiRi· · ·
0..
.
..
.
· · ·
..
.
..
.
0 0
· · ·
0−1
/
CnRn
T1..
.
Ti..
.
Tn
+
−1
/
C1..
.
−1
/
Ci..
.
−1
/
Cn
qAC1
..
.
qACi..
.
qACn
+
−1
/
C1R1..
.
−1
/
CiRi..
.
−1
/
CnRn
Te1
..
.
Tei..
.
Ten
yi..
.
yn
=
0
· · ·
1· · ·
0..
.
..
.
· · ·
..
.
..
.
0 0
· · ·
0 1
Ti..
.
Tn
(6) where:qACi
=
controllable input—AC devices in roomi(
ui);
Tei
=
measured perturbations—Exterior Temperature roomi(νi)
;
qdi
=
non-measured perturbations—Heat flow from sunlight,
machinery, people, open windows, etc.(
di)
;
yi
=
measured output vector—Temperature roomi.
Implicit to any predictive control algorithm it is the optimization of a cost function. In this paper the selected cost function,J, has the following form:
J
=
y(
1)
· · ·
y
(
1)
−
r(
1)
· · ·
r
Hp
T
·
W2y
·
y(
1)
· · ·
y
(
1)
−
r(
1)
· · ·
r
Hp
+
∆u
(
0)
· · ·
∆u
Hp−
1
T
·
W∆2u·
∆u
(
0)
· · ·
∆u
Hp−
1
+
u(
0)
· · ·
u
Hp−
1
−
utarget
(
0)
· · ·
utarget
Hp−
1
T
·
Wu2·
u(
0)
· · ·
u
Hp−
1
−
utarget
(
0)
· · ·
utarget
Hp−
1
+
ρ
ε·
ε
2 (7)where the first term refers to the tracking error, the second term refers to the energetic cost of the control action and the last term charges the deviations of the control action related to the desired value,utarget.Wu,WyandW∆uare factors to weigh the variables. Finally
ε
and its weight,ρ
ε, are relaxation factors.Depending on the values selected for the weighting factors,
Wu,WyandW∆u, different objectives can be obtained. In this case one selected similar weighting factors to all level outputs as these variables are equally important. In relation to the input variable weights, it was considered the same criteria.
The resolution of the optimization problem(7)used the Active Sets method from the MATLAB MPC-Toolbox (Bemporad et al., 2005).
The performance of this predictive controller is compared with a standard PI-controller (see Section4.2) whose parameters were derived according to the following described method.
Considering the controllable input qACi responding as a PI-controller, it can be characterized as:
qACi(t
)
=
k1i+
k2idt
Fig. 3. Consumer owned SM: Developed topology.
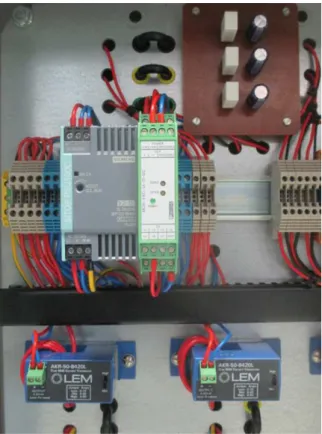
Fig. 4. Consumer owned SM: Sensor Unit connected to the house’s main electrical board.
With this assumption, Eq. (4), particularized for each room, becomes:
˙
Ti(t
)
=
1Ci
qdi(
t)
+
k1i+
k2idt
Ti
−
TTarget
−
1Ri
(
Ti(t
)
−
Tei(t))
.
(9)Fig. 6. Consumer owned SM: Centralized Unit—SCADA system with wireless receptor.
Finally the PI parameters (k1i, k2i) were calculated through the minimization of the functionalJPI (Eq.(10)) which assures the system stability.
JPI
=
n
j=1
1
/
Re(λj)
2;
Re(λj)
6−1
Re
(λj)
+
2; Re(λj) >
−1
(10)wherenis the system order and
λj
are the eigenvalues of the state space matrix.3.2. Consumer owned smart meters (SM)
The consumer owned SM was completely newly developed and it consists of 3 main sub-systems: (i) Sensor and Processor Unit; (ii) Mobile Display; (iii) Centralized Unit (SCADA system).Fig. 3 shows the developed topology for this SM.
The sensor unit is actually composed of a set of sensors, a micro-processor and a wireless network. The used sensors are voltage and current sensors, both delivering analogue output signals between 0 and 10 V. The sensor unit is physically connected to the main electrical panel of the consumer’s house (Fig. 4). This sensor unit is wired to the micro-processor of an Arduino board with a wireless transmitter (Fig. 5(a)). Finally, two wireless receivers are connected to the mobile display (Fig. 5(b)) and to the centralized SCADA PC server (Fig. 6). The mobile display needs also to be connected to an Arduino board in order to get autonomous signal processing capabilities. The used wireless network was the ZigBee norm, according to IEEE 802.15.4.
The Arduino is an open source platform developed in Italy in 2005. The used software to program the Arduino CPU is
Micro-processor & transmitter
Display & transmitter
a
b
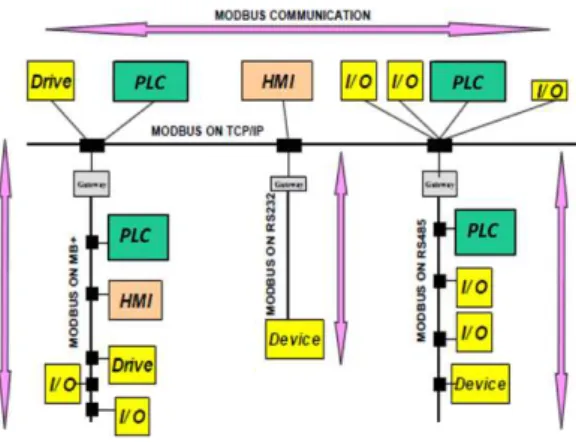
Fig. 7. ModBus communication.
freely available at http://www.arduino.cc/en/main/software. All the necessary software drivers are also freely available athttp:// www.arduino.cc/en/main/software.
The used wireless module was the XBee which was first devel-oped by Digi International Inc., according to the ZigBee network protocol, following IEEE 802.15.4 peer to peer. The used software for network configuration was the X-CTU http://www.digi.com/ support.
The norm IEEE 802.15.4 defines two types of participants in the network: FFD—Full Functioning Device and RFD—Reduced Functioning Device.
The developed ZigBee network followed the common standard, with 3 different components: (i) one Coordinator which establishes the network (FFD); (ii) 0 tonRouters that allow the enlargement of the spatial network coverage (FFD); (iii) 0 tonEnd Devices that can send and receive data, but are not able to enlarge the spatial network coverage (RFD).
The ZigBee norm allows two types of topologies: (i) Peer-to-Peer and (ii) star. The Peer-to-Peer-to-Peer-to-Peer topology can be subdivided into Mesh and Cluster Tree. In this work the selected topology was the Peer-to-Peer Mesh because it has the advantage of flexibility and dynamic regeneration whenever a network node looses functionality. However, this redundancy has a cost on transmission speed as the new automatic established path does not minimize the distance transmitter/receiver.
In the developed network, our three components were defined as: Sensor & Processor unit (Coordinator); centralized unit (Router) and mobile display (End Device), as it was previously illustrated in Fig. 3.
The used parameters were: ID-PAN ID – 0000
Baud Rate – 9600.
3.3. Distributor owned smart meters (SM)
In this paper it is studied the smart meter named EB BTN (Energy Box—Normal Low Voltage) for domestic use, from the Portuguese electricity distributor EDP.
The EB BTN supplies the consumer the following informa-tion, sequentially, through its two-line alphanumeric display: date and time; contracted power; contracted tariff; consumed power in each contracted category; real time values (Active Power– Voltage–Current; power factor; network frequency).
The EB BTN communicates with the consumer by either dis-play or ModBus protocol. In this paper the ModBus communication was used to establish the interface with the SCADA system through the MATLAB application. The ModBus communication has two main possibilities: (i) ModBus TCP and (ii) ModBus RTU/ASCII. The distributor’s device EB BTN allowed only the RTU interface. This
and it is composed of 4 fields: Address field; Function Code; Data; CRC (Cyclic Redundancy Check)http://www.modbus.org/specs/.
4. System implementation and experiments
A Supervisory Control and Data Acquisition (SCADA) System is used as an application development tool that enables system in-tegrators to create sophisticated supervisory and control applica-tions for a wide variety of technological domains, mainly in the industry field. The main feature of a SCADA system is its ability to communicate with control equipment in the field, through the PLC network. As the equipment is monitored and data is recorded, a SCADA application responds according to system logic require-ments or operator requests.
4.1. Software and hardware requirements
The SCADA system was developed over the platform Siemens Simatic WinCC (SIEMENS, 2008). Siemens Simatic Manager STEP 7 (SIEMENS, 2001) was used to program the PLCs and to configure the communications: (i) SCADA system–PLC Master (Ethernet) and (ii) within the PLC network (ProfiBus). MATLAB (The MathWorks, 2008) was used to compute the predictive controller actions. The Siemens Simatic Net (SIEMENS, 2006) was the selected server for the OPC service. The Siemens Simatic OPC Scout (SIEMENS, 2008) was used to configure the OPC communication protocol between the MATLAB and the WinCC SCADA.
In the performed laboratory tests, the used hardware was mainly composed by two Siemens S7-300 PLCs with respective HMI panels (Human Machine Interface) as illustrated inFig. 8. The additional inputs from the multi-users were directly introduced on the SCADA menu.
4.2. SCADA application
In the developed control strategy, the SCADA application per-forms the outer loop of the Operational level and communicates with the MPC controller (Interactive level). Due to the characteris-tics of the developed SCADA/MATLAB platform, high complex con-trol structures can be used to manage the overall system.
Fig. 8. Experimental PLC network.
the SCADA software responds to Client’s requests (Server attribu-tions) (http://www.opcfoundation.organdSantos et al., 2005). Ba-sically, once defined the OPC Server, one has to define the set of tags to be communicated between the two software partners (MATLAB and WinCC SCADA).
As an example of the MPC controller implementation, Fig. 9 shows the developed model to build up a consistent reference data to the MPC controller through the input of multiple-user set-points.
Both SM (user owned and distributor owned) integrates the SCADA–PLC system at the SCADA interface, as it was shown in 1. The MATLAB software is used to build up an application to receive the data from the SM. The OPC protocol supplies this data to the SCADA–PLC system. This strategy SCADA–PLC system allows the bi-directionality of the information flux: downwards to the actuators and upwards to the control algorithm where the future control actions are calculated.
Several SCADA menus were built for the developed Energy Man-agement System. The main characteristic of a SCADA Menu is to be simple, explicit and quick on transmitting the information to the system operator. Two types of Menus were here developed: Inter-active displays with summarized values and (ii) time dependent graphics for variable monitoring.
In Fig. 10 it is illustrated the interactive Menu built for the developed 3-Phase consumer owned SM.
Finally as a quantitative example of the performance of the system as a rooms’ temperature controller, with time-dependent references,Fig. 11shows the comparative results between the MPC and the traditional PI controller (see Section3.1).
5. Conclusions
This paper develops an energy management system with inte-gration of smart meters for electricity consumers in a smart grid context. The integration of two types of smart meters (SM) are de-veloped: (i) consumer owned SM and (ii) distributor owned SM. The SM are connected to a SCADA system (Supervisory Control And Data Acquisition) that supervises a network of Programmable Logic
Fig. 10. SCADA interactive menu—data from the 3Phase developed consumer owned SM.
20 25 30
Time [min]
Conf. Room
Ref. MPC PI 15
35
T
emp
.[ºC]
0 5 15 25 35 45 55 65 75 85
Fig. 11. Experimental data for temperature control—Conference room.
Controllers (PLC). The SCADA system/PLC network integrate dif-ferent types of information coming from the several technologies present in BAS (Building Automation Systems).
The developed control strategy implements a hierarchical cascade controller where inner loops are performed by local PLCs, and the outer loop is managed by a centralized SCADA system, which interacts with the entire local PLC network.
In order to implement advanced controllers, a communication channel was developed to allow the communication between the SCADA system and the MATLAB software.
A major contribution of the present study is the development of a complete new platform connecting the SCADA supervisory sys-tem, the MATLAB software, and the two existing main topologies of electricity smart meters (distributor owned and customer owned), in order to provide the usual SCADA systems with the ability to handle complex control algorithms for consumer energy manage-ment systems. The developed Internet-based control platform al-lows also the use of other common networks widely used in lower operational levels of BAS.
Acknowledgments
This work was supported by Fundacao Ciencia e Tecnologia, through IDMEC, under LAETA. The studied EB BTN was gently donated by EDP Distribuicao and CONTAR.
References
Bemporad, A., Morari, M., Ricker, N.,2005. Model Predictive Control Toolbox for Use with MATLAB, second ed. The Mathworks.
Chen, T.,2001. Real-time predictive supervisory operation of building thermal systems with thermal mass. Energy Build. 33 (2), 141–150.
Depuru, S.S.S.R., Wang, R., Devabhaktuni, V.,2011. Smart meters for power grid: Challenges, issues, advantages and status. Renew. Sustain. Energy Rev. 15, 2736–2742.
Dias, A.J.F.,2010. Telecontagem e Gestão de Energia em Casa—Conceito FunEnerg, Tese de Mestrado Integrado em Engenharia Electrotécnica e de Computadores, Faculdade de Engenharia da Universidade do Porto. (Master thesis in portuguese),
EDP Distribuicao. 2011. Smart Grid Pilots—What Drives Success. In: 2nd Intl. Conf. Smart Grids & Smart Cities, Lisbon, September.
Figueiredo, J., Martins, J.,2010. Energy production system management—renewable energy power supply integration with building automation system. Energy Convers. Manag. 45, 1120–1126.
Figueiredo, J., Sá da Costa, J., 2008. Operative platform applied to building automation. Comput.-Aided Civ. Infrastruct. Eng. 24, 26–40.
Figueiredo, J., Sá da Costa, J.,2012. A SCADA system for energy management in intelligent buildings. Energy Build. 49, 85–98.
Gangale, F., Mengolini, A., Onyeji, I.,2013. Consumer engagement: An insight from smart grid projects in Europe. Energy Policy 60, 621–628.
Geelen, D., Reinders, A., Keyson, D.,2013. Empowering the end-user in smart grids: Recommendations for the design of products and services. Energy Policy 61, 151–161.
Güngör, V.C., Sahin, D., Kocak, T., Ergüt, S., Buccella, C., Cecati, C., Hancke, G.P., 2011. Smart grid technologies: Communication technologies and standards. IEEE Trans. Ind. Inform. 7 (4), 529–539.
Kolokotsa, D., Pouliezos, A., Stavrakakis, G., Lazos, C.,2009. Predictive control techniques for energy and indoor environmental quality management in buildings. Build. Environ. 44, 1850–1863.
Krishnamurti, T., Schwartz, D., Davis, A., Fischhoff, B., Bruin, W.B., Lave, L., Wang, J.,2012. Preparing for smart grid technologies: A behavioural decision research approach to understanding consumer expectations about smart meters. Energy Policy 41, 790–797.
Maciejowski, J.,2002. Predictive Control with Constrains, second ed. Prentice-Hall. Melvin, H.,2014. The role of ICT in evolving smartgrids. In: 10th International
Conference on Digital Technologies. IEEE, Slovakia, pp. 235–237.
Neumann, P.,2007. Communication on industrial automation—What is going on? Control Eng. Pract. 15 (11), 1332–1347.
Santos, R., Normey-Rico, J., Gomez, A., Arconada, L., Moraga, C.,2005. OPC based distributed real time simulation of complex continuous processes. Simul. Model. Pract. Theory 13, 525–549.
SIEMENS. 2001. Simatic S7-300 – Ladder Logic (LAD) for S7-300. SIEMENS. 2006. Communication with SIMATIC, System Manual. SIEMENS, 2008. Simatic WinCC V7.0.
SIEMENS. 2008. Simatic Net OPC Scout V10.
Silva, P., Botto, M., Figueiredo, J., Rijo, M., 2007. Model predictive control of an experimental water canal. In: IFAC/IEEE European Control Conference, ECC’07, Greece, pp. 2977–2984.
Simões, M.G., Roche, R., Kyriakides, E., Suryanarayanan, S., Blunier, B., McBee, K.D., Nguyen, P.H., Ribeiro, P.F., Miraoui, A.,2012. A comparison of smart grid technologies and progresses in Europe and the U.S. IEEE Trans. Ind. Appl. 48 (5), 1154–1162.
Siroky, J., Oldewurtel, F., Cigler, J., Privara, S., 2011. Experimental analysis of model predictive control for an energy efficient building heating system. Appl. Energy 88, 3079–3087.http://dx.doi.org/10.10116/j.apenergy.2011.03.009.
The MathWorks, 2008. MATLAB 7.6.0.324 (R2008a), The MathWorks Inc. Vijayapriya, T., Kothari, D.P.,2011. Smart Grid: An Overview. Smart Grid Renew.
Energy 2, 305–311.

![Fig. 10. SCADA interactive menu—data from the 3Phase developed consumer owned SM. 202530 Time [min] Conf](https://thumb-eu.123doks.com/thumbv2/123dok_br/16700291.744007/8.892.187.726.96.358/scada-interactive-phase-developed-consumer-owned-time-conf.webp)
