doi: 10.1098/rspb.2010.1004
published online 7 July 2010
Proc. R. Soc. B
Lucas N. Joppa, David L. Roberts and Stuart L. Pimm
How many species of flowering plants are there?
Supplementary data
tml
http://rspb.royalsocietypublishing.org/content/suppl/2010/07/07/rspb.2010.1004.DC1.h "Data Supplement"
References
ml#ref-list-1
http://rspb.royalsocietypublishing.org/content/early/2010/07/07/rspb.2010.1004.full.ht This article cites 18 articles, 6 of which can be accessed free
P<P
Published online 7 July 2010 in advance of the print journal.This article is free to access
Subject collections
(249 articles) taxonomy and systematics
Articles on similar topics can be found in the following collections
Email alerting service
right-hand corner of the article or click Receive free email alerts when new articles cite this article - sign up in the box at the topherepublication.
Citations to Advance online articles must include the digital object identifier (DOIs) and date of initial
online articles are citable and establish publication priority; they are indexed by PubMed from initial publication.
the paper journal (edited, typeset versions may be posted when available prior to final publication). Advance
Advance online articles have been peer reviewed and accepted for publication but have not yet appeared in
http://rspb.royalsocietypublishing.org/subscriptions go to:
Proc. R. Soc. B To subscribe to
How many species of flowering
plants are there?
Lucas N. Joppa
1, David L. Roberts
2,3and Stuart L. Pimm
4,*
1
Microsoft Research, 7 J J Thomson Avenue, Cambridge CB3 0FB, UK
2Durrell Institute of Conservation and Ecology, School of Anthropology and Conservation, University of Kent,
Marlowe Building, Canterbury, Kent CT2 7NR, UK
3Royal Botanic Gardens, Kew, Richmond, Surrey TW9 3AB, UK 4
Nicholas School of the Environment, Duke University, Box 90328, Durham, NC 27708, USA
We estimate the probable number of flowering plants. First, we apply a model that explicitly incorporates taxonomic effort over time to estimate the number of as-yet-unknown species. Second, we ask taxonomic experts their opinions on how many species are likely to be missing, on a family-by-family basis. The results are broadly comparable. We show that the current number of species should grow by between 10 and 20 per cent. There are, however, interesting discrepancies between expert and model estimates for some families, suggesting that our model does not always completely capture patterns of taxonomic activity. The as-yet-unknown species are probably similar to those taxonomists have described recently—overwhelmingly rare and local, and disproportionately in biodiversity hotspots, where there are high levels of habitat destruction.
Keywords: angiosperms; biodiversity hotspots; taxonomic effort; threatened species; total number of species; unknown species
1. INTRODUCTION
How many species there are in a taxon is an intrinsically interesting question (May 1988, 1990; Prance et al. 2000; Pimm 2001; Dirzo & Raven 2003). It also has important implications for conservation. Recently discov-ered species are in biodiversity hotspots (Myers et al. 2000)—places with high levels of habitat destruction. As-yet-unknown species are likely to be in the same places and so in danger of extinction, if indeed they are found before they go extinct. Estimating how many such species there are is an essential step in setting conser-vation priorities.
There are two questions in estimating a taxon’s total number of species. Surprisingly, the first is how many unique species taxonomists have already described. There are considerable uncertainties in the estimates of such species. Only when these are resolved can one ask the second question of how many more species there are that are presently unknown.
The first question is one of synonymy—taxonomists give different names to the same species inadvertently. There have been several recent estimates of the currently known number of unique species of plants (Pranceet al. 2000; Alroy 2002; Bramwell 2002; Paton et al. 2008), with the highest estimate twice the lowest one. Paton
et al. (2008) found a consistent percentage of synonyms within each family and, taking that rate of synonymy into account, estimated 352 282 unique flowering plant names. We use the World Checklist of Selected Plant Families (WCSP 2008), a unique and continuously updated
synonymized world list of plants that the Royal Botanic Gardens, Kew supplied. It has resolved problems of synonyms, but for only some plant families and around 110 000 species of seed plants. We use GrassBase, a similar list for the roughly 10 000 species of grasses (Claytonet al. 2009).
We ask the second question for just the families in these synonymized checklists: how should one estimate the number of species remaining to be discovered? Previous estimates used scaling laws in food webs, abun-dance, body size, rarity and other methods to predict the total number of species in various taxa (May1988,1990, 1992). More recent attempts employ differing methods of extrapolation of the number of species described over time, with the expectation that the number of new species per time interval in a taxon will decline as the pool of unknown species diminishes (Solow & Smith 2005; Wilson & Costello 2005). Generally, they do not. In one study, New World grasses showed a consistent increase in the number of new species over time (Bebber et al. 2007)! We shall show that this pattern is indeed a common one.
We find previous attempts wanting because none includes the number of taxonomists involved in describing species. The number of plant taxonomists active in any period (which we will define) has increased steadily over the 250 years of taxonomic history, a trend probably true of other taxa too. Not surprisingly, the raw number of species described over time has increased as well. By ana-logy to fishing statistics, one scales raw fish catches by the effort taken to acquire them to obtain ‘catch per unit effort’ as a measure of stock size. Here, we model the rate at which taxonomists ‘catch’ previously unknown species.
Our model has two factors. First, the greater the effort—the number of taxonomists involved in describing
*Author for correspondence ([email protected]).
Electronic supplementary material is available athttp://dx.doi.org/10. 1098/rspb.2010.1004or viahttp://rspb.royalsocietypublishing.org.
Proc. R. Soc. B
doi:10.1098/rspb.2010.1004
Published online
Received12 May 2010
species—the more species they will describe in a given interval, other things being equal. We define ‘taxono-mists’ simply as those who describe new species. Taxonomic effort is a powerful predictor of the number of species described.
Second, taxonomists have probably increased the effi-ciency of their efforts since the mid-1700s. That was when Linnaeus introduced the system of binomial nomenclature and founded modern taxonomic practice by providing as complete an account of all known species as he could. By ‘taxonomic efficiency’ we mean simply an increase in the number of species described per taxono-mist, adjusted for the continually diminishing pool of as-yet-unknown species. Not all the taxonomists we polled (see below) thought taxonomic efficiency had increased. Were efficiency to have remained constant, the number of species described per taxonomist would decline continuously over time as the supply of unde-scribed species dwindled. We will show that for many taxa there is an increase in the number of species per taxonomist, typically for a century or so.
Finally, there are other confounding issues, also inspired by fishing analogies, to which we shall return.
2. AN APPROACH USING TAXONOMIC EFFORT
The WCSP, together with GrassBase, present synony-mized checklists of monocots, a monophyletic clade that includes approximately 20 per cent of all known flowering plants. These lists give a total count of 69 323 species of monocots. The WCSP checklist of the remaining flowering plants is less complete. We consider a total of 49 481 species that constitute less than a fifth of these non-monocot families.
For each 5-year interval, we calculate the number of unique species discovered and the number of taxonomists working. We expect the number of species described in intervalSi to depend on the number of taxonomists Ti
actively describing species during that period,
SiaTi: ð2:1Þ
Our model consists of two elements. The first is the remaining number of species to be described, SR. It is
the total number of species, ST, minus the cumulative
number of species already described, P
Si up to the
given year,t
SR¼ST
X
Si fori¼1760 to yeart: ð2:2Þ
We chose 1760 as the start date to avoid the undue influence of Linnaeus’s seminal work Species plantarum (Linne´ 1753).
The second element is taxonomic efficiency, E. We assume that taxonomists have become more effective at finding and describing species now than in the past. For simplicity, we assume that this increase in efficiency increases linearly over time:
Ei¼aþb:year ðor for convenienceE¼aþbYiÞ; ð2:3Þ
whereaandbare estimated parameters. Efficiency need not increase, whereupon b would be zero. All things being equal,Si/Tiwill decrease as the number of species
still to be discovered declines. Also, Si/Ti will increase
over time as efficiency increases, so the exact form
will depend on the product of efficiency and species remaining,
Si
Ti
ðaþbYiÞ ST
X Si
: ð2:4Þ
From this it follows that
Si Tiðaþb*YiÞðST
X
SiÞ: ð2:5Þ
This is an intrinsically nonlinear statistical model, because there are four independent variables in the complete expression,
Si¼STb1Tiþb2STTiYib1Ti
X Si
b2TiYi
X
Siþ1i; ð2:6Þ
but only three parameters to be estimated:ST,b1andb2,
1iare the residuals.
The number of species described per period tends to be ‘spiky’, indicating the undue influence of monographs that describe many species in the year they appear fol-lowed by intervals when taxonomists described relatively fewer species. For obvious reasons, as the number of tax-onomists increases, the influence of individual monographs declines and the relationship becomes smoother. To normalize the residuals, we took the logar-ithms of observed (Si) and predicted (STb1Tiþb2STTi
Yi2b1 Ti
P
Si2b2 TiYi
P
Si) numbers of species, and
minimized the sums of squares of their differences. We used a grid search followed by a steepest-descent method to find values of the three parameters that minimized this sum of squares.
This logarithmic transformation creates large residuals when the numbers of species are very small, as they were in the mid-1700s. If at least 40 species had not been described by 1760, we started in the first 5-year period where the cumulative number of known species was 40 or more.
Our model does not permit estimates of confidence intervals based on parametric statistics. We can estimate the certainty of our estimates in two ways. First, we used a standard jack-knife procedure iteratively removing data from one 5-year interval at a time and successively returning the previously removed data. This procedure provided 47 – 50 different predicted total species esti-mates, depending on the taxon and the year in which the cumulative number of species was more than 40. We report their minima and maxima. Second, we re-ran the entire analysis using 10-year intervals, obtaining simi-lar results to those reported here.
3. RESULTS
(a)Overall estimates of diversity
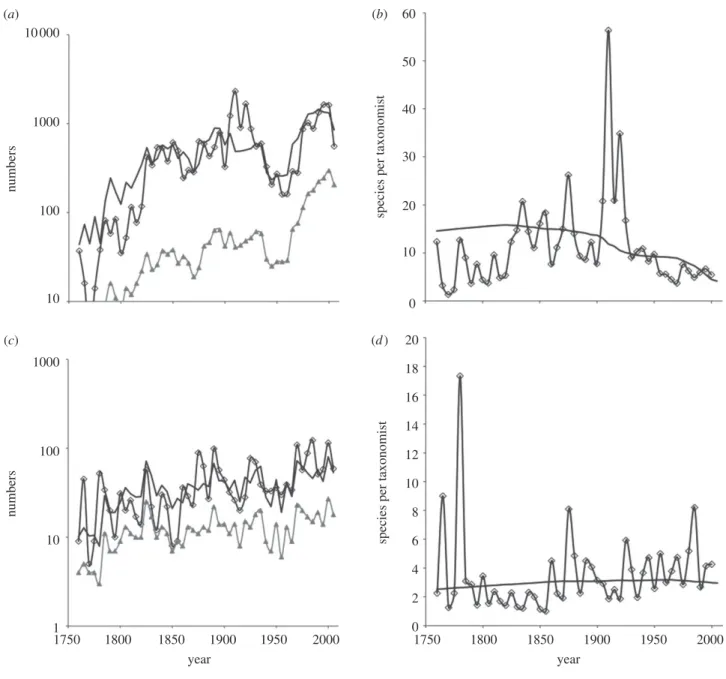
For monocots (figure 1a), there is a broad increase in the number of species described per interval over time. The scale is logarithmic. The decline since 2005 represents incomplete data. Clearly, any method based simply on the number of species would conclude that there is no diminution of the pool of as-yet-unknown species. Figure 1a also shows the increasing number of taxono-mists active in any period—essentially an exponential increase (linear on the figure’s scale) since about 1800. There are dips in both numbers from the 1920s until 2 L. N. Joppaet al. How many species are there?
the 1960s. Figure 1b,d shows the number of species described per taxonomist plotted on an arithmetic scale. These decline continuously over time.
For selected non-monocots, the number of species described per period increases until about 1850 and then remains roughly constant (figure 1c). The number of taxonomists again increases roughly exponentially. The number of species per taxonomist increases for about a century then declines steadily.
We estimate there should be an increase of 17 per cent in the number of species of monocots (range 13 – 18% using the jack-knife procedure; table 1). For the selected non-monocots in the database, the number of species should increase by 13 per cent (range 11 – 14% using the jack-knife procedure; table 1). These estimates broadly compare with Prance et al. (2000), who independently arrived at an estimate of 20 per cent.
(b)Family-by-family results
We analysed individually all taxonomically complete families containing more than approximately 500 species. As an example, for orchids (figure 2a,b), the number of species per taxonomist increases very slightly then clearly decreases over time. The ‘spike’ represents the work of Rudolf Schlechter who, at his peak, described over 400 species per year between 1911 and 1913 (Schlechter 1911 – 1914;WCSP 2008).
For irises (figure 2c,d) in the late 1700s, large numbers of showy South African species were discovered and brought to Europe. Since 1800, the number of species per taxonomist has increased slowly and so our model does not provide a sensible estimate of the number of unknown species.
Table 1 shows the results for 17 taxonomically com-plete families of monocots presented in order of decreasing numbers of species. These families contain
10000
18
(a) (b)
(c) (d)
16
14
12
10
8
6
species per taxonomist
4
2
0
18 20
16
14
12
10
8
6
species per taxonomist
4
2
0 1000
numbers
100
10
10000
1000
numbers
100
10
1750 1800 1850 1900 1950 2000
year
1750 1800 1850 1900 1950 2000
year
more than 93 per cent of all monocot species. Between 11 (Orchidaceae; range 9 – 12%) and 68 per cent (Eriocaula-ceae; range 52 – 204%) more species remain to be discovered in each family.
We label the estimate for families where our estimate is more than three times the number of known species as ‘failing to converge.’ Four families did not provide sensible estimates.
There are 15 families in the WCSP database other than monocots that have more than 500 species (table 1), constituting 96 per cent of the species in the dataset we used. Ten of 15 families provided sensible esti-mates. The six families with the greatest numbers of species constitute 75 per cent of the species we model, and for them we predict increases from 20 per cent (Euphorbiaceae; range 16 – 24%) to more than twice the presently known number (Phyllanthaceae). These six families suggest a much higher number of unknown species than the 13 per cent we estimate for the group
as a whole. That a subset of families provides different overall estimates than all families combined may seem contradictory, yet it reflects increasing specialization by taxonomists over time (see the electronic supplementary material).
(c)How do our results compare with expert opinion?
In our second approach, we polled botanical colleagues for their estimates of how many species would eventually be described. We obtained estimates for 18 families this way (table 1). Their overall average—a 15 per cent increase in the present number of species—fits well with our model estimates. For three families, experts used a slightly different number of known species than in the cat-alogues we used above. For Poaceae, the expert provided a number of known species differing substantially from our tally.
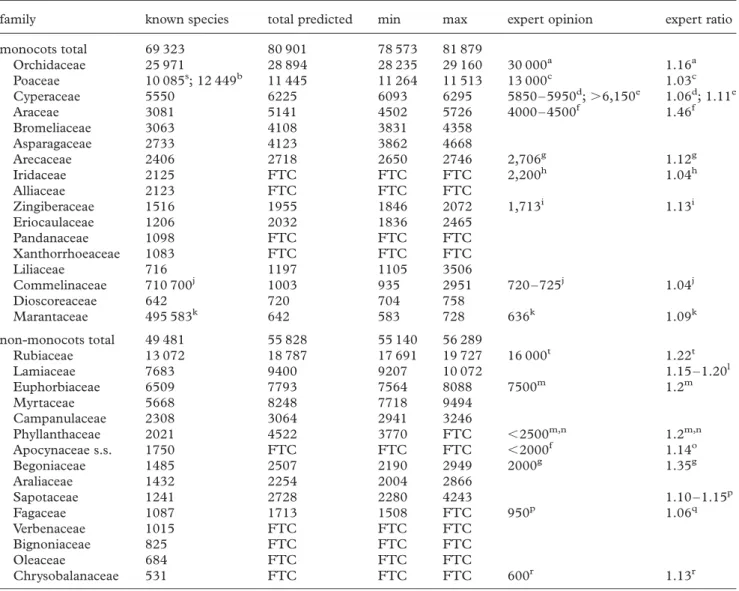
Table 1. Summary table of model results for all monocot families and selected non-monocots. Columns two and three list the number of currently known species present in the WCSP and GrassBase data, and the total number of species we estimate to exist. Columns four and five report the minimum and maximum number of species predicted using the jack-knife methodology see§3. Column six lists expert estimates of the total number of species. FTC indicates those families where the model did not converge on a number less than three times the current number of known species. Superscripts a – t denote the expert taxonomist that provided the estimate. Where the expert also provided a different number of currently known species we included that figure in column 2.
family known species total predicted min max expert opinion expert ratio
monocots total 69 323 80 901 78 573 81 879
Orchidaceae 25 971 28 894 28 235 29 160 30 000a 1.16a Poaceae 10 085s; 12 449b 11 445 11 264 11 513 13 000c 1.03c Cyperaceae 5550 6225 6093 6295 5850 – 5950d;.6,150e 1.06d; 1.11e
Araceae 3081 5141 4502 5726 4000 – 4500f 1.46f
Bromeliaceae 3063 4108 3831 4358
Asparagaceae 2733 4123 3862 4668
Arecaceae 2406 2718 2650 2746 2,706g 1.12g
Iridaceae 2125 FTC FTC FTC 2,200h 1.04h
Alliaceae 2123 FTC FTC FTC
Zingiberaceae 1516 1955 1846 2072 1,713i 1.13i
Eriocaulaceae 1206 2032 1836 2465
Pandanaceae 1098 FTC FTC FTC
Xanthorrhoeaceae 1083 FTC FTC FTC
Liliaceae 716 1197 1105 3506
Commelinaceae 710 700j 1003 935 2951 720 – 725j 1.04j
Dioscoreaceae 642 720 704 758
Marantaceae 495 583k 642 583 728 636k 1.09k
non-monocots total 49 481 55 828 55 140 56 289
Rubiaceae 13 072 18 787 17 691 19 727 16 000t 1.22t
Lamiaceae 7683 9400 9207 10 072 1.15 – 1.20l
Euphorbiaceae 6509 7793 7564 8088 7500m 1.2m
Myrtaceae 5668 8248 7718 9494
Campanulaceae 2308 3064 2941 3246
Phyllanthaceae 2021 4522 3770 FTC ,2500m,n 1.2m,n
Apocynaceae s.s. 1750 FTC FTC FTC ,2000f 1.14o
Begoniaceae 1485 2507 2190 2949 2000g 1.35g
Araliaceae 1432 2254 2004 2866
Sapotaceae 1241 2728 2280 4243 1.10 – 1.15p
Fagaceae 1087 1713 1508 FTC 950p 1.06q
Verbenaceae 1015 FTC FTC FTC
Bignoniaceae 825 FTC FTC FTC
Oleaceae 684 FTC FTC FTC
Chrysobalanaceae 531 FTC FTC FTC 600r 1.13r
aP. J. Cribb; bB. Simon; cR. Soreng; dD. Simpson; eW. Thomas; fS. Mayo; gA. Henderson; hP. Goldblatt; iJ. Kress; jR. B. Faden; k
H. Kennedy;lA. Paton;mP. Berry;nK. Wurdack;oD. Goyder;pT. Pennington;qP. Manos;rG. Prance;sClaytonet al. (2009);tDaviset al. (2009).
4 L. N. Joppaet al. How many species are there?
For 11 of 18 families, expert opinion broadly matches the results of a quantitative modelling (table 1). In con-trast, for three families (Iridaceae, Apocynaeae, and Chrysobalanaceae) where our estimates failed to provide sensible estimates, experts suggested that few species remain unknown (4%, 14% and 13%, respectively). How can we reconcile these opinions of few remaining unknown species with data showing either no decreases or sometimes even slight increases over time in the number of species described per taxonomist? By analogy to fishing catch-per-unit effort statistics, some families might have near-constant species per taxonomist ratios for decades—suggesting a large supply of unknown species—but then decline rapidly and unexpectedly as the ‘stock’ of such species is quickly exhausted.
Goldblatt justified his expectation that Iridaceae will be complete in about 5 years despite the generally increasing rate of species described per taxonomist over time (P. Goldblatt 2009, personal communication). The family is horticulturally desirable and has been deliberately targeted
thoroughly in its known centres of diversity. Relatively poorly known areas, such as the wet tropics, hold few species. His work has been to revise genus after genus. He records that he is close to the end of genera that could be usefully revised and writes that ‘additions will just come to an abrupt end in the next 3 –5 years.’ We will explore more complex models incorporating the taxo-nomic completion of subsets of plant families elsewhere.
4. DISCUSSION
To summarize, the number of presently unknown plant species is thought to be 10 to 20 per cent of the number of known plant species. Approximately 13 per cent of the species in these synonymized data have been described since 1990. Of those, approximately 90 per cent are known from only one of the 300 or so regions into which the WCSP divides the world. Certainly, time may uncover other locations for these species, but that trend is balanced by the fact that, if the species were
10000
1000
numbers
100
10
1000
100
numbers
10
1
1750 1800 1850 1900 1950 2000
year
1750 1800 1850 1900 1950 2000
year
species per taxonomist
0 10 20 30 40 50 60
18 20
16
14
12
10
8
6
species per taxonomist
4
2
0
(a) (b)
(c) (d)
widespread, taxonomists would probably have found them earlier (Collenet al. 2004).
Overwhelmingly, the locations of these recent discov-eries are critically imperilled—as are the species themselves (Mabberley 2009provides an exception). Of the species found since 1990 that occur in only one region, almost 80 per cent inhabit biodiversity hotspots (Myers et al. 2000). These areas have many endemic species, by definition. Our results suggest that their num-bers will increase further. Also by definition, these areas also have exceptionally high levels of habitat loss. Simply, unknown species are nearly all likely to be rare and in rapidly shrinking habitats, and hence likely to be deemed ‘threatened’ when taxonomists do describe them. Brummitt et al. (2008) suggest that 20 per cent of known plant species are threatened. If we take this esti-mate, then add to that our result that there are 10 to 20 per cent more unknown species that are also likely to be threatened, then 27 to 33 per cent of all plant species are probably threatened. These estimates are based on immediate threat, and do not consider further develop-ment of destructive factors—including climate disruption (Pimm 2009)—during the remainder of this century.
The authors thank Peter Raven for suggesting the questions this paper asks, extensive comments on the manuscript, strongly held views on the primacy of expert opinions and assistance in providing them. Royal Botanic Gardens, Kew provided access to and assistance with the WCSP. R. Govaerts and A. Paton allowed access to the World Checklist of Selected Plant Families and provided useful discussions on the data used in this paper. Alex Davies extracted the data and D. Simpson provided helpful discussions on GrassBase. We thank taxonomic experts P. J. Cribb, K. Wurdack, R. Soreng, B. Simon, D. Simpson, W. Thomas, P. Goldblatt, R. B. Faden, H. Kennedy, P. Berry, P. Manos, G. Prance, A. Davis, T. Pennington, A. Paton, S. Mayo, A. Henderson, J. Kress, D. Goyder and M. Sands for their expert opinions. J. Lucas and G. Russell provided statistical advice.
REFERENCES
Alroy, J. 2002 How many species are valid?Proc. Natl Acad. Sci. USA99, 3706 – 3711. (doi:10.1073/pnas.062691099) Bebber, D., Marriott, F., Gaston, K., Harris, S. & Scotland, R. 2007 Predicting unknown species numbers using dis-covery curves.Proc. R. Soc. B274, 1651 – 1658. (doi:10. 1098/rspb.2007.0464)
Bramwell, D. 2002 How many plant species are there?Plant Talk28, 32 – 34.
Brummitt, N., Bachman, S. & Moat, J. 2008 Applications of the IUCN Red List: towards a global barometer for plant
diversity. Endangered Species Res. 6, 127 – 135. (doi:10. 3354/esr00135)
Clayton, W. D., Harman, K. T. & Williamson, H. 2009 GrassBase: the online world grass flora. See http://www. kew.org/data/grasses-db.html.
Collen, B., Purvis, A. & Gittleman, J. 2004 Biological corre-lates of description date in carnivores and primates.Global Ecol. Biogeogr.13, 459 – 467.
Davis, A., Govaerts, R., Bridson, D., Ruhsam, M., Moat, J. & Brummitt, N. 2009 A global assessment of distribution, diversity, endemism, and taxonomic effort in the Rubiaceae. Ann. Mo. Bot. Garden 96, 68–78. (doi:10. 3417/2006205)
Dirzo, R. & Raven, P. 2003 Global state of biodiversity and loss.Annu. Rev. Environ. Resour. 28, 137 – 167. (doi:10. 1146/annurev.energy.28.050302.105532)
Linne´, C. 1753 Species plantarum.Imprensis Laurentii Salvii, Stockholm2, 970 – 971.
Mabberley, D. 2009 Exploring Terra Incognita.Science324, 472. (doi:10.1126/science.1173323)
May, R. 1988 How many species are there on Earth?Science 241, 1441 – 1449. (doi:10.1126/science.241.4872.1441) May, R. 1990 How many species?Phil. Trans. R. Soc. Lond. B
330, 293 – 304. (doi:10.1098/rstb.1990.0200)
May, R. 1992 How many species inhabit the Earth?Scient. Am.267, 42– 48. (doi:10.1038/scientificamerican1092-42) Myers, N., Mittermeier, R., Mittermeier, C., da Fonseca, G. & Kent, J. 2000 Biodiversity hotspots for conservation priorities.Nature403, 853–858. (doi:10.1038/35002501) Paton, A., Brummitt, N., Govaerts, R., Harman, K.,
Hinchcliffe, S., Allkin, B. & Lughadha, E. 2008 Towards Target 1 of the Global Strategy for Plant Conservation: a working list of all known plant species—progress and pro-spects.Taxon57, 602 – 611. (doi:10.2307/25066027) Pimm, S. L. 2001 The world according to Pimm: a scientist
audits the Earth. New York, NY: McGraw-Hill.
Pimm, S. 2009 Climate disruption and biodiversity. Curr. Biol.19, 595 – 601.
Prance, G., Beentje, H., Dransfield, J. & Johns, R. 2000 The tropical flora remains undercollected. Ann. Mo. Bot. Garden87, 67 – 71. (doi:10.2307/2666209)
Schlechter, R. 1911 – 1914 Die Orchidaceen von Deutsch-Neu-Guinea (Repertorium Specierum Novarum Regni Vegetabilis).Berlin, Germany: Centralblatt fu¨r Sammlung und Veroffentlichung von Einzeldiagnosen neuer Pflanzen.
Solow, A. & Smith, W. 2005 On estimating the number of species from the discovery record. Proc. R. Soc. B 272, 285 – 287. (doi:10.1098/rspb.2004.2955)
Wilson, S. & Costello, M. 2005 Predicting future discoveries of European marine species by using a non-homogeneous renewal process.Appl. Statist.54, 897 – 918.
WCSP 2008 World checklist of selected plant families. The Board of Trustees of the Royal Botanic Gardens, Kew. Seehttp://www.kew.org/wcsp.
6 L. N. Joppaet al. How many species are there?