DETERMINATION OF CIRCULATION AND SHORT PERIOD FLUCTUATION IN
ILHA GRANDE BAY (RJ), BRAZIL
YOSHIMINE lKEDA & MERRITT STEVENSON*
Instituto Oceanográfico da Universidade de são Paulo
Synopsis
A mesoscale study was made of the Ilha Grande area. The local circulation
de-scribed through progressive vector diagramsshowed a clockwise bottom
circu-Zation determined in June
1976~while in the upper 10 m the direction of the flow
entering the Ilha Grande Bay was towards the center in the west and towards the
Marambaia sandbank in the east side of the Bay. Short periods and amplitude
fluctu-ations were evaluted using power spectral
analysis~Fourier and Maximum Entropy
Method~
which shçwed that in the upper 10 m predominant
peri~dsdecrease from 1.lh
(A
=
6.3em sec-
1 )(position
=
3C)
to1.Oh (A
=
·7.4emsec-
1 )(position
=
2D) and
increase
to5.8h (A
=
6.8em .. sec
-1)(position
=
lD)
~while at the bottom Zayer the
predominant period increases from 0.4 h (A
=
5.O em sec-
1 )(position
=
3G)
to 6.4h
(A
=
7.0cmsec-
1 )(position
=
2G) and
to4.4h (A
=
7.9emsec-
1 )(position
=
lG).
From the original data it has been possible
todetermine an "intense pulsation"
between 30-70óm sec-
1in the upper 10 m with about 1. Oh period and 10-20 min
duration in all the stations.
Introduction
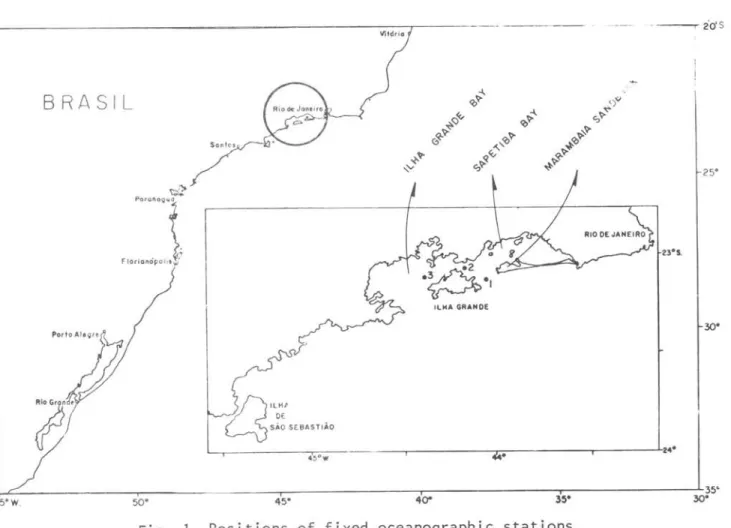
An oceanographic cruise on board of the R/V "Prof. W. Besnard" was made in June 1976, under the Mu1tinationa1 Marine Sea Science Project supported by OAS (Organ-ization of American States). Our purpose was to determine periodic osci11ations between 0.2h-15.0h and also the mean circu1ation at different (mean and bottam) depths. This kind of work was for the first time carried out in the Ilha Grande area (Fig. 1).
Current measurements
Figure 1 shows the position of the three fixed oceanographic stations and Table I gives the depths of current meter obser-vations. At fixed stations the current direction and velocity were measured by a "BRAYSTOKE", BFM 008 MK2 current meter, with five minute samp1ing interva1s and
* Instituto de Pesquisas Espaciais Avenida dos Astronáutas, 1758 - Caixa Postal 515, 12.200 - são Jose dos Cam-pos, são Paulo.
Publ. nQ
477do
rnó~. oceanog~.da U6p.
readings accuracy of (± 5°: direction and ± 3cmsec -1: velocity). Three current meters were used: two at the fixed (mean and bottom) depths and one profiling from surface to the bottom every one hour (ve1ocity profi1e). In this paper, on1y data from mean and bottom depths were used.
Current measurement analysis
Current va1ues (ve1ocity and direction) were decomposed into U and V components , positive to east and north, respective1y. Severa1 computer }?rograms were used on the B6700 of the University of Ca1ifornia, San Diego and on the IBM 1800 of Scripps Institution of Oceanography for the processing of the current meter data and subsequent statistica1 ana1ysis. These programs were origina11y written by Stevenson ~ alo (1969), 1ater modified for current measurements and
adapted to our data.
90 Bol m Inst. oceanogr., S Paulo, 29(1), 1980
r - - - -- ---::I/j-::-'d'-:-;o-r---··- --·· - _ .- -.
BRASI L
25'
ILWA GRANOE
300
;;;'
4!>°W--.---r;---.---I-1
240
I
~______,_- - ____._-___:r::_-~-_:'::35·
55'w . 50' ~
h
~ ~Fig o 10 Positions of fixed oceanographic stations.
Table I - Oceanographic fixed stations and current ~~~~r ~ç .. ~ '
measurements (5 min sampling frequency)
Sta(;on
La t . (s)
Position
Long. (w)
oay
Hour (GHT)
23°08'3"
044°04'0"
oepth (m)
10
Station No .
10
1 G
20
06/12/1976
00 : 07 - 19:10h
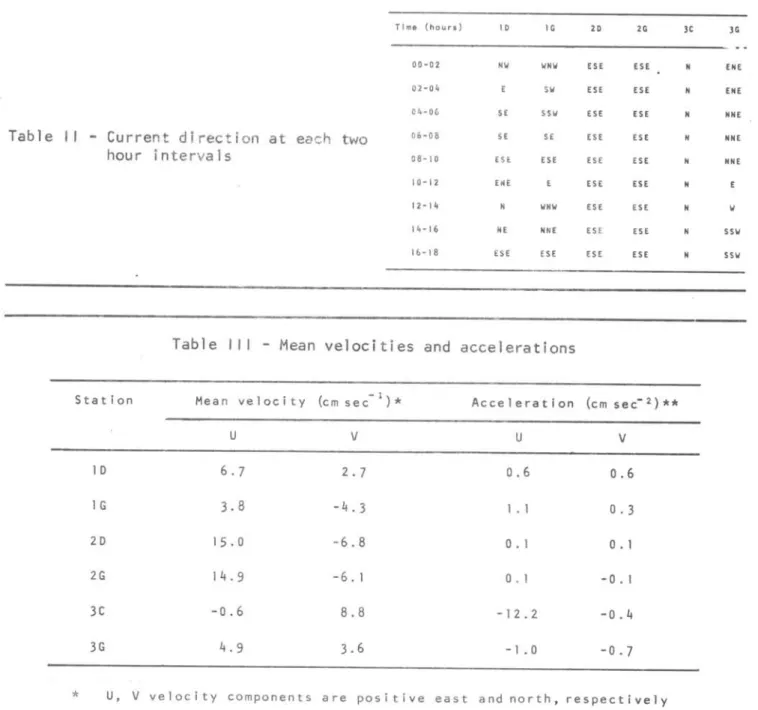
(Table lI). The second prograrn determined the mean velocity and acceleration (Table 111) for each fixed position time series
044°11'9"
oepth (m)
10
1 7
Station No.
20
2G
06/12/1976 - 06/13/1976
23:30 - 18:35
23°06'7"
044023'3"
oépth (m)
06
Station No.
20
3C
3G
06/13/1976 - 06/14/1976
21:00 - 12:15
Time (hauro) 10 I G 20 2G 3C 3G
00-02 NW WNW ESE ESE ENE
02-0~ SW ESE ESE ENE
04-06 SE SSII ESE ESE NNE
Table 11
-
Current di rection at each two 06-08 SE SE ESE ESE NNEhour intervals 08-10 ESE ESE ESE ESE NNE
10-12 E~E ESE E$E
12-1 ~ IINII ES E ESE li
1~-16 NE NNE ESE ES E SSII
16-18 ESE ESE ES E ESE SSII
Table I I I - Mean velocities and accelerations
5tation Mean veloeity (e m s e e-I)
*
Aeeeleration (em see-2)**
U V U V
1 D 6.7 2.7 0.6 0.6
1 G 3.8 -4.3 1.1 O . 3
2D 15. O -6.8 O. 1 O . 1
2G 14.9 -6.1 0 . 1 -O. 1
3C -0.6 8.8 -12.2 -0.4
3G 4.9 3.6 -1 • O -0.7
*
U, V velocity eomponents are positive east and north, respectively**
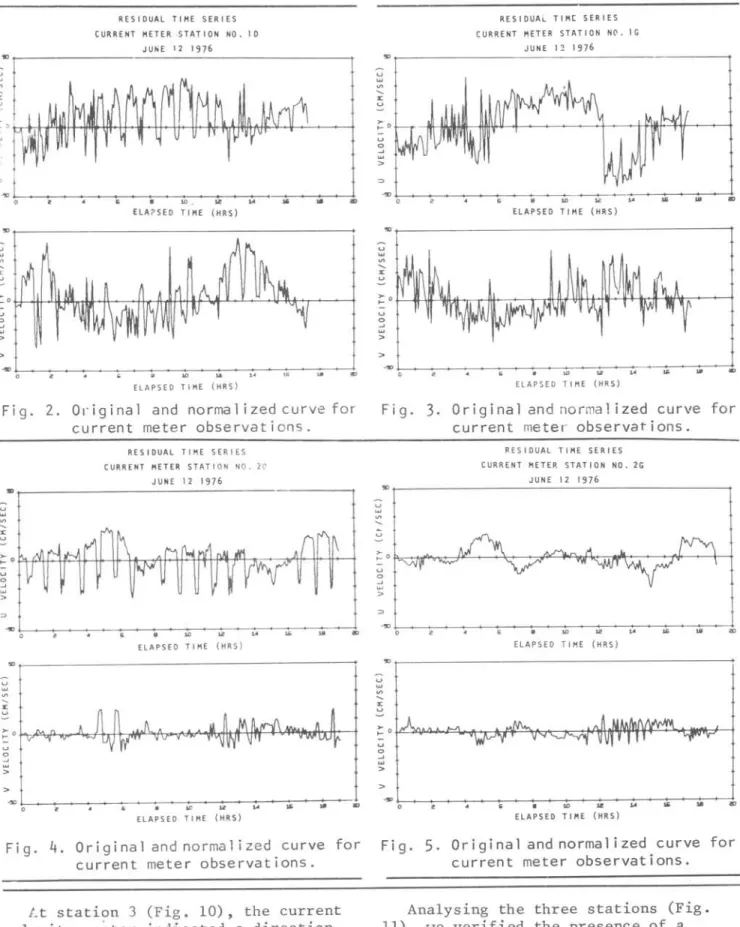
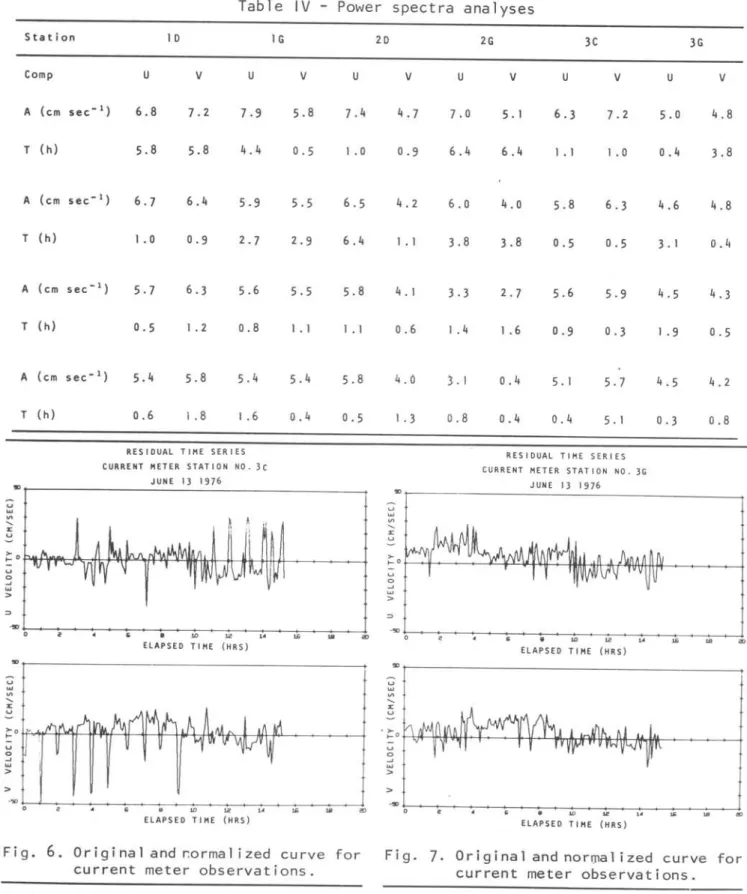
Positive U, V eomponents indieate inereasing veloeitythe norma1ized U and V eomponents time series (Figs 2-7). Power spectra ana-1yses were performed aeeording to Fourier and Maximum Entropy Method (Mesquita & Morettin, 1978) and the resu1ts are shown in Table IV.
Progressive vector diagrams
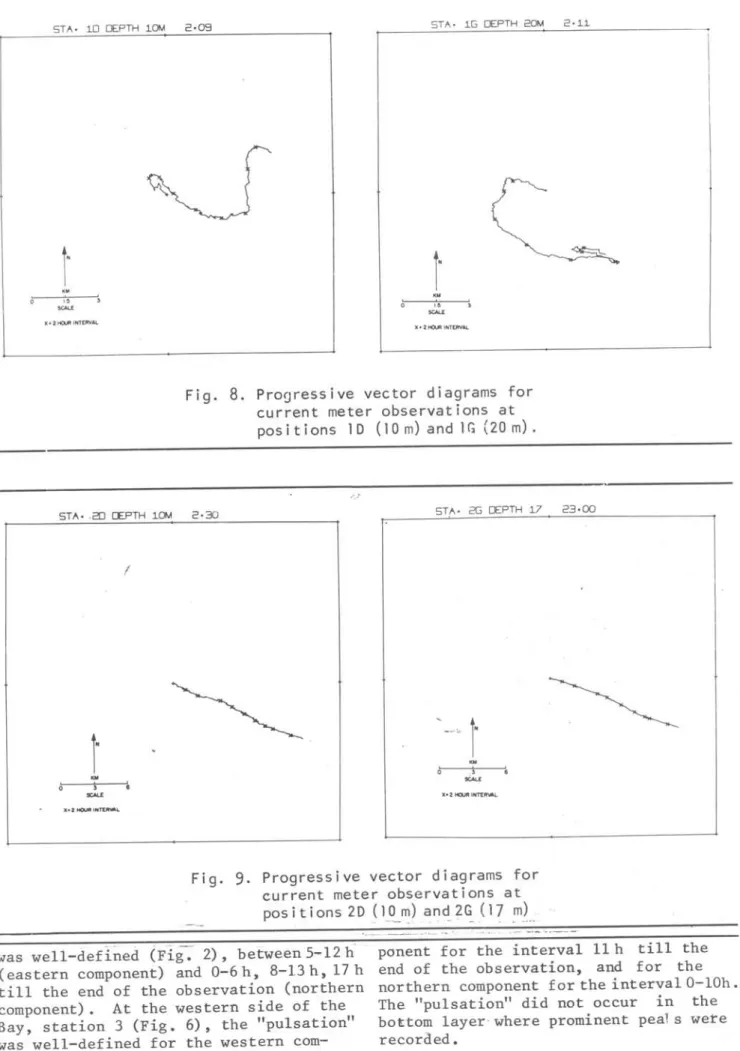
At station 1, at 10 m (position = 1D), the mean eurrent veloeity was 7.2emsee-1
towards the ENE whi1e at 20 m (position 1G), the mean ve10eity was 5.7emsee-1
towards the SE (Fig. 8). This suggests that oeean water enters the eastern en-trace of Ilha Grande Bay at 10 m, whi1e
the Bay water exits at 20 m. The mean aeee1eration at 10 m and 20 m depth was 0.9 em see-2 and 1.2 em see-2 ,
re-speetive1y.
At station 2 (Fig. 9), the current ve10eity veetor at 10 m (position=2D) and 17 m (position = 2G) indieated an outf1ow in the ESE direetion. That is, water f10ws eastward1y, from the western
side of Ilha Grande Bay. At 10 m (po-sition = 2D) the mean ve10eity was 16.5 em see-1 and aeee1eration 0.1 em see-2
whereas a t 17 m (pos i tion = 2G), the mean ve10ei ty was 16.1 em s ee-1 and ae~e1er
92
RESIDUAL TIME SERIES CURRENT METER ·STAT I ON NO. I D
JUNE 12 1976
HA?SED TIME (HRS)
ELAPSED T1ME (HRS)
Fig. 2. Original and normal ized curve for current meter observations.
RESIDUAL TIME SERIES CURRENT METER STAT ION NO. 2l'
JUNE 12 1976
mrl---~
~~--~----~~~-+--~+-~w~r-~--~~~~~--~~w--~m
ELAPSED TIME (HRS)
~r---~
>
~~---~---+-~w----~----~~--~~----w~~m
ELAPSED TIME (HRS)
Fig. 4. Original and normal ized curve for current meter observations.
Lt station 3 (Fig. 10), the current velocity vector indicated a direction towards the N at 6 m depth and towards ENE at 20 m. At 6 m (position = 3C) , the mean velocity was 8.8cmsec-1 and
acceleration 12.2 em sec-2 and at 20 m
(position= 3G), the mean velocity was 6.1 cm sec-1 and acceleration 1. 2
cm sec 2
Bolm Inst. oceanogr., S Paulo, 29(1), 1980
RESIDUAL TIMe SERIES CURRENT METER STATION N0. lG
JUNE 12 1976
~r--- --- ----.---t
ELAPSED TIME (HRS)
~r---t
u
~
V>
...
li: u
~O~~~~~T,-~~~--r.~~~~~-t~~~~~+----t
u
o
~
~
>
IZ
ELAPSED TIME (HRS)
Fig. 3. Original and normal ized curve for
current meter observations.
u
~
V>
--u
~
V> ... li: u
RESIDUAL TIME SERIES CURRENT METER STATION NO . 2G
JUNE 12 1976
~r---~
ELAPSEO TIME (HRS)
~r---ELAPSED TIME (HRS)
Fig. 5. Original and normal ized curve for current meter observations.
Analysing the three stations (Fig. 11), we verified the presence of a significant bottom clockwise circu-lation, flowing from west to east in Ilha Grande Bay and towards the sea while in the upper 10 m the water flows
Table IV - Power spectra analyses
Station
Comp
T (h)
T (h)
T (h)
T (h)
10
u v u
6.8 7.2 7.9
5.8 5.8 4.4
6.7 6.4 5.9
1 • o 0.9 2.7
5.7 6.3 5.6
0.5 1 .2 0.8
5.4 5.8 5.4
0.6 1.8 1.6
RESIDUAL TIME SERIES CURRENT METER STATIDN NO . 3c
JUNE 13 1976
1 G
v u
5.8 7.4
0.5 1 • o
5.5 6.5
2.9 6.4
5.5 5.8
1.1 1.1
5.4 5.8
0.4 0.5
mr---~
ELAPSED TIME (HRS)
~r---~
>
·~~~~--~~~~~~~~--~~~~~~~~~w~~~
ELAPSED TIME (HRS)
Fig. 6. Original and r.ormal ized curve for current meter observations.
Pe r i od i c i t i e 5
Figures 2-7 show the series of eurrent measurements taken at positions lD, lG, 2D, 2G, 3C and 3G, plotted with 5 min interval sampling.
From the original data, for the upper 10 m the "pulsation" has oeeurred in all the stations. These intensities with a
20
v u
4.7 7.0
0.9 6.4
4.2 6.0
1.1 3.8
4.1 3.3
0.6 1 .4
4 . 0 '3.1
1.3 0.8
2G 3C
v u v
5.1 6.3 7.2
6.4 1.1 1 • b
4. O 5.8 6.3
3.8 O .5 0.5
2.7 5.6 5.9
1.6 O .9 O .3
O .4 5. I 5.7
0.4 0.4 5.1
RESIDUAL TIME SERIES
CURRENT METER STATION NO. 3G
JUNE 13 1976
3G
u v
5. o 4.8
o .4 3.8
4.6 4.8
3.1 o .4
4.5 4.3
1.9 0.5
4.5 4.2
0.3 0.8
~r--- ---- ---~
· ~~~~----~~~~~+-~w~~~+-~--~~~+-~w~-±~
ELAPSED TIME (HRS)
~r---~ u '" V> ... '" u
•
>-~o~~~~+-+_~-t~~~~~~~_M~r_~+-~--,
u
o
-'
'" >
>
..
'"ELAPSED TIME (HRS)
Fig. 7. Original and norl)lal ized curve for current meter observations.
30-70 em see-1 range and 10-20 min
94
Bo1m Inst. oceanogr., S Paulo, 29(1), 1980STA · ~ D DEPTH ~OM 2·09 STA · ~ G DEPTH 20M 2 ·~~
IH
,.
"
SCAU
X' 2 HClUIt INTERVAlo
)(·2M()U1t I N T ~
Fig. 8. Progressive vector diagrams for current meter observations at positions 1D (10m)and1G(20m).
STA· -20 CEPTH ~OM 2·30 STA · 2G OCPTH ~ 7 23· 00
/
Fig. 9. Progressive vector diagrams for current meter observations at pos i ti ons 20 (1 _ 0 _ ~) ~~c! 2G_ ( 1? m)
was we11-defined (Fig. 2), between 5~12 h
(eas tern component) and 0-6 h, 8-13 h, 17 h till the end of the observation (northern
component). At the western side of the
Bay, station 3 (Fig. 6), the "pulsation" was well-defined for the western
STA· 3C OEPTH 06M 1·84
t·
I
...
,.•
SCAU
STA· 3G OEPTH 20M 1·84
X ·21101.J11 1 ~ T EJfV" l
Fig. 10. Progressive vector diagrams for current meter observations at pos i t i ons 3C (6 m) and 3G (20 m).
55'
23·00'
05'
10
V
,
,
10'
".
15'
23'30'
4430' 25' 20' 15' 10' os' 44 O'
Fig. 11. Out1ine of speed and direction of mean current observed at
Ilha Grande area.
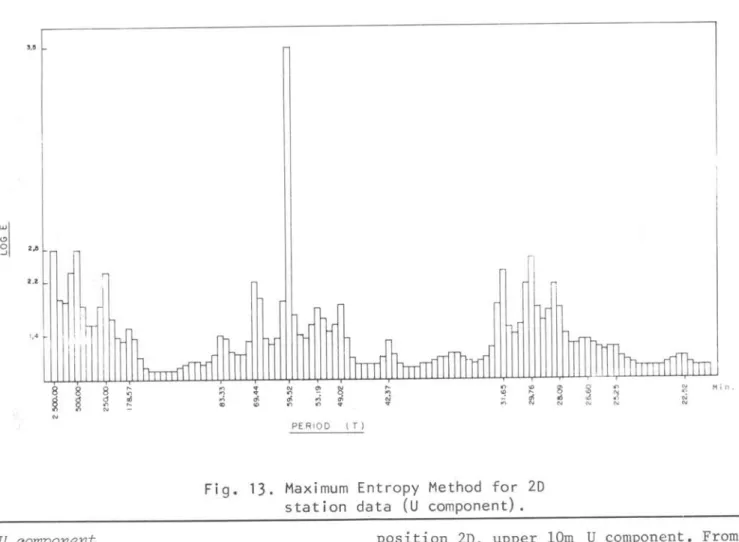
Figures 12-13 show spectrum for 2D station data (U component), respectively for Fourier Analysis and Maximum Entropy Method. From these Figures, according
to Mesquita & Morettin (1978), the ampli-tudes were better defined by Fourier A-nalysis and the periods had a better reso1ution through Maximum Entropy Method.
7.'
~I
8,'',.
~O ... ~
..
"' .....
õi Hin .
~O "! <l
'"
..
" "
~g o ;; ~~ '" ~
'" '"
..
"'''
P ERioD (T)
Fig o 12. Fourier analysis for 2D station data (U component) o
96
Bolm Inst. oceanogr., S Paulo, 29(1), 19805,'
z ..
PER IOO (T)
Fig. 13. Maximum Entropy Method for 2D station data (U component).
U component
For the upper 10 m the eommon period was about 1.0 h for all the stations and had a predominant amplitude, the greater one
loeated at position 2D. From Table IV,
we verified that the predominant periods deerease from 1.1 h (A=6.3em , see- 1)(po-sition=3C) to 1.0 h (A=7.4em see- 1)
(position == 2D) a nd inerease to 5.8 h (A =
6.8em see-1)(position=lD). For the
bDttom layer the eommon period was not determined exeept for positions lG and 2G, where the greatest amplitudewas reeorded
in position lG. The predominant period inereased from 0.4 h(A = 5.0 em see- 1 )
(position == 3G) to 6 .4h(A = , 7.0 em ! sec 1)
(position == 2G) ,and deerease to 4.4 h
(A=7.gem see-·) (position=lG).
V componen-t
For the upper 10 m the eommon period of about 1.0 h was determined for alI the stations and the greatest one Nas located at 3C position. This amplitude had almost the same magnitude of that of
pos i tion 2D, upper 10m U eomponent. From Table IV, we verified that the periods deerease from 1.0 h (A = 7.2 em l see-1)(po-sition= 3C) to 0.9 h (A= 4.7 em see- 1) (pos i tion = 2D) and inereas e to 5.8 h (A = 7.2 emsee-1)(position=lD) in the upper
10 m. For the bottom layer, the eommon
period was observed only for positions 2G
and 3G, with a period of 0.4 h, the
greatest one loeated at position 3G. The periods increase from 3.8 h (A = 4.8 em see- 1) (position=3G) to 6.4h (A=5.lem see- 1) (position = 2G) and deerease to 0.5h (A=5.8emsee- 1) (position=lG).
Resul ts
The summary of alI data showed that there is a signifieant bottom eloekwise eireu-lation from west to east and towards the sea iri Ilha Grande Bay, while intheupper
10 m the water flows to the eenter of the
,
Bay in the ' western side and towards Maram-baia sandbank in the eastern side of the Bay (Fig. 11).
2D (U component) and 3C (V component) and with a smaller one in station lD, whileat
the bottom layer prominents peaks have oc-curred.
Discussion
A comparative analysis of the three fixed oceanographic stations indicated that at the upper 10 m the water flows to th e center of the Bay in the western side of it and at the eastern side towards Maram-baia sandbank, while at the bottom layer it exhibited a predominant clockwise circulation from west to eas t and towards the sea in Ilha Grande Bay.
Our resul ts showed the occurrence of a "pulsation" with about 1.0 h period and with 10-20 min duration. The 1.0 h common
period .determined for the upper 10 m proba-bly indicates the natural ressonant frequency of that portion of the Bay. Merian's Method (Proudman, 1952) indicated for the eas tern and wes tern parts of the Bay a natural f.requency of about 1,0 h, well within the period detected. However,
the "pulsation" observed does not seem to support the above idea since it does not show a characteristic variability of "seiches" but a rather, sudden, strong and periodic change of intensity of the flow. Also this variability cannot be related to the findings of Cartwright
&
Young (1974) for the S he tI and I sI ando Cartwright
&
Young(op.
cit.),studying "seiches" and tidal ringing in the sea near Shetland, through spectral analysis, found a narrow peak about 2.1 h prominent at two pelagic sites close to the shelf edge and at Baltsound but negligible at shallow water sites and at Leowick. They explained this fact in terms of trapped edge waves and tidal ringing.Cartwright
&
Young(op.
cit.)
open a new research program to be developed here aiming at the determination of the proba-ble cause of the "pulsation" occurrence. Studies on wave and tide propagation at adjacent oceanic area would answer this questionoConcl us ion
From the results obtained through visual inspection of the original data, pro-gressive vectorial diagrams, Fourier Analysis and Maximum Entropy Method, the following observations can be made:
1. A predominant bottom clockwise circu-lation was observed (6.1 cm sec-1 , at the wes tern entr ace, 16.1 em sec-l, channel and 5.7 em sec 1, at the
eastern entrace);
2. in the upper 10 m this circulation was not observed but the inflow of water in both entrances of the Bay (8.8 emsec-t, western entrance and 7.2 em sec-l, eastern entrance);
3. the most important periods determined can be summarized as follows:
Position Amplitude (em see-I ) Period (hour)
10 7.2 5.8
I G 7.9 4.4
20 7.4 I. O
2G 7 . O 6.4
3C 7.2 I . O
3G 5. O 0.4
An interpretation of the dynamical aspects of the variability shown above
and phase studies will be given in a future paper.
Acknowledgements
The basic data processing and preparation of this paper was supported by OAS (Pro-grama Multinacional de Ciências do Mar), "Projeto Integrado para Uso e Exploração Racional do Meio Ambiente Marinho", sub-projetos Biologia da Pesca e Hidrodinâmica Costeira - FINEP". The Inter-American Tropical Tuna Commission provided com-puter programs for the subsequent t i Tl e
series analysis of current meter time series. Our thanks to Prof. Afrânio Ru-bens de Mesquita, for guidance in using Maximum Entropy Method programmes, and interpreting the results; to Mrs. Maria Cecília Catunda, for the revision of the English manuscript; to Mr. Marco Antônio Mbntalban, for the drawings and to Miss Marilza Correia, for typing the manu-script.
References
CARTWRIGHT, D. E. & YOUNG, C. M. 1974.
Seiches and tidal ringing in the sea near Shetland. Proc. R. Soc., ser. A.,
33&: 1111-1118.
oceanográ-98 Bolm Inst. oceanogr., S Paulo, 29(1), 1980
ficas com pequeno número de observações. Atas 39 Simp. naco Probabi1.
Estatís-tica. são Paulo. Inst. Mat. Estat. da USP, r. ~ 1~5-173.
PROUDMAN, J.
nography.
1952. Dynamica1 ocea-London, Methuen, 409p.
STEVENSON, M. R.; PATULLO, J. G. & WYATT, B. 1969. Subsurface currents o f f t h e Oregon coast as measured by Parachut Drogues. Deep Sea Res., 16:449-461.