Vol.46, n. 4: pp. 563-568, December 2003
ISSN 1516-8913 Printed in Brazil
BRAZILIAN ARCHIVES OF
BIOLOGY AND TECHNOLOGY
A N I N T E R N A T I O N A L J O U R N A L
Comparative Effect of Glucagon and Isoproterenol on
Hepatic Glycogenolysis and Glycolysis in Isolated Perfused
Liver
Márcia Vardanega-Peicher
*, Ricardo Galletto, Sarah Pagliarini e Silva and Roberto
Barbosa Bazotte
Departamento de Farmácia e Farmacologia; Universidade Estadual de Maringá - UEM; Av. Colombo 5790; 87020-900; Maringá - PR - Brazil
ABSTRACT
The effect of glucagon and isoproterenol (ß-adrenergic agonist) on hepatic glycogenolysis and glycolysis in isolated perfused liver was compared. The levels of isoproterenol and glucagon which promoted the maximal activation of glycogenolysis were 20 µM and 1nM respectively. However, glucagon (1 nM) not only increased glycogenolysis but also inhibited glycolysis. Because adenosine-3’-5’-cyclic monophosphate (cAMP) is a common second messenger to glucagon and isoproterenol, the level of cAMP that simulates the effect of these substances were investigated. The concentration of cAMP that inhibited glycolysis was five times higher (15 ìM) than that which stimulated glycogenolysis (3 ìM). Similar inhibition of glycolysis was obtained with cAMP agonists resistant to phosphodiesterases, i.e., 8-Br-cAMP and N6-monobutyryl-cAMP (6-MB-cAMP) at the concentration of 3 ìM. Thus, apparently glucagon could produce higher cellular levels of cAMP than that obtained with the activation of ß-adrenergic receptors. The higher amount of cAMP could be enough to overcome the action of phosphodiesterases and penetrate in the cytosol creating a favourable gradient to inhibit the enzymes of glycolysis.
Key Words: Hepatic glycolysis – Hepatic glycogenolysis - Glucagon - Isoproterenol – cAMP
* Author for correspondence
INTRODUCTION
Glycolysis in the liver is regulated in an opposite manner by adenosine-3’-5’-cyclic monophosphate (cAMP) elevating agents, i.e., epinephrine (ß-adrenergic receptors) and glucagon which stimulates and inhibits glycolysis respectively (Bazotte et al., 1989; Ceddia et al., 1999; Vardanega-Peicher et al., 2000). Because glucagon and isoproterenol share a common second messenger, i.e., cAMP, the opposite effect on glycolysis could involve the concentration of cAMP. On the other hand, it is well established
that cAMP and synthetic analogues permeate the liver cell membrane producing metabolic effects (Constantin et al., 1997). Because, structurally, cAMP is a relatively large, polar and water-soluble molecule it is difficult to estimate exactly how much of the applied amount is actually permeating into the cells. For this reason, very high concentration of cAMP has been employed. For instance, Kagimoto and Uyeda (1980) used AMPc 100 µM, but could be relevant to point out that 3% of this concentration, was enough to get metabolic effects in the liver (Vicentini et al., 2000a,b).
concentration which imitated the effect of isoproterenol (ß-adrenergic agonist) and glucagon on hepatic glycogenolysis and glycolysis. Moreover, in order to get further information about the participation of cAMP on glycogenolysis and glycolysis promoted by isoproterenol and glucagon, experiments measuring the effect of cAMP analogues were performed.
MATERIALS AND METHODS
cAMP, 8-Br-cAMP, and isoproterenol were
purchased from Sigma Chemical Company. N6
-monobutyryl-cAMP (6-MB-cAMP) was obtained from Biolog. Glucagon was obtained from Eli Lilly. All other reagents were of the highest purity obtainable. Male Wistar fed rats (200-220 g), were anesthetized by an intraperitoneal injection of pentobarbital sodium (40 mg/kg). After laparotomy, livers were perfused in situ through the portal vein as previously described (Akimoto et al., 2000; Souza et al., 2001). After 10 min of perfusion isoproterenol, glucagon, cAMP or cAMP agonists were dissolved in the perfusion fluid and infused between 10 and 30 min of the perfusion period. The concentration of isoproterenol (20 µM) and glucagon (1 nM), which promoted the maximal activation of glycogenolysis, were employed (Lopes et al., 1998). On the other hand, increasing concentrations were employed until get values that imitate the effect of isoproterenol and glucagon on glycogenolysis and glycolysis.
Glucose (Bergmeyer and Bernt, 1974), L-lactate (Gutmann and Wahlefeld, 1974) and pyruvate (Czok and Lamprecht, 1974) in the effluent perfusate were measured at 2-min intervals. All metabolic measurements were expressed as
µmol.min-1.g-1 tissue fresh weight. Assuming that L-lactate and pyruvate released into the perfusate represents 80-90% of the total glycolytic flux (Kimmig et al., 1983), glycolysis should be calculated by the sum of L-lactate plus pyruvate. Thus, the rate of glycolysis was measured as the difference between the amount of L-lactate and pyruvate released during (10-30 min) and before (0-10 min) the infusion of all substances. The differences allowed obtain and compare the areas under the curves (AUC). Additionally, the rate of
obtained by the difference between the amount of glucose released during (10-30 min) and before (0-10 min) the infusion of all substances.
The computer program GraphPad Prism (version
2.0) calculated the AUC, expressed as µmol/g +
standard error of the mean (SEM).
RESULTS AND DISCUSSION
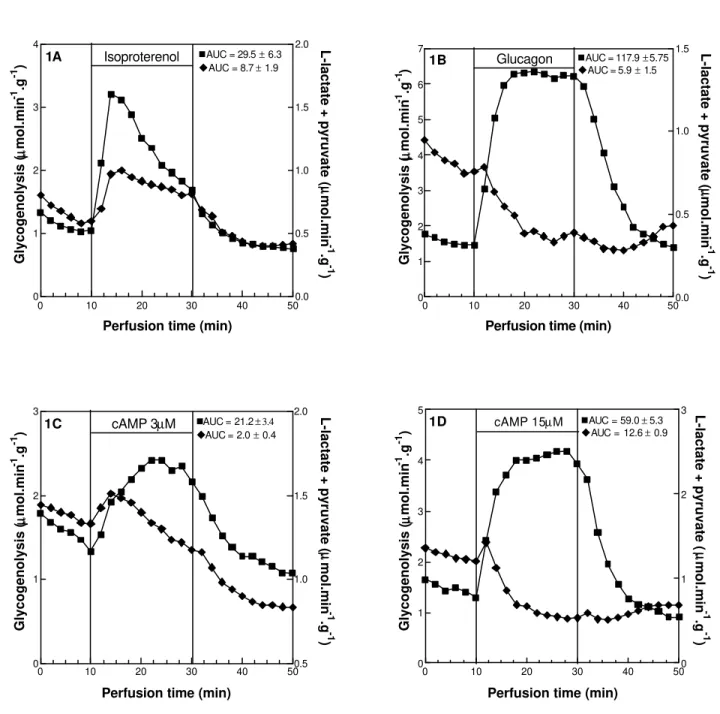
Isoproterenol (Fig 1A) activated glycogenolysis (AUC = 29.5 ± 6.3) and glycolysis (AUC = 8.7 ± 1.9). On the other hand, glucagon also activated glycogenolysis (AUC = 117.9 ± 5.75) but inhibited glycolysis (AUC = 5.9 ± 1.5). The activation of glycogenolysis was mediated by cAMP which was synthesized by adenylate cyclase in response to activation by glucagon and ß-adrenergic receptors. In view of the fact that the effects of glucagon and isoproterenol on glycogen catabolism are mediated by cAMP, the opposite effect on glycolysis could involve the amount of cAMP.
To find the concentration of cAMP which imitated the effect of isoproterenol and glucagon, increasing concentrations of cAMP (1.5 ìM, 2.25 ìM, 3 ìM, 15 ìM, 30 ìM, 60 ìM) were employed (results not showed). Therefore, from the minimal (i.e., 1.5 ìM) until the maximal (i.e., 15 ìM) concentration of cAMP, which activated glycogenolysis, the levels of cAMP that simulated the effect of isoproterenol (Fig 1A) and glucagon (Fig 1B) were respectively 3 ìM (Fig 1C) and 15 ìM (Fig 1D). In agreement, the concentration of cAMP, which simulated the effect of isoproterenol and glucagon on glycolysis were respectively 3 ìM and 15 ìM (Fig 1C,D). Thus, a question can be raised: why cAMP at the concentration of 15 ìM but not 3 ìM inhibited glycolysis? Notwithstanding the fact that we did not measure how much of the cAMP actually got into the cells, it was well known that the intracellular levels of cAMP were proportional to the extra cellular concentration employed in the liver perfusion experiments (Vicentini et al., 2000a,b). Our data
0 10 20 30 40 50 0
1 2 3 4
0.0 0.5 1.0 1.5 2.0 Isoproterenol
1A nAUC = 29.5± 6.3
uAUC = 8.7± 1.9
Perfusion time (min)
Glycogenolysis (
µµ
mol.min
-1 .g
-1 )
L-lactate + pyruvate
(µµ
mol.min
-1
.g
-1
)
0 10 20 30 40 50
0 1 2 3 4 5 6 7
0.0 0.5 1.0 1.5 Glucagon
1B nAUC = 117.9±5.75
uAUC = 5.9± 1.5
Perfusion time (min)
Glycogenolysis (
µµ
mol.min
-1 .g -1 )
L-lactate + pyruvate (
µµ
mol.min
-1
.g
-1
)
0 10 20 30 40 50
0 1 2 3
0.5 1.0 1.5 2.0
1C cAMP 3µM nAUC = 21.2 ± 3.4 uAUC = 2.0± 0.4
Perfusion time (min)
Glycogenolysis (
µµ
mol.min
-1 .g
-1 )
L-lactate + pyruvate (
µµ
mol.min
-1
.g
-1
)
0 10 20 30 40 50
0 1 2 3 4 5
0 1 2 3 cAMP 15µM
1D nAUC = 59.0±5.3
uAUC = 12.6± 0.9
Perfusion time (min)
Glycogenolysis (
µµ
mol.min
-1 .g -1 )
L-lactate + pyruvate (
µµ
mol.min
-1
.g
-1
)
0 10 20 30 40 50 0
1 2 3 4 5
8Br-cAMP 3µM
2A
0 1 2
nAUC = 52.4±7.8 uAUC = 10.0± 1.2
Perfusion time (min)
Glycogenolysis (
µµ
mol.min
-1 .g
-1 )
L-lactate + pyruvate (
µµ
mol.min
-1
.g
-1
)
0 10 20 30 40 50
0 1 2 3 4 5 6 7
6MB-cAMP 3µM
0 1 2 3
2B nAUC = 116.1±10.5
uAUC = 13.9± 1.0
Perfusion time (min)
Glycogenolysis (
µµ
mol.min
-1 .g
-1 )
L-lactate + pyruvate (
µµ
mol.min
-1
.g
-1
)
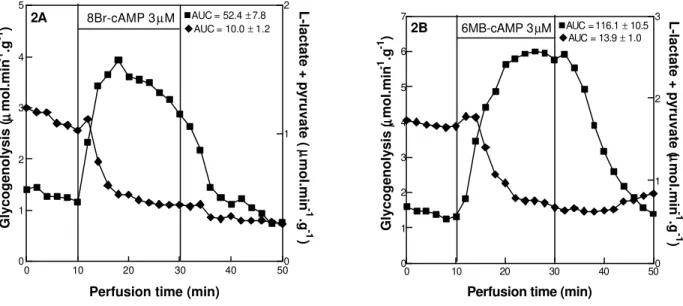
Figure 2 - Effect of 3 µM 8-Br-adenosine 3’-5’ cyclic monophosphate, i.e., 8-Br-cAMP (A) and 3 µM N6-monobutyryladenosine 3’-5’ cyclic monophosphate, i.e., 6-MB-cAMP (B) on glycogenolysis (squares) and glycolysis (diamonds). The data reported are the mean of 4-7 individual liver perfusion experiments. AUC = Area under the curve. Liver perfusion experiments were performed as described in materials and methods.
Thus, at the concentration of 3 ìM (Fig 1C) the amount of cAMP, which got into the hepatocytes was enough to activate glycogenolysis (AUC = 21.2 ± 3.4) increasing the availability of glucose to suffer glycolysis (AUC = 2.0 ± 0.4). Moreover, at the concentration of 15 ìM (Fig 1D), the amount of cAMP, which got into the hepatocytes was enough not only to activate glycogenolysis (AUC = 59.0 ± 5.3) but also to inhibited glycolysis (AUC = 12.6 ± 0.9).
If the activation of glycogenolysis and the inhibition of glycolysis was due to the amount of cAMP, which got into the cells, cAMP analogues resistant to hydrolysis by phosphodiesterases, could show similar results obtained with cAMP (15 ìM) at lower concentration. To investigate these possibility cAMP analogues resistant to hydrolysis by phosphodiesterases were employed. As showed by Fig 2A, 8-Br-cAMP, at the concentration of 3 ìM, like glucagon, activated glycogenolysis (AUC = 52.4 ± 7.8) and inhibited glycolysis (AUC = 10.0 ± 1.2). In agreement, 6-MB-cAMP (Fig 2B), a specific inhibitor of hepatic phosphodiesterase 3B (Zhao et al., 2000), also activated glycogenolysis (AUC = 116.1 ± 10.5) and inhibited glycolysis (AUC = 13.9 ± 1.0). Considering that both cAMP analogues can act as
protein kinase agonists, we could suggest that the amount of cAMP determined the effect on glycogenolysis and glycolysis.
Considering that the cytosol was the first cell compartment which received the cAMP infused or produced by the activation of adenylate cyclase we can suggest, as proposed by Houslay and Milligan (1997), that the anchored phosphodiesterases distributed in the cytosol created localized cAMP gradients which permited different response to glycolysis and glycogenolysis. The higher amount of cAMP could be enough to overcome the action of phosphodiesterases and penetrate in the cytosol creating a favourable gradient to inhibit the enzymes of glycolysis.
ACKNOWLEDGMENTS
This work was supported by CNPq grant number 400075/2002-0.
RESUMO
O objetivo do presente estudo foi comparar o efeito do glucagon e do isoproterenol (agonista ß-adrenérgico) sobre a glicogenólise e o processo de glicólise em fígado isolado. As concentrações de isoproterenol e de glucagon que promovem a máxima ativação da glicogenólise hepática foram respectivamente 20 µM e 1nM. Todavia, o glucagon (1 nM) além de estimular a glicogenólise, inibe a glicólise. Como o glucagon e o isoproterenol possuem um segundo mensageiro em comum, ou seja, o AMPc, as concentrações de AMPc que simulam os efeitos do glucagon e do isoproterenol foram investigadas. A concentração de AMPc necessária para inibir a glicólise foi cinco vezes maior (15 ìM) do que a necessária para simular o efeito do isoproterenol (3 ìM). Além disso, similar inibição da glicólise foi obtida utilizando análogos do cAMP resistentes à hidrolise por fosfodiesterases (8-Br-cAMP e 6-MB-cAMP) ambos na concentração de 3 ìM. Assim, os resultados sugerem que o glucagon produz concentração intracelular de AMPc mais elevada do que aquela obtida com a ativação de receptores ß-adrenégicos. Portanto, a mais elevada concentração intracelular de cAMP promovida pelo glucagon além de ativar a glicogenólise, inibiria a glicólise. Assim, estes resultados como um todo sugerem que a simultânea ativação da glicogenólise e a inibição da glicólise promovida pelo glucagon constituem um mecanismo que propicia ao fígado maior capacidade de liberar glicose.
REFERENCES
Akimoto, L. S.; Pedrinho, S. R.; Lopes, G. and Bazotte, R. B. (2000), Rates of gluconeogenesis in perfused liver of alloxan-diabetic fed rats. Res. Commun. Mol. Pathol. Pharmacol., 107, 65-77.
Bazotte, R. B.; Constantin, J.; Curi, R.; Kemmelmeier, F. S.; Hell, N. S. and Bracht, A. (1989), The sensitivity of glycogenolysis to glucagon, epinephrine and cyanide in livers from rats in different metabolic conditions. Res. Commun. Chem. Pathol. Pharmacol.,
64, 193-205.
Bergmeyer, H. U. and Bernt, E. (1974), Determination of glucose with glucose oxidase and peroxidase. In:
Methods of enzymatic analysis, ed. H.U. Bergmeyer. New York : Verlag Chemie-Academic. pp 1205-1215. Ceddia, R. B.; Lopes, G.; Souza, H. M.; Borba-Murad,
G. R.; Willian Jr., W. N.; Bazotte, R. B. and Curi, R. (1999), Acute effects of leptin on glucose metabolism of in situ rat perfused livers and isolated hepatocytes.
Int. J Obesity, 23, 1207-1212.
Constantin, J.; Kemmelmeier, F. S.; Yamamoto, N. S. and Bracht, A. (1997), Production, uptake, and metabolic effects of cyclic AMP in bivascularly perfused rat liver. Biochem. Pharmacol., 54, 1115-1125.
Czok, R. and Lamprecht, W. (1974), Pyruvate, phosphoenolpyruvate and D-glycerate-2-phosphate. In: Methods of Enzymatic Analysis, Edited by Bergmeyer HU, Vol 2, pp. 1446-1448, Academic Press, New York.
Gutmann, I. and Wahlefeld, W. (1974), L-(+)-Lactate. Determination with lactate dehydrogenase and NAD. In: Methods of Enzymatic Analysis, Edited by Bergmeyer HU, Vol. 2, pp. 1464-1472, Academic Press, New York.
Houslay, M. D. and Milligan, G. (1997), Tailoring cAMP-signalling responses through isoform multiplicity. Trends Biochem. Sci.,22, 217-224. Kagimoto, T. and Uyeda, K. (1980), Regulation of
rat liver phosphofructokinase by glucagon-induced phosphorylation. Arch. Biochem. Biophys., 203, 792-799.
Kimmig, R.; Mauch, T. J.; Kerzl, W.; Schwabe, U. and Scholz, R. (1983), Actions of glucagon on flux rates in perfused rat liver. 1. Kinetics of the inhibitory effect on glycolysis and the stimulatory effect on glycogenolysis. Eur. J. Biochem., 136, 609-616. Lopes, G.; Lima, F. B.; Hell, N. S.; Vardanega, M. and
Bazotte, R. B. (1998), The responsiveness of glycogen catabolism to adrenergic agonists during insulin-induced hypoglycemia (IIH) in rat livers. Gen. Pharmac., 30, 593-599.
Souza, H. M.; Borba-Murad, G. R.; Ceddia, R. B.; Curi, R.; Vardanega-Peicher, M. and Bazotte, R. B. (2001), Rat liver responsiveness to gluconeogenic substrates during insulin-induced hypoglycemia. Braz. J. Med. Biol. Res., 34, 771-777.
Bracht, A. (2000a), Modeling the transformation of
exogenously supplied cAMP in the perfused rat liver. Res. Commun. Mol. Pathol. Pharmacol.,
107, 297-309
Vicentini, G. E.; Constantin, J.; Lopez, C. E. and Bracht, A. (2000b), Transport of cyclic AMP and
synthetic analogs in the perfused rat livers. Biochem. Pharmacol., 59, 1187-1201.
Zhao, A. Z.; Shinohara, M. M.; Huang, D.; Shimizu, M.; Eldar-Finkelman, H.; Krebs, E. G.; Beavo, J. A. and Bornfeldt, K. E. (2000), Leptin induces insulin-like signaling that antagonizes cAMP elevation by glucagon in hepatocytes. J. Biol. Chem.,
15, 11348-11354.