Application of a new bifunctionalized chitosan derivative with
zwitterionic characteristics for the adsorption of Cu
2+
, Co
2+
, Ni
2+
, and
oxyanions of Cr
6+
from aqueous solutions: Kinetic and equilibrium
aspects
Francine Tatiane Rezende de Almeida
a, Bruno Christiano Silva Ferreira
c,d,
Ana Luísa da Silva Lage Moreira
a, Rossimiriam Pereira de Freitas
c, Laurent Frédéric Gil
a,⇑,
Leandro Vinícius Alves Gurgel
b,⇑aGroup of Organic and Environmental Chemistry (GOEQ), Department of Chemistry, Institute of Biological and Exact Sciences, Federal University of Ouro Preto,
Campus Universitário Morro do Cruzeiro, s/n°, Bauxita, 35400-000 Ouro Preto, Minas Gerais, Brazil
bGroup of Physical Organic Chemistry (GPOC), Department of Chemistry, Institute of Biological and Exact Sciences, Federal University of Ouro Preto,
Campus Universitário Morro do Cruzeiro, s/n°, Bauxita, 35400-000 Ouro Preto, Minas Gerais, Brazil
cDepartment of Chemistry, Institute of Exact Sciences (ICEX), Federal University of Minas Gerais, Avenida Antônio Carlos, 6627, Pampulha, 31270-901 Belo Horizonte,
Minas Gerais, Brazil
dDepartamento de Física e Química, Instituto de Ciências Exatas e Informática (ICEI), Pontifícia Universidade Católica de Minas Gerais, Av. Dom José Gaspar,
500, Coração Eucarístico, 30535-901 Belo Horizonte, Minas Gerais, Brazil
h i g h l i g h t s
A new bifunctionalized chitosan (C2)
with zwitterionic characteristics was prepared.
Trimethylation of amine and
esterification of hydroxyls with EDTAD was performed.
C2 was used for the adsorption of
Cu2+, Co2+, Ni2+, and Cr6+in aqueous
solutions.
Qmaxof C2 for Cu2+, Co2+, Ni2+, and
Cr6+were 0.698, 1.125, 0.725, and
1.91 mmol/g.
Desorption (0.1 mol/L HNO3) and
reusability of the C2 adsorbent was also evaluated.
g r a p h i c a l
a b s t r a c t
a r t i c l e
i n f o
Article history:
Received 2 September 2015 Revised 22 November 2015 Accepted 20 December 2015 Available online 21 December 2015
Keywords:
Bifunctionalized chitosan Adsorption
Copper
a b s t r a c t
This study describes the synthesis of a new chitosan derivative (C2) with zwitterionic characteristics and its use for the removal of cationic species Cu2+, Co2+, and Ni2+and anionic species of Cr6+in a single
aque-ous solution. The new adsorbent was synthesized by quaternization of the amine group of chitosan and esterification of hydroxyl groups with EDTA dianhydride. These combined reactions gave both cationic and anionic characteristics to C2 with the release of quaternary ammonium groups and carboxylic groups. The capacity of C2 to adsorb Cu2+, Co2+, Ni2+, and oxyanions of Cr6+was evaluated in a batch
pro-cess with different contact times, pH values, and initial concentrations. Adsorption isotherms were best fitted to the Langmuir and Sips models. The maximum adsorption capacities (Qmax) of C2 for adsorption of
Cu2+, Co2+, Ni2+, and Cr6+were 0.698, 1.125, 0.725, and 1.910 mmol/g, respectively. The
DadsG°values
http://dx.doi.org/10.1016/j.jcis.2015.12.037 0021-9797/Ó2015 Elsevier Inc. All rights reserved.
⇑ Corresponding authors.
E-mail addresses:[email protected](L.F. Gil),[email protected](L.V.A. Gurgel).
Contents lists available atScienceDirect
Journal of Colloid and Interface Science
Cobalt Nickel Chromium Desorption
were in the range from 20 to 28 kJ/mol. These values suggest a mixed mechanism controlling adsorp-tion. Desorption studies using an aqueous solution consisting of 0.1 mol/L HNO3were carried out. The
reusability of the recovered C2 adsorbent after desorption was also evaluated.
Ó2015 Elsevier Inc. All rights reserved.
1. Introduction
Chitosan is a biopolymer obtained from the partial or complete deacetylation of chitin, which is a copolymer of N-acetyl-D -glucosamine andD-glucosamine units linked byb(1?4) glycosidic bonds, whereN-acetyl-D-glucosamine units are predominant in the biopolymer chain [1,2]. Chitin is the second most renewable biopolymer available in nature after cellulose, with annual produc-tion estimated as 1010–1011tons[2]. It is vastly distributed in
nat-ure as a constituent of the exoskeleton of insects, carapaces of crustaceans such as crabs and shrimps[3], fungal cell walls, and algae components [4], which represent the most available raw materials for the industrial production of chitin and chitosan[3]. The isolation of chitin from raw materials consists of three basic steps: deproteinization, demineralization, and decolorization. Chitin is further deacetylated to obtain chitosan. Deacetylation can be performed by both chemical and enzymatic non-continuous batch methods. These methods are extensively used on an industrial scale for the production of chitosan and other derivatives [2]. Thus, chitin and chitosan are very advantageous natural resources when the economical recycling of wastes is con-sidered[2].
The main advantage of chitosan compared to cellulose with respect to the preparation of new derivatives is the presence of a primary amine group at the C-2 position of the pyranosidic ring. This amine group allows the preparation of various new materials with novel chemical properties using different synthesis strategies for new applications[1]. One of these applications is as an adsor-bent material for the removal of heavy metal ions and dyes in cationic and/or anionic forms from water and wastewater. How-ever, chitosan is known to be very sensitive to changes in pH as it can either form a gel or dissolve[1]. Therefore, the chemical modifications of chitosan should always take into account the improvement of its properties such as solubility and swelling with-out decreasing its performance as an adsorbent material for the removal of various pollutants[1].
The production of chitosan derivatives for the treatment of water and wastewater containing metal ions has been extensively investigated by various researchers in recent years[1,5,6,7,8,9,10]. The chemical modifications of chitosan include the grafting of organic ligands containing carboxylic acid, iminoacetic and imin-odiacetic, phosphate, thiol, and quaternary ammonium groups among others capable to form complexes with metallic cations such as Cu2+, Cd2+, Co2+, Cr3+, Cr6+, Hg2+, Ni2+, Pb2+, and Zn2+[6,8]
or interact electrostatically with oxyanions such as HAsO42 , AsO2
[11], CrO42 , and Cr2O72 [12]. Among the numerous chitosan
derivatives synthesized for the removal of heavy metals is uncom-mon to find adsorbent materials with zwitterionic characteristics that have affinity for both cationic and anionic species[13].
The management of hazardous wastes containing heavy metals is of major public concern. The increasing levels of toxic heavy metals in the form of metallic cations and/or oxyanions discharged into the environment have also attracted substantial attention due to the adverse effects on receiving water bodies and living organ-isms[14]. The increasing levels of heavy metals are also a conse-quence of the fast expansion of industrial products such as batteries, electronics, fertilizers, fungicides, metal plating, metals, mining, paints, paper, pesticides, petrochemicals, pigments,
tan-neries, textiles, and preserved wood products[12,15,16]. Although some heavy metals such as Co2+, Cu2+, Ni2+, and Zn2+, among others,
are essential to human life and health, they become detrimental when taken in excess[15,17]. In addition, heavy metals are non-biodegradable and are known to biomagnify and bioaccumulate through the food chain, causing adverse effects to living organisms [15,17]. The adverse effects caused by the intake of excess of heavy metals have been well documented by Klaassen[18].
Various treatment methods such as adsorption, chemical pre-cipitation, electrodialysis, electrochemical, ion exchange, reverse osmosis, precipitation, and ultra- and nanofiltration have been established for the isolation, recovery, and/or elimination of metal ions from water and industrial wastewater[15,17,19]. However, the method to be employed depends on the nature of the heavy metal ions, concentration, pH, the amount of effluent to be treated, treatment performance, investment costs, energy requirements, available area, legislation (quality of the treated effluent), and the production of toxic sludge, among other factors[19]. Adsorption has emerged as one of the more promising alternative treatments in recent years[19]. Some advantages of adsorption are its perfor-mance, ease of operation, the possible use of renewable and biodegradable adsorbents, low energy requirements, capacity to treat very dilute wastewater, recovery and recycling of the adsor-bent, and recovery of heavy metals[19].
This study aimed to produce a new bifunctionalized adsorbent material from chitosan to remove Co2+, Cu2+, Ni2+, and oxyanions
of Cr6+from single aqueous solution and thereby to produce a
ver-satile adsorbent. This new adsorbent was synthesized by quater-nization of amine group of chitosan followed by esterification of hydroxyl groups with EDTA dianhydride (EDTAD). This synthesis strategy provided both cationic and anionic characteristics to the modified chitosan with the release of quaternary ammonium groups and carboxylic acid functions. The adsorption studies were assessed as a function of the contact time (kinetics), solution pH, and initial metal ion concentration.
2. Experimental
2.1. Materials
The starting material was medium molecular weight chitosan (cat. no. 448877; 75–85% deacetylated) and molecular sieve (cat. no. 69839 Fluka), which were purchased from Sigma–Aldrich.N,
N-dimethylformamide (DMF), pyridine, methyl iodide, NaH2PO4,
and Na2HPO4were purchased from Vetec (Brazil). EDTA (disodium
salt) and acetic anhydride were purchased from Synth (Brazil) and used without further purification. Acetone, diethyl ether, ethanol, NaOH, HCl, ClCH2COOH, CH3COOH, CH3COONa, Na2Cr2O7, NaHCO3,
CuSO4.5H2O, CoCl2.6H2O, NiCl2.6H2O were purchased from Synth
(Brazil). Quantitative filter paper (black ribbon, JP 41, cat. no. 3509-1, 12.5 diameter, ash content of 0.00009 g, and grammage of 80 g/cm2) was purchased from JProlab (Brazil). All metal ion
solutions were prepared in deionized water (Millipore, model Milli-QÒ). The molecular sieve 3 Å was previously activated in an
oven at 150°C for 2 h before use. DMF was stored with molecular
sieves before use. Pyridine was refluxed in a round-bottomed flask with NaOH pellets for 12 h and distilled before use.
2.2. Quaternization of amine groups of chitosan
Chitosan (C) (40.0 g; MW = 171.45 g/mol based on degree of deacetylation) was transferred to a 2 L round-bottom flask and 800 mL of DMF and 800 mL of aqueous NaOH solution (0.28 mol/ L) were added. Then, the flask was placed in an ice-water bath at 0°C for 20 min. After cooling the flask, 30 mL (0.482 mol) of CH3I
were slowly added and the suspension was magnetically stirred at 25°C for 48 h (CorningÒ, model PC-420D). The molar ratio of
1:0.96:2.07 for C:NaOH:CH3I was adopted to avoid O-alkylation
of hydroxyl groups at the positions C-3 and C-6 of C[20]. The swol-len quaternized chitosan (C1) was poured into a 5 L Becker con-taining ice-cooled acetone (4 L) under soft magnetic stirring for precipitation. Then, C1 was separated by vacuum filtration using sintered glass Büchner funnel (porosity 3) and washed with ace-tone. The alkylation reaction was performed twice to increase the amount of trialkylated amines in C1. Finally, C1 was dried at 60°C
and stored in a desiccator for subsequent acylation with EDTA dianhydride (EDTAD). The percent weight gain (pwg) and amount of ammonium groups (nNþðCH3Þ3) were determined as described in
Sections2.4.1 and 2.4.2.
2.3. Acylation of quaternized chitosan (C1) with EDTAD
The EDTA dianhydride (EDTAD) was prepared using the method described by Karnitz et al.[21]. C1 (12.63 g) was transferred to a round-bottom flask and 37.9 g of EDTAD (EDTAD-to-C1 ratio = 3:1) and 530 mL of anhydrous DMF (DMF-to-C1 ratio of 42) and 75 g anhydrous calcium chloride were added. The flask was equipped with a reflux condenser attached to a drying tube packed with anhydrous calcium chloride. Then, the flask was placed in an oil bath at 75°C and magnetically stirred for 24 h (CorningÒ, model
PC-420D). At the end of the reaction time, the suspension was sep-arated by vacuum filtration in a sintered glass Büchner funnel (porosity 3) and washed with DMF, deionized water, saturated solution of sodium bicarbonate, deionized water, ethanol, and ace-tone. Then, the bifunctionalized chitosan (C2) was dried in an oven at 80°C for 1 h and left to cool in a desiccator. Thepwgwas
deter-mined as described in Section2.4.1.
2.4. Characterization of the chitosan derivatives
2.4.1. Percent weight gain
The percent weight gain (pwg) for the chemical modifications of C to produce C1 and C2 was calculated using Eq.(1).
pwg=ð%Þ ¼ mf mi
mi
100 ð1Þ
where mf and mi (g) are the weights of the chitosans after and
before chemical modification, respectively.
2.4.2. Determination of the amount of quaternary ammonium groups (nNþðCH3Þ3) of C1
The amount of quaternary ammonium groups (nNþðCH3Þ 3) of C1
was determined by conductimetric titration using the method described by Spinelli et al.[12]. A sample of C1 (200.0 mg) was sus-pended in a 250 mL Becker containing 200 mL of deionized water and an aqueous 0.1 mol/L AgNO3 solution was added
drop-by-drop to form a precipitate of AgI. This test was performed in trip-licate. The amount of quaternary ammonium groups was deter-mined using Eq.(2)as follows:
nNþðCH3Þ
3 .
ðmmol=gÞ ¼CAgNO3VAgNO3
wC1 ð2Þ
whereCAgNO3(mmol/L) is the concentration of aqueous AgNO3
solu-tion,VAgNO3(L) is the volume of aqueous AgNO3solution expended
titrating the amount of iodine ions present in C1, andwC1(g) is the
weight of C1.
2.4.3. Fourier transform infrared spectroscopy (FTIR) analysis
Samples for analyses were prepared mixing 1 mg of dried pow-der of C, C1, or C2 with 100 mg of spectroscopy grade KBr and pressed to obtain 13 mm diameter KBr pellets. The FTIR spectra were recorded on FTIR spectrometer (Shimadzu, model IR-408) with the detector set at a resolution of 4 cm 1 from 500 to
4000 cm 1and 32 scans per sample.
The degree of acetylation (DA) of C was determined by FTIR using Eq.(3)as follows[22]:
DA¼ðA1320=A01420:031330:3822Þ ð3Þ
whereA1320/A1420is the absorbance ratio at 1320 and 1420 cm 1,
respectively.
2.4.4. Elemental analysis
Samples of C, C1, and C2 were previously washed with diethyl ether in a sintered Büchner glass funnel (porosity 3), and dried at 25°C in a desiccator under vacuum for 5 h. Samples were analyzed
on a CHN Perkin Elmer Series II equipment. The analyses were per-formed in duplicate for each sample.
2.4.5. Solid state13C NMR analysis
The solid-state13C NMR spectra of C and C2 were obtained on a
Bruker DRX-400 spectrometer at the frequency of 400 MHz. The acquisition time was 0.034 s. Each spectrum was obtained with an accumulation of 5000 scans.
2.4.6. Point of zero charge (PZC)
The point of zero charge (PZC) for C2 was determined using the mass titration method as described by Noh and Schwarz [23]. Three aqueous 0.01 mol/L NaNO3 solutions with pH values of 3,
6, and 9 were prepared by adjusting the pH of the solutions using aqueous 0.1 mol/L HNO3and 0.1 mol/L NaOH solutions. Four
ali-quots of 10.0 mL were taken from the solutions of different pH and transferred to 50 mL Erlenmeyer flasks. Different amounts of C2 were then added to the Erlenmeyer flasks to give suspensions of 5%, 10%, 30%, and 60% (w/w). The equilibrium pH values were measured after 24 h of shaking at 25°C and 130 rpm using a pH
meter (Hanna Instruments, model HI 223) to obtain the PCZ.
2.5. Adsorption experiments
2.5.1. Effect of the solution pH on metal ion uptake by C2
Adsorption experiments for each metal ion were performed to determine the effect of the solution pH on metal ion adsorption on C2. Samples of 20.0 mg of C2 were weighed into 250 mL Erlen-meyer flasks and 100.0 mL of buffered metal ion solution in each pH were added (100 mg/L for Cu2+, 70 mg/L for Co2+ and Ni2+,
and 25 mg/L for Cr6+). The flasks were incubated at 25°C in a
shak-ing incubator (Tecnal, model TE-424) and stirred at 150 rpm for 6 h for Cu2+, Co2+, and Ni2+and 12 h for Cr6+. These time periods were
enough to attain equilibrium. The pH range studied for adsorption was from 2.0 to 5.5 for Cu2+, from 3.0 to 6.0 for Co2+, from 2.0 to 7.5
for Ni2+, and from 2.0 to 7.5 for Cr6+. The buffer solutions used were
0.1 mol/L ClCH2COOH/ClCH2COONa (from pH 2.0 to 3.5), 0.1 mol/L
CH3COOH/CH3COONa (from pH 3.75 to 5.5), and 0.1 mol/L
NaH2PO4/NaH2PO4 (from pH 6.0 to 9.0). These buffer solutions
precipitation was calculated using the concentration of each metal ion solution and solubility product constant (Ksp) for Co(OH)2
(5.9210 15), Cu(OH)
2(1.810 20), and Ni(OH)2(5.4810 16)
[24]. The adsorption experiments were performed in duplicate. After the equilibrium was reached, the suspensions were filtered off by single filtration (JP-41 filter paper) and the concentration of metal ions was determined by flame atomic absorption spectroscopy (FAAS) (Hitachi, model Z-8200) (kCo= 240.7 mm,
kCu= 324.8 mm, kNi= 232 mm, and kCr= 357.9 mm). The amount
of each metal ion adsorbed on C2 at equilibrium was calculated using Eq.(4)as follows:
qe=ðmg=gÞ ¼ð
Ci CeÞV
wC2 ð4Þ
where CiandCe(mg/L) are the initial and equilibrium metal ion
concentrations,V(L) is the volume of metal ion solution, andwC2
(g) is the weight of C2.
2.5.2. Effect of contact time (kinetics) on metal ion uptake by C2
The uptake of Co2+
, Cu2+, Ni2+, and Cr6+by C2 was studied as a
function of time in order to determine the adsorption kinetics. Sam-ples of 20.0 mg of C2 weighed into cylindrical glasses (1.8 mm height2.2 mm diameter) were added to 250 mL Erlenmeyer with 100.0 mL of buffered metal ion solution (70 mg/L and pH 4.5 for Cu2+, 20 mg/L and pH 4.5 for Co2+and pH 7.5 for Ni2+, and 25 mg/L
and pH 2.0 for Cr6+) previously thermostated at 25°C in a shaking
incubator for 1 h (Tecnal, model TE-424, Piracicaba, SP, Brazil). The buffer solutions used for each pH level were those described in Sec-tion2.5.1. The flasks were shaken under constant stirring at 150 rpm for different time intervals. After each period of time, the suspen-sions were filtered off by single filtration (JP-41 filter paper) and the concentration of metal ions was determined by FAAS, as described in Section2.5.1. The adsorption experiments were made in duplicate. The amount of each metal adsorbed on C2 in each per-iod of time was calculated using Eq.(5)as follows:
qt=ðmg=gÞ ¼ðCiwCtÞV
C2 ð5Þ
whereqt(mg/g) is the amount of metal ion adsorbed on C2 at a time
t,V(L) is the volume of metal ion solution,CiandCt(mg/L) are the
metal ion concentrations at 0 and timet, andwC2(g) is the weight of
C2.
2.5.3. Effect of initial metal ion concentration on metal ions uptake by C2 (adsorption isotherms)
The effect of initial metal ion concentration on metal ion uptake by C2 was performed by varying the initial concentration of metal ion solutions in order to obtain adsorption isotherms. Samples of 20.0 mg of C2 were weighed into 250 mL Erlenmeyer flasks and 100.0 mL of buffered metal ion solutions with concentrations vary-ing from 4.2 to 70 mg/L for Co2+, from 28 to 42 mg/L for Cu2+, from
10.5 to 33.6 mg/L for Ni2+, and from 22 to 100 mg/L for Cr6+were
added to each flask. Adsorption equilibrium times and pH values were those of higher equilibrium adsorption capacity determined by adsorption experiments as a function of solution pH (Sec-tion 2.5.1) (pH 4.5 for Co2+ and Cu2+, 7.5 for Ni2+, and 2.0 for
Cr6+) and time (Section2.5.2) (360 min for Co2+, Cu2+, and Ni2+
and 720 min for Cr6+). The flasks were thermostated at 25°C in a
shaking incubator (Tecnal, model TE-424, Piracicaba, SP, Brazil) for the required time to reach equilibrium. After equilibrium was reached, the suspensions were filtered off by single filtration (JP-41 filter paper) and the concentration of metal ions was deter-mined by FAAS, as described in Section 2.5.1. The equilibrium adsorption capacity was calculated using Eq.(4).
2.6. Desorption
Three samples of 20.0 mg of C2 were loaded with 100.0 mL of buffered metal ion solution with the same metal ion concentra-tions, pH values, and equilibrium adsorption times (360 min for Co2+, Cu2+, and Ni2+and 720 min for Cr6+) previously described in
Section2.5.2. Samples of C2 loaded with each metal ion were fil-tered off by a single filtration, rinsed with an excess of deionized water in order to remove metal ions not adsorbed on C2, and dried at 60°C for 12 h. Two samples of 20.0 mg of C2 loaded with each
metal ion were weighed into 250 mL Erlenmeyer flasks and 100.0 mL of aqueous 0.1 mol/L HNO3 solution was added. The
flasks were placed in a thermostated shaker incubator (Tecnal, model TE-424, Piracicaba, SP, Brazil) at 25°C and 130 rpm for
7 h. Further procedures for separation of the solid and liquid frac-tions and determination of metal ion concentration were those as earlier described in Section2.5.1. The desorption efficiency (Edes)
was calculated using Eq.(6)as follows:
Edes=%¼ Q CeV
T;maxw0C2
100 ð6Þ
whereEdes(%) is the desorption efficiency,Ce(mg/L) is the
equilib-rium metal ion (Mn+) concentration in aqueous desorption solution,
V(L) is the volume of desorption solution,QT,max(mg/g) is the
max-imum adsorption capacity determined by loading metal ions on the C2 before the desorption study, andw0
C2(g) is the weight of the C2
adsorbent contained inwC2,Mn+, which was the weight of the
mate-rial (C2 adsorbent loaded with Mn+) used in the desorption study.
The weight of the C2 adsorbent contained inwC2,Mn+is
calcu-lated using Eq.(7)as follows:
w0
C2=g¼
wC2;MnþwC2
QT;maxwC2
1000
þwC2
ð7Þ
Rearranging and simplifying Eq.(7)yields Eq.(8)as follows:
w0
C2=g¼
wC2;Mnþ QT;max
1000
þ1 ð8Þ
wherewC2,Mn+(g) is the weight of the C2 adsorbent loaded with
metal ions.
2.6.1. Reuse of the C2 adsorbent
Samples of 20.0 mg of C2 (dried in an oven at 60°C for 12 h)
obtained from each desorption study with different metal ions were weighed into 250 mL Erlenmeyer flasks and 100.0 mL of buf-fered metal ion solution with the same metal ion concentration and pH was added as previously described in Section2.5.2. The flasks were transferred to a thermostated shaker incubator at 25°C and 130 rpm and kept for the same time for each metal ion
as described in Section2.6. Further experimental procedures were the same adopted as described in Section2.5.1. The re-adsorption efficiency (RE) of the C2 adsorbent for a new cycle of adsorption was calculated using Eq.(9)as follows:
RE=%¼QRE;max
QT;max
100 ð9Þ
whereRE(%) is the re-adsorption efficiency andQRE,max(mg/g) is
the maximum adsorption capacity redetermined in the re-adsorption study.
The value ofQRE,maxis calculated using Eq.(10)as follows:
QRE;max=ðmg=gÞ ¼
w0
Mnþþw00Mnþ
wC2 ð10Þ
wherew0
Mnþ(mg) is the weight of metal ions not desorbed from the
C2 adsorbent after the desorption study andw00
Mnþ(mg) is the weight
of metal ions adsorbed on the C2 adsorbent in the re-adsorption study.
The values ofw0
Mnþandw00Mnþare calculated using Eqs.(11) and
(12)as follows:
w0
Mnþ¼wC2;Mnþ w0C2ð1 Edes=100Þ 1000 ð11Þ
w00
Mnþ¼ ðCi CeÞV ð12Þ
3. Results and discussion
3.1. Synthesis and characterization of C2
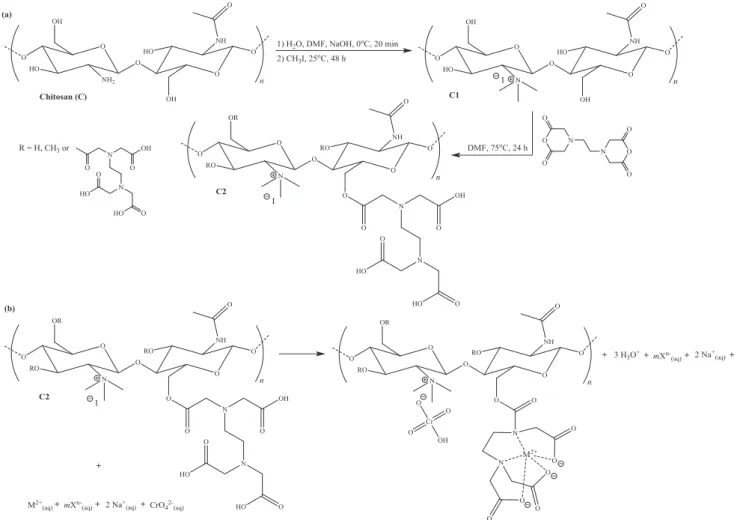
The synthetic route used to produce C2 is presented inFig. 1. In the first step of the synthesis strategy, the medium molecular weight chitosan (C) was treated twice with methyl iodide and NaOH in DMF/H2O (1:1, v/v) at 25°C for 48 h to obtain N,N,N
-trimethyl chitosan (C1), an adsorbent containing positively charged quaternary ammonium groups capable of adsorbing oxyanions through ion exchange. This synthesis condition was used by Rúnarsson et al.[20]to favor significant amounts ofN,N,
N-trimethylation to the detriment ofN-monomethylation andO -methylation. In the second step of the synthetic strategy the C1 was esterified with EDTA dianhydride (EDTAD) in DMF at 75°C
for 24 h to produce bifunctionalized chitosan (C2) containing car-boxylic acid and amine groups capable of adsorbing metal ions in cationic form through ion exchange and complexation.
The degree of acetylation (DA) in the starting chitosan was found to be 24.3% (Section2.4.3). After the quaternization reaction of the amine groups, the amount of quaternary ammonium groups (nNþðCH3Þ3) was found to be 0.494 mmol/g (Section2.4.2), which
cor-responds to aN,N,N-trimethylation degree of 28%. Thepwgafter methylation reaction of chitosan was 85.5% (Section2.4.1). It was not possible to estimate the number of carboxylic acid groups introduced after esterification of C1 with EDTA dianhydride due to the low pKavalues of the EDTA moiety grafted onto C2. The
pwgafter the esterification reaction of C1 with EDTAD was 41.8%. The characterization of C, C1, and C2 was performed by elemen-tal analysis of carbon (C), hydrogen (H), and nitrogen (N) as pre-sented inTable 1. The data of elemental analysis of C, H, and N of C, C1, and C2 showed that the successive chemical modifications of C to produce C2 decreased the nitrogen and hydrogen contents with an increase in the carbon content. These results are in concor-dance with the introduction of methyl groups to produce C1, which increased the carbon content. The introduction of EDTAD on C1 to obtain C2 exhibited the same tendency, as EDTAD has more atoms of carbon (10) than nitrogen (2).
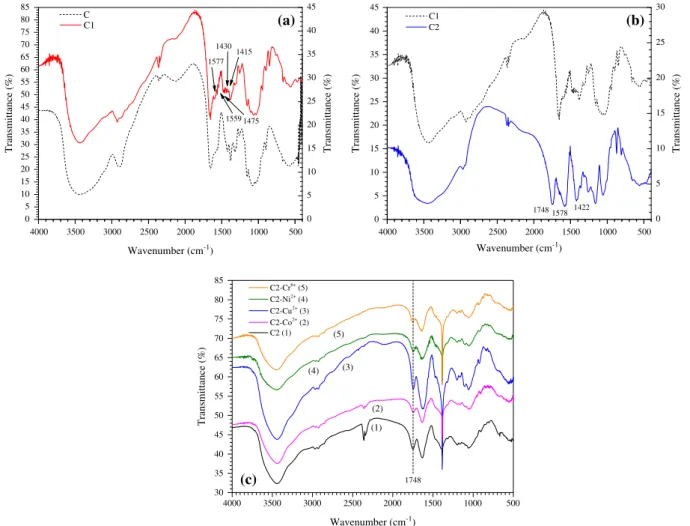
Characterization of C1 and C2 was also accomplished by FTIR spectroscopy. FTIR spectra of C and C1 are shown in Fig. 2a and b. Quaternization reaction of C was demonstrated by the analysis of the FTIR spectrum of C1 (Fig. 2a) in the region between 1200 and 1700 cm 1. The main evidences of
quaterniza-tion of chitosan are: (1) the appearance of the band at 1475 cm 1, which is attributed to the asymmetric angular
defor-mation of CAH bonds of methyl groups[25]. This signal is absent
in the FTIR spectrum of C. (2) The band at 1577 and 1559 cm 1
related to the angular deformation of NAH bond of amine group,
which occurred in both spectra of C and C1; however, these bands were weakened in the spectrum of C1 due to partial methylation of the amine group. (3) The appearance of bands at 1415–1430 cm 1,
which were assigned to the characteristic absorption of NACH3
[25].
FTIR spectra of C1 and C2 are shown inFig. 2b. The comparison between the spectra of C2 and C1 revealed the appearance of a strong band at 1748 cm 1, which can be attributed to axial
defor-mation of the ester bond (AOAC@O) and bands at 1578 and
1422 cm 1, which were attributed to asymmetric and symmetric
axial deformations of carbonyl groups (C@O) of carboxylate ions
(ACOO Na+). The appearance of these new bands related to the
introduction of new carbonyl groups in C2 indicates that the ester-ification of the hydroxyl groups of C1 with EDTAD was accomplished.
FTIR spectra of C2 (unloaded with metal ions) and C2 after des-orption of Co2+, Cu2+, Ni2+, and Cr6+are shown inFig. 2c. The same
infrared bands attributed for C2, which proved the success of chemical modification of C with methyl iodide and EDTAD were
confirmed in the FTIR spectra of the adsorbents after desorption with an aqueous 0.1 mol/L HNO3solution. This means that there
was no ester bond hydrolysis during the desorption process, which could be confirmed by presence of ester band at 1748 cm 1 as
highlighted inFig. 2c.
C and C2 were also characterized by solid-state13C NMR
spec-troscopy. The SS 13C NMR spectra of C and C2 are shown in
Fig. 3a and b. InFig. 3a, the signals at 57.3, 60.9, and 81.8 ppm cor-respond to the carbon atoms at C-2, C-6 and C-4 of pyranosidic ring. The signal at 75.9 ppm can be attributed to C-3 and C-5 with the superposition of signals. The signals at 105.4 and 22.5 ppm can be attributed to C-1 and the methyl of the acetamide group[26], respectively. Quaternization of the amine group at C-2 and esteri-fication of hydroxyl groups at C-3 and C-6 with EDTAD were demonstrated through the analysis of SS13C NMR spectra of C2
(Fig. 3b). The main evidences of C2 formation are the appearance of signals at 30, 50, and 170–175 ppm, which can be attributed to the methyl groups of quaternary ammonium[27], methylene groups between the tertiary amines of the EDTA moiety[28], and the carbon of the carbonyl groups of the ester and carboxylic acid in the EDTA moiety, respectively.
The experimental mass titration curves (figure not shown) for the evaluation of point of zero charge (PZC) for C2 converged to PZC value of 4.8. Therefore, pH values higher than 4.8 should ensure a predominantly negatively charged surface for C2, promot-ing the adsorption of cationic species, while pH values below 4.8 should ensure a predominantly positively charged surface for C2, promoting the adsorption of anionic species.
Table 1
Results of elemental analysis for C, C1, and C2.
Material C (%) H (%) N (%)
C 38.82 7.00 6.63
C1 41.34 6.87 5.19
C2 45.49 5.65 3.05
0 5 10 15 20 25 30 35 40 45 50 55 60 65 70 75 80 85
Transmittance (%)
C
0 5 10 15 20 25 30 35 40 45
1430 1415
1559 1577
C1
Transmittance (%)
(a)
1475
0 5 10 15 20 25 30 35 40 45
Transmittance (%)
C1
(b)
4000 3500 3000 2500 2000 1500 1000 500 4000 3500 3000 2500 2000 1500 1000 500 0 5 10 15 20 25 30
1422 1578
C2
Transmittance (%)
1748
4000 3500 3000 2500 2000 1500 1000 500 30
35 40 45 50 55 60 65 70 75 80 85
(5)
(4) (3)
(2)
Transmittance (%)
C2-Cr6+ (5) C2-Ni2+ (4) C2-Cu2+
(3) C2-Co2+
(2) C2 (1)
(c)
1748(1)
Wavenumber (cm-1) Wavenumber (cm-1)
Wavenumber (cm-1)
Fig. 2.FTIR spectra of (a) C and C1, (b) C1 and C2, and (c) C2 and C2 after desorption of Co2+, Cu2+, Ni2+, and Cr6+(the spectra of C2 and C2 after desorption (c) were vertically shifted by 15%, 15%, +5%, +5%, and +10%).
3.2. Adsorption study of metallic cations Co2+, Cu2+, and Ni2+and
oxyanions of Cr6+on C2 in single aqueous solutions
The studies of the adsorption properties of the C2 adsorbent were performed for each metallic cation and anions in single com-ponent aqueous solutions. The adsorption capacity of C2 was eval-uated as a function of contact time (kinetics), the pH of the solution, and the initial concentration of each metallic cation and anion.
3.2.1. Adsorption kinetics
Adsorption kinetics is one of the most important parameters for the rational design of a wastewater treatment plant for the removal of different pollutants [29]. Experiments to investigate the effect of contact time on the adsorption of Co2+, Cu2+, Ni2+,
and Cr6+on the C2 adsorbent were carried out to determine the
adsorption equilibrium time. The effect of contact time on the adsorption of each metallic cation and oxyanions of Cr6+ on C2
was carried out using buffered adsorbate solutions of known
concentrations (70 mg/L for Cu2+, 20 mg/L for Co2+and Ni2+, and
25 mg/L for Cr6+) at pH values of 4.5 for Co2+ and Cu2+, 7.5 for
Ni2+, and 2.0 for Cr6+at 25°C, 150 rpm, and an adsorbent dose of
0.2 g/L.
The pseudo-first-order kinetic model of Lagergren[30]assumes that the adsorption rate is a function of the adsorption capacity as shown in Eq.(13):
dqt
dt ¼k1ðqe qtÞ ð13Þ
whereqeandqt(mg/g) are the adsorption capacities at equilibrium
teand timet(min) andk1(min 1) is the pseudo-first-order rate
con-stant. Rearranging and integrating Eq.(13)for the boundary condi-tions ofqt= 0 att= 0 andqt=qtatt=tyields Eq.(14)as follows:
qt¼qeð1 exp k1tÞ ð14Þ
controlled by chemical adsorption involving valency forces through sharing or exchange electrons between the adsorbent and the adsorbate as follows in Eq.(15):
dqt
dt ¼k2ðqe qtÞ
2
ð15Þ
where k2 (g/mg min) is the pseudo-second-order rate constant.
Rearranging and integrating Eq.(15)for the boundary conditions ofqt= 0 att= 0 andqt=qtatt=tyields Eq.(16)as follows:
qt¼ k2q2et
1þk2qet ð
16Þ
The experimental kinetic data (see Supplementary Table 1) were modeled by non-linear regression (NLR) using Microcal Origi-nProÒ
2015 software and the pseudo-first- and second-order kinetic models. The software was set to use the Levenberg–Mar-quardt algorithm and the weight method named statistical [Eq. (17)]. In the latter, the weights are used to minimize the chi-square (
v
2) to obtain the best fitted curve. Both the determination coefficient (R2) and reduced chi-square (v
2red) [Eq. (18)] wereadopted to evaluate the quality of the NLR and define the best kinetic model describing the adsorption kinetics.
wi¼y1
i ð17Þ
wherewiis the weighting coefficient andyiis the experimental data
point
v
2 red¼PN
i¼1wiðyi ^yiÞ2
t
ð18Þwhereyˆiis the estimated data point calculated by the model and
t
(N P) is the number of degrees of freedom, which depends on the number of experimental data points (N) and number of variables (P) of the model used for NLR analysis.
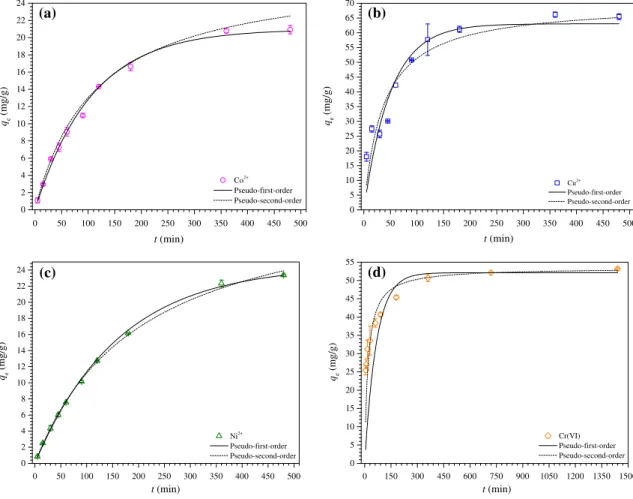
The experimental results of the adsorption study as a function of contact time and the generated curves by the modeling the experimental data with pseudo-first and second-order models are shown inFig. 4a–d.Table 2 presents the results of modeling the experimental data with pseudo-first and second-order kinetic models. As seen in Fig. 4a–d, the adsorption equilibrium time was attained after 360 min for Co2+, Cu2+, and Ni2+ and 720 min
for Cr6+.Table 2also shows that when comparing the values ofq e,-expwith qe,calcand R2 and
v
2redfor both pseudo-first andsecond-order models, it is possible to suggest that the adsorption of Co2+,
Cu2+, and Ni2+ is better described by a pseudo-first-order kinetic
model, whereas the adsorption of Cr6+ is better described by a
pseudo-second-order kinetic model.
3.2.2. Effect of solution pH
The effect of the solution pH on removal of Co2+, Cu2+, Ni2+, and
Cr6+species was evaluated at 25°C, 150 rpm, 0.2 g/L C2 adsorbent,
and 100 mg/L Cu2+, 70 mg/L Co2+and Ni2+, and 25 mg/L Cr6+. The
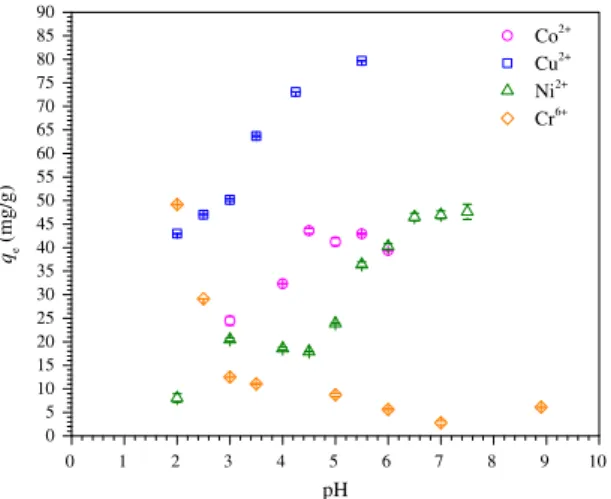
equilibrium times used in these studies are presented inTable 2 and were taken with basis on the kinetic study (Section 3.2.1). Fig. 5 shows the equilibrium adsorption capacity (qe) of Co2+,
Cu2+, Ni2+, and Cr6+on the C2 adsorbent as a function of the
solu-tion pH from 2.0 to 5.5 for Cu2+, from 3.0 to 6.0 for Co2+, from 2.0
to 7.5 for Ni2+, and from 2.0 to 7.5 for Cr6+. The C2 adsorbent
may have amphoteric features as it has permanent positive charges on the quaternary ammonium groups at C-2 of the pyranosidic ring, which are pH-independent, pH-dependent charges of tertiary amine groups on the EDTA moiety (pKavalues of amine groups of
EDTA are equal to 6.13 and 10.37)[32]and non-quaternized amine groups at C-2, and pH-dependent charges on carboxylic groups in the EDTA moiety (the pKavalues of the carboxylic groups of EDTA
are equal to 0.0, 1.5, 2.0, and 2.69)[32]. Due to the speciation of these chemical groups with changes in the solution pH, the pH is one of most important parameters for controlling the adsorption of metallic cationic and/or anionic species in aqueous solution using C2 as the adsorbent. As seen in Fig. 5, the adsorption of metallic cations Co2+, Cu2+, and Ni2+ increased as the pH was
increased and reached a maximum at a pH value of 4.5 for Co2+and
Cu2+and 7.5 for Ni2+. The PZC of the C2 adsorbent was found to be
4.8. Thus, the adsorption of cationic species such as metallic cations was favored at pH > PZC, where the C2 adsorbent has a net negative charge. The high adsorption capacity of C2 at low pH values (pH 2–3) is related to the acidic properties of the imi-noacetate and iminodiacetate groups of the EDTA moiety (the pKavalues of EDTA are equal to 0.0, 1.5, 2.0, and 2.69). The
perma-nent positive charges of the quaternary ammonium groups at C-2 do not seem to have reduced the adsorption capacity of metallic cationic species on the C2 adsorbent. This result may be explained by the high affinity of the EDTA moiety for complex metallic cations, which has been previously demonstrated[21]by investi-gating the adsorption of Cd2+, Cu2+, and Pb2+on mercerized
cellu-lose and mercerized sugarcane bagasse chemically modified with EDTAD.
The oxyanions of Cr6+ may be present in aqueous solution in
neutral and/or anionic forms as a function of the solution pH, ionic strength, and concentration, as described by the following equilib-ria[33]:
H2CrO4þH2O H3OþþHCrO4 ðK¼4:1Þ
HCrO4þH2O H3OþþCrO24 ðK¼10 5:9Þ
2HCrO4 Cr2O27 þH2Oþ ðK¼10 2:2Þ
HCr2O7þH2O H3OþþCr2O2
7 ðK¼10 8
:5
Þ
Supplementary Fig. 1shows the speciation diagram for species of oxyanions of Cr6+as a function of the solution pH (ionic strength
of 0.1 mol/L and 25 mg/L or 0.48 mmol/L Cr(VI)) calculated using Hydra and Medusa software. At pH values from 2 to 5, HCrO4
and Cr2O72 are the main species in equilibrium with a
predomi-nance of HCrO4 over Cr2O72 . At pH values lower than 1, H2CrO4
and HCrO4are the predominant species. At pH 6, HCrO4and CrO42
are in equilibrium with the fraction of both species being close to 50%. At pH values higher than 7, CrO42 is the predominant form
[34]. As seen inFig. 5, the adsorption of oxyanions of Cr6+increased
as the pH was decreased and reached a maximum at pH close to 2. In this condition, tertiary amines of the EDTA moiety and non-quaternized amines at C-2 are protonated and positively charged, contributing to the adsorption of oxyanions of Cr6+through
elec-trostatic interactions, while the quaternary ammonium groups at C-2 with permanent positive charges also contribute to increase the adsorption of oxyanions of Cr6+through an ion exchange
pro-cess with the consequent release of I to the aqueous solution. The explanation for the decrease in the adsorption capacity as the pH was increased is related to the partial deprotonation of ter-tiary amines of the EDTA moiety and non-quaternized amines at C-2 and an increase in the presence of CrO42 species above pH 5,
which requires two positively charged adsorption sites to be adsorbed by the C2 adsorbent. These results agree with the value of PZC.
3.2.3. Adsorption isotherms
used isotherms were chosen to evaluate the equilibrium adsorp-tion data: the Langmuir, Freundlich, and Langmuir–Freundlich (Sips) isotherms.
The Langmuir[36]isotherm theory assumes the formation of a monolayer of adsorbate on the homogeneous surface of the adsor-bent. In addition, adsorption occurs at specific sites on the homo-geneous surface of the adsorbent. Once an adsorbate occupies a site, there can be no adsorption there. The Langmuir isotherm can be presented by Eq.(19)as follows:
qe¼QmaxbCe
1þbCe ð19Þ
whereqe(mg/g) is the equilibrium adsorption capacity,Qmax(mg/g)
is the maximum amount of adsorbate per unit weight of the C2 to form a complete monolayer coverage on the surface bound at a high equilibrium adsorbate concentration,Ce(mg/L), andb(L/mg) is the
Langmuir constant related to the affinity of the adsorbate at the binding sites.
0 2 4 6 8 10 12 14 16 18 20 22 24
Co2+ Pseudo-first-order Pseudo-second-order qe
(mg/g)
t (min)
(a)
0 50 100 150 200 250 300 350 400 450 500 0 50 100 150 200 250 300 350 400 450 500 0
5 10 15 20 25 30 35 40 45 50 55 60 65 70
Cu2+ Pseudo-first-order Pseudo-second-order qe
(mg/g)
t (min)
(b)
0 2 4 6 8 10 12 14 16 18 20 22 24
Ni2+ Pseudo-first-order Pseudo-second-order qe
(mg/g)
t (min)
(c)
0 50 100 150 200 250 300 350 400 450 500 0 150 300 450 600 750 900 1050 1200 1350 1500 0
5 10 15 20 25 30 35 40 45 50 55
Cr(VI) Pseudo-first-order Pseudo-second-order qe
(mg/g)
t (min)
(d)
Fig. 4.Effect of contact time on adsorption of (a) Co2+, (b) Cu2+, (c) Ni2+, and (d) Cr6+on C2 at 25°C, 150 rpm, 0.2 g/L C2, pH 4.5 for Co2+and Cu2+, 7.5 for Ni2+, and 2.0 for Cr6+, and 20 mg/L for Co2+and Ni2+, 70 mg/L for Cu2+, and 25 mg/L for Cr6+.
Table 2
Modeled kinetic parameters for the adsorption of Co2+, Cu2+, Ni2+, and Cr6+on C2.
Parameters Co2+ Cu2+ Ni2+ Cr6+
Ci,Mn+(mg/L) 20 70 20 25
te(min) 360 360 360 720
pH 4.5 4.5 7.5 2.0
qe,exp(mg/g) 20.85 ± 0.10 65.82 ± 0.49 22.86 ± 0.73 52.64 ± 0.75
qe,exp(mmol/g) 0.354 ± 0.002 1.036 ± 0.008 0.389 ± 0.012 1.012 ± 0.014
Pseudo-first-order
k1(min1) (9.43 ± 0.54)10 3 (2.00 ± 0.50)10 2 (6.20 ± 0.24)10 3 (1.50 ± 0.32)10 2
qe,calc(mg/g) 20.98 ± 0.61 63.06 ± 6.19 24.61 ± 0.53 52.11 ± 0.28
qe,calc(mmol/g) 0.356 ± 0.010 0.992 ± 0.097 0.419 ± 0.009 1.002 ± 0.005
R2 0.9954 0.7799 0.9984 0.5340
v2
red 0.0304 1.8690 0.0113 94.9571
Pseudo-second-order
k2(g/mg.min) (3.17 ± 0.44)10 4 (3.91 ± 1.56)104 (1.43 ± 0.01)10 4 (1.00 ± 0.28)10 3
qe,calc(mg/g) 27.83 ± 1.25 70.11 ± 7.22 34.10 ± 0.81 53.45 ± 0.41
qe,calc(mmol/g) 0.472 ± 0.021 1.103 ± 0.114 0.581 ± 0.014 1.028 ± 0.008
R2 0.9964 0.8345 0.9990 0.8319
One of the essential characteristics of the Langmuir isotherm can be expressed by a separation factor,RL; which is defined by
Eq.(20)as follows:
RL¼1 1
þbCi ð20Þ
whereCiis the initial concentration of adsorbate. The value ofRL
indicates if an isotherm is irreversible (RL= 0), favorable
(0 <RL< 1), linear (RL= 1), or unfavorable (RL> 1).
The Freundlich[37]isotherm is an empirical equation which is applicable to adsorption on heterogeneous surfaces and is not restricted to the formation of a monolayer. It assumes that an increase in the adsorbate concentration also increases the amount of the adsorbate adsorbed on the surface. It can be represented by Eq.(21)as follows:
qe¼KFC1e=n ð21Þ
whereKF[mg/g(L/mg)1/n] andnare the Freundlich constants. The
parameternis usually greater than unity and it is related to the adsorption intensity.
Sips [38] recognized the problem of the continuing, infinite increase in adsorption capacity with increasing the concentration of the adsorbate in the Freundlich isotherm. Thus, Sips proposed an isotherm equation similar in form to the Freundlich isotherm, but with a finite limit when the concentration is sufficiently high, as shown in Eq.(22):
qe¼Qmax ðbCeÞ
1=n
1þðbCeÞ1=n ð
22Þ
The Langmuir–Freundlich (Sips) isotherm resembles the Lang-muir isotherm. The difference between the Sips and LangLang-muir iso-therms is the additional parameternin the Sips isotherm. If the parameternis unity, the Sips isotherm reduces to the Langmuir isotherm and is applicable to ideal surfaces. Thus, the parameter
ncan be considered as a parameter characterizing the heterogene-ity of the adsorption system.
The change in free energy (DadsG°) of an adsorption system can
be calculated using Eq.(23)as follows:
D
adsG
¼ RTlnKa ð23Þ
whereKais the thermodynamic equilibrium constant
(dimension-less), T (K) is the absolute temperature, andR (8.314 J/K mol) is the ideal gas constant.
The thermodynamic equilibrium constant can be calculated from the Langmuir constant,b, using the approach suggested by Liu[39]in Eq.(24)as follows:
Ka¼ b
c
eð1 mol=LÞ
ð24Þ
where
c
eis the activity coefficient in the equilibrium(dimension-less) at 25°C.
If the adsorbate is a metallic ion, the activity coefficient is strongly affected and it sharply decreases as the ionic strength increases. Therefore, it is fundamental to correct the activity coef-ficient for each adsorption system using the extended Debye Hückel law [Eq.(25)] to provide a correct calculation ofDadsG°as
follows[39]:
log
c
e¼0:509z2 ffiffiffiffiI
e
p
1þ
a
ffiffiffiffiffiffiffiffiffiffiffiffiffiffiffiIe=305
p ð25Þ
wherez is the charge of the metallic ion,Ie(mol/L) is the ionic
strength, and
a
(pm) is the hydrated ion size (600 pm for Co2+,Cu2+, and Ni2+ and 900 pm for oxyanions of Cr6+) [40]. The ionic
strength was calculated taking into account the first equilibrium concentration data point of the plateau of the adsorption isotherms [41].
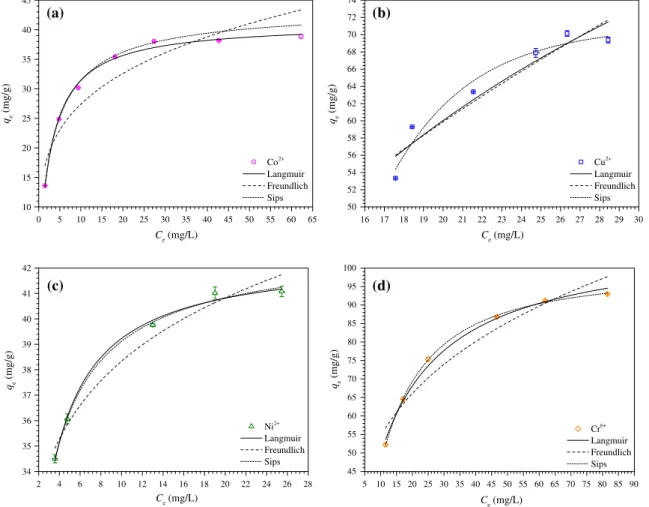
The isotherms for the adsorption of Co2+, Cu2+, Ni2+, and
oxyan-ions of Cr6+on C2 at 25°C, 150 rpm, 0.2 g/L C2, pH 4.5 for Co2+and
Cu2+, 7.5 for Ni2+, and 2.0 for Cr6+, and 360 min of contact time for
Co2+, Cu2+, and Ni2+ and 720 min for oxyanions of Cr6+ are
pre-sented inFig. 6a–d. The adsorption isotherms were modeled by NLR analysis of the experimental data (Supplementary Table 2) using Microcal OriginÒ 2015 software and the isotherm models
of Langmuir, Freundlich, and Sips. The isotherm model parameters were found by minimizing the
v
2red. The routines used to model theexperimental data using the isotherm models were the same as those described in Section3.2.1.Table 3shows the results. As seen inTable 3, the values ofRLfor all adsorption systems were between
0 and 1, indicating that the adsorption isotherms of Co2+, Cu2+, Ni2+,
and oxyanions of Cr6+on C2 were favorable.
As seen inTable 3, considering the values ofQmax,exp,R2, and
v
2redand the shape of the isotherm curves presented inFig. 6a–d,the adsorption of Co2+and Ni2+was best described by the Langmuir
model, while the adsorption of Cu2+and oxyanions of Cr6+was best
described by the Sips model. The parameternof the Sips model also suggests that the adsorption system involving the adsorption of Cu2+
and oxyanions of Cr6+ on C2 adsorbent are more heterogeneous,
whereas the value ofnfor the adsorption of Co2+ and Ni2+on C2
demonstrates that these adsorption systems are more Langmuirian than Freundlichian, i.e. less heterogeneous. In fact, the C2 adsorbent has a heterogeneous surface, as the sites of adsorption are mostly composed of carboxylic, tertiary amine, and quaternary ammonium groups. Thus, the surface of the C2 adsorbent is not comprised of adsorption sites with identical energy and affinity to the different types of adsorbates studied. Thus, although the Langmuir model failed to completely describe the adsorption systems studied, its use is valid to estimate the adsorption constants for comparison pur-poses. Furthermore, the deviations may be computed using the Sips model through the evaluation of the value of the parametern.
According to the equilibrium experimental adsorption data and the Langmuir and Sips models, the experimental maximum adsorption capacity (Qmax,exp) and calculated maximum adsorption
capacity (Qmax) for the C2 adsorbent were in the following order
Cr6+
Cu2+> Ni2+> Co2+. These results demonstrate the efficacy
of the C2 adsorbent to remove both inorganic cationic and anionic species from aqueous solutions.
The Pearson parameters (d) for Co2+, Ni2+, and Cu2+are 0.130,
0.126, and 0.104[42], respectively. Thus, the hardness order of 0 1 2 3 4 5 6 7 8 9 10
0 5 10 15 20 25 30 35 40 45 50 55 60 65 70 75 80 85 90
Co2+
Cu2+
Ni2+ Cr6+
qe
(mg/g)
pH
Fig. 5.Effect of the solution pH on adsorption of Co2+, Cu2+, Ni2+, and Cr6+on C2 at 25°C, 150 rpm, 0.2 g/L C2, 70 mg/L Co2+and Ni2+, 100 mg/L Cu2+, and 25 mg/L Cr6+, and 360 min of contact time for Co2+, Cu2+, and Ni2+and 720 min for Cr6+.
10 15 20 25 30 35 40 45
Co2+
Langmuir Freundlich Sips
qe
(mg/g)
C
e (mg/L)
(a)
0 5 10 15 20 25 30 35 40 45 50 55 60 65 16 17 18 19 20 21 22 23 24 25 26 27 28 29 30 50
52 54 56 58 60 62 64 66 68 70 72 74
Cu2+
Langmuir Freundlich Sips
qe
(mg/g)
C
e (mg/L)
(b)
34 35 36 37 38 39 40 41 42
Ni2+
Langmuir Freundlich Sips
qe
(mg/g)
Ce (mg/L)
(c)
2 4 6 8 10 12 14 16 18 20 22 24 26 28 5 10 15 20 25 30 35 40 45 50 55 60 65 70 75 80 85 90 45
50 55 60 65 70 75 80 85 90 95 100
Cr6+
Langmuir Freundlich Sips
qe
(mg/g)
Ce (mg/L)
(d)
Fig. 6.Adsorption isotherms for (a) Co2+, (b) Cu2+, (c) Ni2+, and Cr6+on C2 at 25°C, 150 rpm, 0.2 g/L C2, pH 4.5 for Co2+and Cu2+, 7.5 for Ni2+, and 2.0 for Cr6+, and 360 min of contact time for Co2+, Cu2+, and Ni2+and 720 min for Cr6+.
Table 3
Modeled isotherm parameters for the adsorption of Co2+, Cu2+, Ni2+, and Cr6+on C2 adsorbent.
Co2+ Cu2+ Ni2+ Cr6+
Qmax,exp(mg/g) 37.15 ± 2.46 69.75 ± 0.54 41.04 ± 0.05 92.09 ± 1.28
Qmax,exp(mmol/g) 0.630 ± 0.042 1.098 ± 0.008 0.699 ± 0.001 1.771 ± 0.025
pH 4.5 4.5 7.5 2.0
te(min) 360 360 360 720
Ie(mol/L) 0.1022 0.1012 0.4010 0.4011
ce 0.882 0.882 0.878 0.978
Langmuir
Qmax(mg/g) 41.15 ± 0.45 130.38 ± 20.52 42.53 ± 0.18 108.22 ± 1.89
Qmax(mmol/g) 0.698 ± 0.008 2.052 ± 0.323 0.725 ± 0.003 2.081 ± 0.036
b(L/mg) 0.323 ± 0.015 0.043 ± 0.013 1.189 ± 0.047 0.085 ± 0.005
b(L/mol) 19047.3 ± 855.6 2711.2 ± 841.6 69771.4 ± 2737.9 4413.7 ± 265.1
R2 0.9972 0.9004 0.9954 0.9927
v2
red 0.0119 0.0725 0.0011 0.0283
RL 0.424–0.042 0.456–0.358 0.074–0.024 0.349–0.105
Ka 21584.9 ± 969.6 3072.2 ± 953.6 79494.1 ± 3119.4 4509.3 ± 270.9
DadsG°(kJ/mol) 24.74 ± 1.11 19.91 ± 6.18 27.97 ± 1.10 20.86 ± 1.25
Freundlich
KF[mg/g(L/mg)1/n] 15.37 ± 2.02 12.88 ± 3.36 31.09 ± 0.69 28.71 ± 3.74
n 3.984 ± 0.664 1.949 ± 0.319 10.995 ± 1.076 3.594 ± 0.461
R2 0.8845 0.8851 0.9640 0.9287
v2red 0.4966 0.0837 0.0088 0.2777
Sips
Qmax(mg/g) 43.86 ± 0.68 71.48 ± 3.30 43.11 ± 1.19 99.32 ± 0.88
Qmax(mmol/g) 0.744 ± 0.012 1.125 ± 0.052 0.735 ± 0.020 1.910 ± 0.017
b(L/mg) 0.278 ± 0.012 0.071 ± 0.006 1.376 ± 0.368 0.093 ± 0.001
b(L/mol) 16402.2 ± 676.7 4490.0 ± 354.7 80748.8 ± 21591.5 4852.2 ± 57.4
n 1.104 ± 0.035 0.187 ± 0.086 1.149 ± 0.289 0.746 ± 0.026
R2 0.9993 0.9426 0.9941 0.9995
v2
the metal ions is in the order Co2+> Ni2+> Cu2+. The carboxylic and
amine groups of the grafted EDTA moiety and non-quaternized amine groups at C-2 of the pyranosidic ring on the C2 adsorbent behave as hard bases. From the point of view of the hard and soft acid base (HSAB) concept, these ligands should exhibit a preference for hard acid metal ions following the hardness order Co2+>
-Ni2+> Cu2+. However, according to the series of Irving and Williams
[43], which discusses the relative stabilities of complexes formed by metal ions with various ligands, carboxylic and amines form more stable complexes with the studied metal ions in the follow-ing stability order Cu2+> Ni2+> Co2+. This order may also be
explained by the general stability sequence of high spin octahedral metal ion complexes using the Irving–Williams series concept[43]. Therefore, the results ofQmaxobtained in this study are in good
agreement with the concept of Irving and Williams.
The values of DadsG° for adsorption of Co2+, Cu2+, Ni2+, and
oxyanions of Cr6+are in the range from 20 to 28 kJ/mol. It is
suggested that a mixed mechanism may be controlling the uptake of Co2+, Cu2+, Ni2+, and oxyanions of Cr6+on the C2 adsorbent from
aqueous solutions. As seen in Fig. 1, the process of removing oxyanions of Cr6+ from aqueous solution is suggested to be ion
exchange, where an iodine anion is exchanged by an oxyanion of Cr6+. In addition, the non-quaternized nitrogen atoms at the C-2
position of the pyranosidic ring and tertiary amines of the EDTA moiety may remove Co2+, Cu2+, and Ni2+ions from aqueous
solu-tion through complexasolu-tion, while the carboxylic groups of the EDTA moiety may remove Co2+, Cu2+, and Ni2+ions from aqueous
solution through ion exchange, where a sodium or a hydronium ion may be exchanged by a metal ion.
3.3. Desorption and reuse of the C2 adsorbent
The desorption efficiencies (Edes) for Co2+, Cu2+, Ni2+, and Cr6+
were 86.7, 22.4, 31.2, and 46.9%. Therefore,Edespresented the
fol-lowing order Co2+> Cr6+> Ni2+> Cu2+. This means that Cu2+ and
Ni2+are strongly complexed by EDTA moiety on the C2 adsorbent,
thereby making it difficult to desorb. In contrast, Co2+was easier
desorbed in comparison with Cu2+and Ni2+. The mechanism of
des-orption of Co2+, Cu2+, and Ni2+ is expected to be ion exchange,
where Co2+, Cu2+, or Ni2+ions are exchanged by hydronium ions.
It seems that the stability constant (b) for the formation of a com-plex between EDTA moiety and metal ions is the limiting factor hampering an extensive desorption of Cu2+and Ni2+.
The desorption mechanism of oxyanions of Cr6+is also expected
to be ion exchange. However, in this case oxyanions of Cr6+such as
HCrO4 and Cr2O72 , are exchanged by nitrate ions (NO3). These
results demonstrated that one type of desorption solution could be used to desorb both metal cations and oxyanions of Cr6+,
thereby decreasing the costs for desorption and recovery of both the C2 adsorbent and adsorbates.
The re-adsorption efficiencies (RE) for Co2+, Cu2+, Ni2+, and Cr6+
were 87.0, 112.4, 113.0, and 141.7%. It is noticed thatREfor Co2+is
less than 100%, which means that the C2 adsorbent lost part of its adsorption capacity for Co2+after the first cycle of
adsorption–des-orption. However, theREfor Cu2+, Ni2+, and Cr6+were higher than
100%, which means that the C2 adsorbent is capable of adsorbing more Cu2+, Ni2+, and Cr6+after one cycle of adsorption–desorption.
It seems that after the first cycle of adsorption–desorption the sur-face of the C2 adsorbent presents more affinity for these metal ions and oxyanions. These results demonstrated that even the C2 adsor-bent is not being fully desorbed it may be recovered and reused in a new cycle of adsorption as it still presents ability to adsorb metal ions and oxyanions of Cr6+.
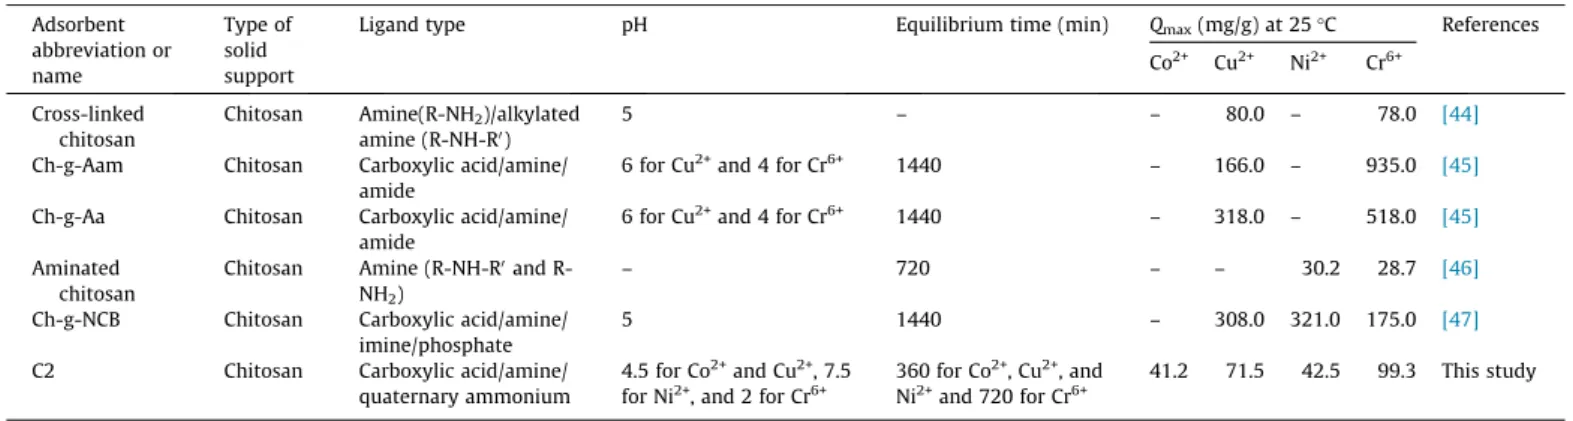
3.4. Comparison of the C2 adsorbent with other adsorbents available in the literature for the same purpose
Table 4shows various adsorbent materials prepared from chi-tosan using different synthesis/modifications strategies for the removal of Co2+, Cu2+, Ni2+, and Cr6+ from aqueous solutions in
batch mode for comparison purposes. Comparing the C2 adsorbent with some previously reported adsorbents in the literature, it is possible to suggest that C2 has some advantages and disadvan-tages. The main disadvantage is the smaller adsorption capacity in comparison with Ch-g-Aam, Ch-g-Aa, and Ch-g-NCB adsorbents, while the major advantages are the versatility of C2 to adsorb a reasonable amount of Co2+, Cu2+, Ni2+, and Cr6+in a larger pH range
and with shorter equilibrium times due to the chemical character-istics of the groups grafted onto C2.
4. Conclusions
Chitosan was successfully modified with methyl iodide and EDTA dianhydride to produce a new bifunctionalized adsorbent (C2) capable of removing cationic and anionic species by adsorp-tion. C2 was characterized by elemental analysis, FTIR, and SS13C
NMR. The C2 adsorbent was effective in removing Co2+, Cu2+,
Ni2+, and oxyanions of Cr6+from aqueous solutions. The adsorption
of Co2+, Cu2+, and Ni2+ followed the pseudo-first-order kinetic
model, while the adsorption of oxyanions of Cr6+ followed the
pseudo-second-order model. The equilibrium adsorption times were found to be 360 min for Co2+, Cu2+, and Ni2+ and 720 min
for oxyanions of Cr6+. The adsorption isotherms of Co2+and Ni2+
were best described by the Langmuir model, whereas the iso-therms of Cu2+and oxyanions of Cr6+were best described by the
Sips model. The maximum adsorption capacities (Qmax) were
Table 4
Comparison ofQmaxfor removal of Co2+, Cu2+, Ni2+, and Cr6+by various modified chitosan adsorbents reported in the literature.
Adsorbent abbreviation or name
Type of solid support
Ligand type pH Equilibrium time (min) Qmax(mg/g) at 25°C References
Co2+ Cu2+ Ni2+ Cr6+
Cross-linked chitosan
Chitosan Amine(R-NH2)/alkylated amine (R-NH-R0)
5 – – 80.0 – 78.0 [44]
Ch-g-Aam Chitosan Carboxylic acid/amine/ amide
6 for Cu2+and 4 for Cr6+ 1440 – 166.0 – 935.0 [45]
Ch-g-Aa Chitosan Carboxylic acid/amine/ amide
6 for Cu2+and 4 for Cr6+ 1440 – 318.0 – 518.0 [45]
Aminated chitosan
Chitosan Amine (R-NH-R0and R-NH2)
– 720 – – 30.2 28.7 [46]
Ch-g-NCB Chitosan Carboxylic acid/amine/ imine/phosphate
5 1440 – 308.0 321.0 175.0 [47]
C2 Chitosan Carboxylic acid/amine/
quaternary ammonium
4.5 for Co2+and Cu2+, 7.5 for Ni2+, and 2 for Cr6+
360 for Co2+, Cu2+, and Ni2+and 720 for Cr6+
41.2 71.5 42.5 99.3 This study
0.698, 1.125, 0.725, and 1.910 mmol/g for Co2+, Cu2+, Ni2+, and Cr6+,
respectively. TheDadsG°were in the range from 20 to 28 kJ/mol.
C2 adsorbents loaded with Co2+, Cu2+, Ni2+and Cr6+were desorbed
with 0.1 mol/L HNO3. The desorption efficiencies were 86.7%,
22.4%, 31.2%, and 46.9%. C2 adsorbents were recovered and sub-jected to re-adsorption studies, which showed that these adsor-bents can still adsorb both metallic cations and oxyanions of Cr6+
with certain efficiency.
Acknowledgments
The authors are grateful to Universidade Federal de Ouro Preto (UFOP), Universidade Federal de Minas Gerais (UFMG), Fundação de Amparo à Pesquisa do Estado de Minas Gerais (FAPEMIG Grant Numbers CEX APQ-01945/13 and CEX APQ-01764/14), and Con-selho Nacional de desenvolvimento Científico (CNPq Grant Num-ber 448346/2014-1) for funding this research. The authors are also grateful to Coordenação de Aperfeiçoamento de Pessoal de Nível Superior (CAPES) (for a doctoral scholarship awarded to B. C.S. Ferreira) and FAPEMIG (for an undergraduate scholarship awarded to A.L.S.L. Moreira).
Appendix A. Supplementary material
Supplementary data associated with this article can be found, in the online version, athttp://dx.doi.org/10.1016/j.jcis.2015.12.037.
References
[1]W.S. Wan Ngah, L.C. Teong, M.A.K.M. Hanafiah, Adsorption of dyes and heavy
metal ions by chitosan composites: a review, Carbohydr. Polym. 83 (4) (2011)
1446–1456.
[2]S.K. Kim, Chitin, Chitosan, Oligosaccharides and Their Derivatives: Biological
Activities and Applications, CRC Press, New York, USA, 2010.
[3]E.P. Ageev, N.N. Matushkina, Peculiarities of the transport properties of
chitosan films. 1. Concentration prehistory of pervaporation, Colloid J. 77 (3)
(2015) 251–255.
[4]Z. Hao, Y. Cai, X. Liao, X. Zhang, Z. Fang, D. Zhang, Optimization of nutrition
factors on chitinase production from a newly isolated Chitiolyticbacter
meiyuanensis SYBC-H1, Braz. J. Microbiol. 43 (1) (2012) 177–186.
[5]F.-C. Wu, R.-L. Tseng, R.-S. Juang, A review and experimental verification of
using chitosan and its derivatives as adsorbents for selected heavy metals, J.
Environ. Manage. 91 (4) (2010) 798–806.
[6]A.J. Varma, S.V. Deshpande, J.F. Kennedy, Metal complexation by chitosan and
its derivatives: a review, Carbohydr. Polym. 55 (1) (2004) 77–93.
[7]C. Gerente, V.K.C. Lee, P.L. Cloirec, G. McKay, Application of chitosan for the
removal of metals from wastewaters by adsorption—mechanisms and models
review, Crit. Rev. Environ. Sci. Technol. 37 (1) (2007) 41–127.
[8]P. Miretzky, A.F. Cirelli, Hg(II) removal from water by chitosan and chitosan
derivatives: a review, J. Hazard. Mater. 167 (1–3) (2009) 10–23.
[9]A. Bhatnagar, M. Sillanpää, Applications of chitin- and chitosan-derivatives for
the detoxification of water and wastewater—a short review, Adv. Colloid
Interface Sci. 152 (1–2) (2009) 26–38.
[10]G.Z. Kyzas, D.N. Bikiaris, Recent modifications of chitosan for adsorption
applications: a critical and systematic review, Mar. Drugs 13 (1) (2015) 312–
337.
[11]V.M. Boddu, K. Abburi, J.L. Talbott, E.D. Smith, R. Haasch, Removal of arsenic
(III) and arsenic (V) from aqueous medium using chitosan-coated biosorbent,
Water Res. 42 (3) (2008) 633–642.
[12]V.A. Spinelli, M.C.M. Laranjeira, V.T. Fávere, Preparation and characterization
of quaternary chitosan salt: adsorption equilibrium of chromium(VI) ion,
React. Funct. Polym. 61 (3) (2004) 347–352.
[13]W.E. Marshall, L.H. Wartelle, Chromate (CrO42) and copper (Cu2+) adsorption
by dual-functional ion exchange resins made from agricultural by-products,
Water Res. 40 (13) (2006) 2541–2548.
[14]R. Laus, T.G. Costa, B. Szpoganicz, V.T. Fávere, Adsorption and desorption of Cu
(II), Cd(II) and Pb(II) ions using chitosan crosslinked with epichlorohydrin–
triphosphate as the adsorbent, J. Hazard. Mater. 183 (1–3) (2010) 233–241.
[15]P.O. Boamah, Y. Huang, M. Hua, Q. Zhang, J. Wu, J. Onumah, L.K. Sam-Amoah, P.
O. Boamah, Sorption of heavy metal ions onto carboxylate chitosan
derivatives—a mini-review, Ecotoxicol. Environ. Saf. 116 (2015) 113–120.
[16]M. Salman, M. Athar, U. Farooq, Biosorption of heavy metals from aqueous
solutions using indigenous and modified lignocellulosic materials, Rev.
Environ. Sci. Bio/Technol. (2015) 1–18.
[17]F. Fu, Q. Wang, Removal of heavy metal ions from wastewaters: a review, J.
Environ. Manage. 92 (3) (2011) 407–418.
[18]C. Klaassen, Casarett & Doull’s Toxicology: The Basic Science of Poisons: The
Basic Science of Poisons, McGraw-Hill, New York, 2008.
[19]M.A. Barakat, New trends in removing heavy metals from industrial
wastewater, Arab. J. Chem. 4 (4) (2011) 361–377.
[20] Ö.V. Rúnarsson, J. Holappa, T. Nevalainen, M. Hjálmarsdóttir, T. Järvinen, T.
Loftsson, J.M. Einarsson, S. Jónsdóttir, M. Valdimarsdóttir, M. Másson, Antibacterial activity of methylated chitosan and chitooligomer derivatives: synthesis and structure activity relationships, Eur. Polym. J. 43 (6) (2007)
2660–2671.
[21]O. Karnitz, L.V.A. Gurgel, R.P. de Freitas, L.F. Gil, Adsorption of Cu(II), Cd(II), and
Pb(II) from aqueous single metal solutions by mercerized cellulose and mercerized sugarcane bagasse chemically modified with EDTA dianhydride
(EDTAD), Carbohydr. Polym. 77 (3) (2009) 643–650.
[22]J. Brugnerotto, J. Lizardi, F. Goycoolea, W. Argüelles-Monal, J. Desbrieres, M.
Rinaudo, An infrared investigation in relation with chitin and chitosan
characterization, Polymer 42 (8) (2001) 3569–3580.
[23]J.S. Noh, J.A. Schwarz, Effect of HNO3 treatment on the surface-acidity of
activated carbons, Carbon 28 (5) (1990) 675–682.
[24]W.M. Haynes, CRC Handbook of Chemistry and Physics, Taylor & Francis, 2014.
[25]V.K. Mourya, N. Inamdar, Trimethyl chitosan and its applications in drug
delivery, J. Mater. Sci.: Mater. Med. 20 (5) (2009) 1057–1079.
[26]I. Kavianinia, P.G. Plieger, N.G. Kandile, D.R.K. Harding, Fixed-bed column
studies on a modified chitosan hydrogel for detoxification of aqueous
solutions from copper (II), Carbohydr. Polym. 90 (2) (2012) 875–886.
[27]V. Balsamo, F. López-Carrasquero, E. Laredo, K. Conto, J. Contreras, J.L. Feijoo,
Preparation and thermal stability of carboxymethyl starch/quaternary
ammonium salts complexes, Carbohydr. Polym. 83 (4) (2011) 1680–1689.
[28]S. Aime, R. Gobetto, R. Nano, E. Santucci,13C solid state CP/MAS NMR studies of
EDTA complexes, Inorg. Chim. Acta 129 (2) (1987) L23–L25.
[29]Y.S. Ho, G. McKay, Pseudo-second order model for sorption processes, Process
Biochem. 34 (5) (1999) 451–465.
[30] S.Y. Lagergren, Zur Theorie der sogenannten Adsorption gelöster Stoffe,
Kungliga Svenska Vetenskapsakademiens, Handlingar 24 (4) (1898) 1–39.
[31]Y.S. Ho, G. McKay, Kinetic models for the sorption of dye from aqueous
solution by wood, Process Saf. Environ. Protect. 76 (B2) (1998) 183–191.
[32]J.A. Dean, N.A. Lange, Handbook of Chemistry, McGraw-Hill, 1999.
[33]F.A. Cotton, G. Wilkinson, C.A. Murillo, M. Bochmann, Advanced Inorganic
Chemistry, Wiley, Chichester, New York, 1999.
[34]J. Bajpai, R. Shrivastava, A.K. Bajpai, Dynamic and equilibrium studies on
adsorption of Cr(VI) ions onto binary bio-polymeric beads of cross linked alginate and gelatin, Colloids Surf. A: Physicochem. Eng. Aspects 236 (1–3)
(2004) 81–90.
[35]K.Y. Foo, B.H. Hameed, Insights into the modeling of adsorption isotherm
systems, Chem. Eng. J. 156 (1) (2010) 2–10.
[36]I. Langmuir, The adsorption of gases on plane surfaces of glass, mica and
platinum, J. Am. Chem. Soc. 40 (9) (1918) 1361–1403.
[37]H.M.F. Freundlich, Over the adsorption in solution, Zeitschrift Fur
Physikalische Chemie-Stochiometrie Und Verwandtschaftslehre 57 (4)
(1906) 385–470.
[38]R. Sips, On the structure of a catalyst surface, J. Chem. Phys. 16 (5) (1948) 490–
495.
[39]Y. Liu, Is the free energy change of adsorption correctly calculated?, J Chem.
Eng. Data 54 (7) (2009) 1981–1985.
[40] J. Kielland, Individual activity coefficients of ions in aqueous solutions, J. Am.
Chem. Soc. 59 (9) (1937) 1675–1678.
[41]S.N.C. Ramos, A.L.P. Xavier, F.S. Teodoro, M.M.C. Elias, F.J. Gonçalves, L.F. Gil, R.
P. Freitas, L.V.A. Gurgel, Modeling mono-and multi-component adsorption of cobalt (II), copper (II), and nickel (II) metal ions from aqueous solution onto a new carboxylated sugarcane bagasse. Part I: Batch adsorption study, Ind. Crops
Prod. 74 (2015) 357–371.
[42]R.G. Pearson, Hard and Soft Acids and Bases, Dowden, Hutchinson & Ross,
Stroudsburg, PA, USA, 1973.
[43]H. Irving, R.J.P. Williams, The stability of transition-metal complexes, J. Chem.
Soc. (1953) 3192–3210.
[44]R. Schmuhl, H. Krieg, K. Keizer, Adsorption of Cu(II) and Cr(VI) ions by
chitosan: kinetics and equilibrium studies, Water SA 27 (1) (2004) 1–8.
[45]G.Z. Kyzas, M. Kostoglou, N.K. Lazaridis, Copper and chromium(VI) removal by
chitosan derivatives – Equilibrium and kinetic studies, Chem. Eng. J. 152
(2009) 440–448.
[46]Z. Yan, S. Haijia, T. Tianwei, Adsorption behaviors of the aminated chitosan
adsorbent, Korean J. Chem. Eng. 24 (2007) 1047–1052.
[47]G.Z. Kyzas, M. Kostoglou, N.K. Lazaridis, D.N. Bikiaris, N-(2-Carboxybenzyl)
grafted chitosan as adsorptive agent for simultaneous removal of positively and negatively charged toxic metal ions, J. Hazard. Mater. 244–245 (2013) 29–