Vol.60: e17160240, January-December 2016 http://dx.doi.org/10.1590/1678-4324-2017160240
ISSN 1678-4324 Online Edition
BRAZILIAN ARCHIVES OF BIOLOGY AND TECHNOLOGY
A N I N T E R N A T I O N A L J O U R N A L
Optimized Exon-Exon Junction Library and its Application
on Rodents' Brain Transcriptome Analysis
Tong-Hai Dou
1, Yuan Gao
1, Cheng-Wen Chen
2, Min-Jie Xu
1, 2, Mao-Bin Fu
1, Liang
Zhang
2, Yan Zhou
1, 2, *.
1 State Key Laboratory of Genetic Engineering, School of Life Sciences, Fudan University, People's Republic of
China; 2 Shanghai-MOST Key Laboratory of Health and Disease Genomics, Chinese National Human Genome Center at Shanghai, People's Republic of China
ABSTRACT
Background: Alternative splicing (AS), which plays an important role in gene expression and functional regulation, has been analyzed on genome-scale by various bioinformatic approaches based on RNA-seq data. Compared with the huge number of studies on mouse, the AS researches approaching the rat, whose genome is intermedia between
mouse and human, were still limited. To enrich the knowledge on AS events in rodents’ brain, we perfomed a
comprehensive analysis on four transcriptome libraries (mouse cerebrum, mouse cerebellum, rat cerebrum, and rat cerebellum), recruiting high-throughput sequencing technology. An optimized exon-exon junction library approach was introduced to adapt the longer RNA-seq reads and to improve mapping efficiency.
Results: In total, 7,106 mouse genes and 2,734 rat genes were differentially expressed between cerebrum and cerebellum, while 7,125 mouse genes and 1,795 rat genes exhibited varieties on transcript variant level. Only half of the differentially expressed exon-exon junctions could be reflected at gene expression level. Functional cluster analysis showed that 32 pathways in mouse and 9 pathways in rat were significantly enriched, and 6 of them were in both. Interestingly, some differentially expressed transcript variants did not show difference on gene expression level, such as PLCβ1 and Kcnma1.
Conclusion: Our work provided a case study of a novel exon-exon junction strategy to analyze the expression of genes and isoforms, helping us understand which transcript contributes to the overall expression and further functional change.
Key words: RNA-seq, exon-exon junction, alternative splicing, cerebrum, cerebellum
*
INTRODUCTION
Alternative splicing (AS) is
a regulated process
during gene expression, particular exons of a
gene may be either retained in the mRNA or
targeted for removal in different combinations
to create a diverse array of mRNAs from that
gene. It is
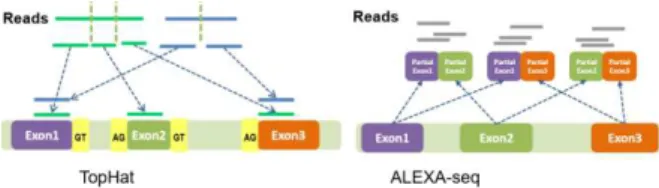
known to affect more than half of the human genes, underlying increased cellular and functional complexity []. Presumably, 92-94% of the multi-exon human genes undergo alternative splicing, and ~90,000 protein products are derived from different transcript variants of 23,000 protein-coding genes . Multiple mRNA and protein isoforms stemmed from individual genes may have related, distinct or even oppose functions. Furthermore, AS events exhibit obvious tissue specifics, e.g., more genes and alternatively spliced transcripts are expressed in brain than any other tissues . To assess the extent of differences of AS events between tissues, various methodologies were applied to transcriptomics studies, such as conventional sequencing, tiling arrays, and most recently, high throughput sequencing (RNA-seq) . Compared with tiling arrays, RNA-seq has the potential to overcome the limitation of hybridization technology, and puts forward the development of AS events analysis tools (e.g. TopHat, SplicesMap, Cufflink, and ALEXA-seq) . In breif, TopHat is the representative adopting Mapping approach to identify splice junctions, while the ALEXA-seq uses exon-exon junction (e-e junction) strat(e-egy to inv(e-estigat(e-e th(e-e alt(e-ernativ(e-e expression events such as exon skipping, alternative exon boundary usage, inclusion of cryptic exons , etc (Figure 1).Figure 1. Schematic diagram of two kinds of AS
analysis strategy for RNA-seq data. TopHat represents the Mapping approach and ALELXA-seq represents the e-e junction strategy.
The e-e junction strategy was firstly used in the exon junction array to detect splicing events and corresponding isoforms, and then extended to RNA-seq data analysis . Depending on the comprehensive AceView database, Dong et al.
built exon junction segments with known transcript information and calculated the expression index for each exon junction to measure the differential expression of AS events . Malachi Griffith et al. developed alternative expression annotation database, ALEXA-seq, which defined expression 'features' that could be informative of alternative expression events. In RNA-seq data process, the numerical measure of
reads mapping to the transcript variants’ specific
features presents the expression level of the AS isoform (Figure 1). In addition, e–e junction strategy is also involved in other approaches such as MMES, Scripture and MISO . However, the fast progress in RNA-seq technology often requires corresponding revision on the analytic methods. Up to now, a huge number of studies have been performed to investigate the genome and transcriptome of mouse and rat. Many mouse-associated experiments had been carried out, also including some expensive RNA-seq assays, but less related to the rat. The research both on mouse and rat brain with RNA-seq was rare (Table S1). Derti et al. used polyA-seq to globally map polyadenylation sites in 24 matched normal tissues (including mouse and rat brain) . To assess the tissue-specific transcriptome variation across mammals, Merkin et al. implemented RNA-seq with nine tissues from four mammals . However, these researches hardly made any distinctions on cerebrum and cerebellum.
The rat genome is intermedia between mouse and human, thus a comparation between these two animals might provide more information on animal model research for human disease . However, compared with the huge number of studies on the mouse, the AS researches approaching the rat remain limited. In this study, based on RNA-seq technology, we performed the transcriptome analysis on cerebrum and cerebellum of mouse as well as rat, to clarify the difference on gene expression level. Furthermore, we optimized and rebuilt the e-e junction library, trying to illustrate the expression pattern of alternative splicing isoforms (Figure S1).
METHODS
Sample preparation
National Institutes of Health. The protocol was approved by the Committee on the Ethics of Animal Experiments of the Fudan University (Permit Number: 219). The 8 mice and the 4 rats used in this study were bought from Experimental Animal Center of Second Military Medical University (Table S2). All the animals were euthanized by neck dislocation. The cerebrum and cerebellum were harvested and flash frozen in liquid nitrogen, and then stored at -80 °C.
RNA extraction and sequencing
Total RNA of all mouse cerebrum tissues from different individuals was extracted using Trizol reagent (Invitrogen), respectively, and then mixed together equally for RNA-seq. Identical process was performed, when dealing with other three types of samples (mouse cerebellum, rat cerebrum and rat cerebellum). Four libraries were constructed using Illumina standard kit according
to the manufacturer’s protocol. All sequencing was
performed on Illumina Hiseq2000. All RNA-seq data (fastq format) were submitted to NCBI SRA database (SRP023485, http://www.ncbi.nlm.nih.gov/sra/?term=SRP02348 5).
E-e junction library building
An e-e junction was constructed with full-length sequences of two exons from a multi-exon gene. Using exon annotation information from Ensembl GTF (mouse V72 and rat V72), all exon-exon combinations for each multi-exon gene were listed exhaustively to make e-e junction library. A single exon that existed in all known isoforms of a gene
was defined as ‘constitutive’ exon; otherwise the ‘AS’ exon was absent in one or more isoforms.
Accordingly, an e-e junction was marked as
‘constitutive’, if both of its exons were constitutive
exon; and an e-e junction with one or two AS exons was marked as ‘AS’.
Mapping
A) gene expression: all reads were mapped to corresponding reference genomes (mouse v.72 and rat v.72, Ensembl database), using TopHat v2.0.0 with default parameters in pair-end mode . Samtools rmdup function was used to eliminate the bias introduced by PCR amplification. The count of a pair of reads (also called a fragment) mapping to a unique position was defined as 1. Pair-end reads mapping to different chromosomes
were discarded. The count of a read mapping to multiple positions was divided by the number of positions. For example, the count of a read mapping to 10 positions was set to 0.1 at each position [ref cufflinks calculate method]. In addition, the count of a pair-end reads with only one end mapping to reference genome was set to 0.5. FPKM values (normalization) of all genes were calculated by our perl script based on filtered mapping results.
B) e-e junction: single-end mode is used to align reads to E-E junction libraries, using bowtie v0.12.8 with -n 3 parameters, because most of the e-e junction sequences were very short. The mapped reads with more than 2 mismatches or reads can be mapped to multiple positions were discarded. Read length was set to 90bp to reduce the influence of the low quality of reads tail. Only those unique reads that spanned exon-exon boundary and covered at least 8bp on each side, were counted . The reads count of each e-e junction was calculated and normalized by our perl script based on filtered mapping results.
Expression analysis on gene & e-e junction
The numerical measure of mapped reads was used to evaluate the expression level of gene and e-e junction. Expression difference of each gene or e-e junction between cerebrum and cerebellum was
analyzed based on Fisher’s exact test . The
significant differentially expressed genes (DEGs) or e-e junctions were selected with threshold P-value less than 0.01 and fold-change more than 2 between two libraries. All perl scripts and processed data could be downloaded from website
(http://homepage.fudan.edu.cn/zhouyan/ee-junction-database-2/).
Confirmation of gene expression pattern by
Real-time PCR
Reverse transcription was performed with 6 μg
total RNA using reverse transcriptase kit (Toyobo) and random hexamer primers according to the manufacturer's protocol. Real-time PCR was used to confirm gene expression patterns between cerebrum and cerebellum. Primers were designed for target genes in respective species (mouse and rat) (Table S3), and the PCR products were about 100-200bp. The house keeping gene GAPDH was selected as the reference. RT-PCR amplification
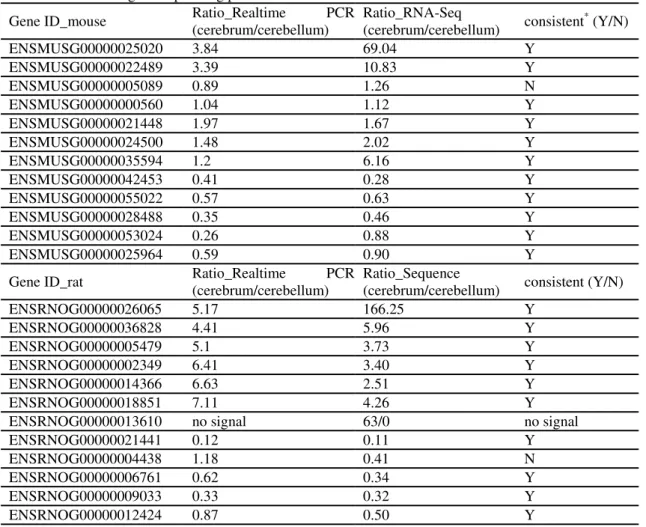
(Takara) and 200 nM forward and reverse primer. Reactions were run on CFX96 (BioRad). The cycling conditions comprised 10 min polymerase activation at 95 °C and 40 cycles at 95 °C for 15 sec, 58 °C for 20 sec and 72 °C for 20 sec. Each assay included (in triplicate) No RT controls and 50 ng test cDNA. 2−ΔCt formula was used for calculation of differential gene expression. If the ratio from Real-time PCR and RNA-seq were both greater or less than 1, the expression pattern of this
gene was considered as ‘consistent’ between the
two methods.
Functional analysis
The Database for Annotation, Visualization and Integrated Discovery (DAVID) v6.7 (https://david.ncifcrf.gov/) is a set of web-based functional annotation tools . After a list of the gene IDs is inputted online, the DAVID program will return the functional classification result of these genes. The genes which showed significant differential expression or contained differentially
expressed e-e junctions were submitted to DAVID for function annotation and the background was selected as Mus musculus or Rattus norvegicus. KEGG pathway was chosen as the functional annotation category for analysis (cutoff P-value less than 0.001).
RESULTS
Sequence coverage validation
In total, 52,255,073×2 paired-end reads (fragments) were obtained for the four libraries (mouse cerebrum, mouse cerebellum, rat cerebrum, and rat cerebellum) (Table 1). The mouse cerebrum library was sequenced with higher depth (nearly 19 Million paired reads), while the reads of other three libraries ranged from 10M to 12M. About 51%~66% of rodents’ genes were detected (fragments >=1). The higher coverage did not increase the number of detected genes significantly.
Table 1.Statistic of reads mapping to rodents’ genome
Library Raw Reads(pair-end) Read length(bp) Detected Gene(percentage)
OUSE Cerebrum 19,037,324×2 100 22,353(58%)
MOUSE Cerebellum 10,062,700×2 115 19,814(51%)
RAT Cerebrum 12,285,034×2 115 17,297(66%)
RAT Cerebellum 10,870,015×2 114 16,820(64%)
Total 52,255,073×2
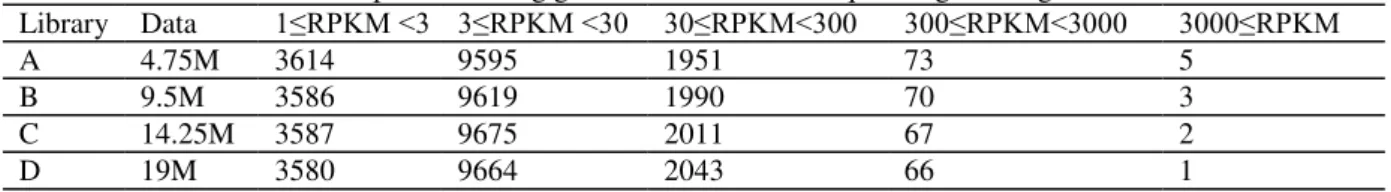
To assess the influence of sequencing coverage on the gene expression value,three simulative libraries (containing 4.75M, 9.5M and 14.25M paired reads; named library A, B and C) were re-sampled randomly from mouse cerebrum full library (library D, 19M paired reads). According to FPKM value, the genes with RPKM value 1 or more were divided into five groups (FPKM 1-3,
3-30, 30-300, 300-3,000, and 3,000 or more). In each group, the number of genes from A, B, and C library was within ±5% of that in library D, except for groups RPKM 300-3,000 and 3,000 or more (Table 2). However, genes within these two groups were less than 1% of total genes with FPKM value 1 or more, which would rarely affect the following statistical significance analysis.
Table 2. Statistic of detected protein coding genes under different sequencing coverage
Library Data 1≤RPKM <3 3≤RPKM <30 30≤RPKM<300 300≤RPKM<3000 3000≤RPKM
A 4.75M 3614 9595 1951 73 5
B 9.5M 3586 9619 1990 70 3
C 14.25M 3587 9675 2011 67 2
D 19M 3580 9664 2043 66 1
Optimized
e-
e
junction
libraries’
construction and reads mapping
The e-e junction library of mouse contained 2,783,083 known or predicted e-e junctions which derived from 38,561 genes and 348,154 exons. For
rat, 1,680,373 junctions were built from 26,405 genes and 216,316 exons.
applied for RNA-seq data with various read length (Figure S2). A total of 156,781 and 118,074 e-e junctions were detected (mapped with reads) in mouse cerebrum and cerebellum libraries respectively. Meanwhile, 105,458 and 104,922 e-e junctions were detected for rat cerebrum and cerebellum libraries (Table 3). Compared with TopHat, even under a stirct criteria, there were still
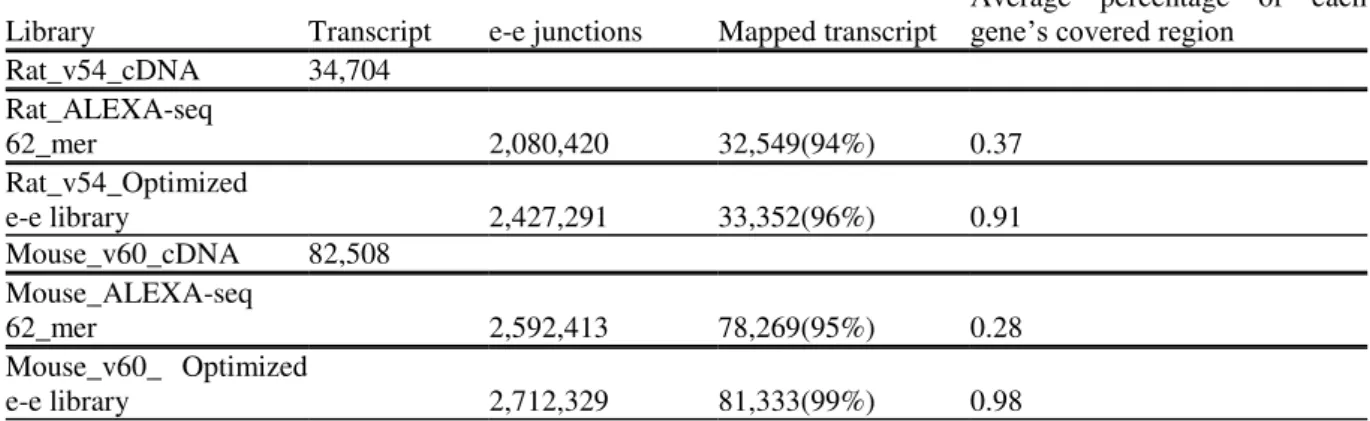
many e-e junctions, could be exclusively detected with our strategy (Table S4). In addition, blast results of rat cDNAs (v54) and mouse cDNAs (v60), which were the basis of ALEXA-seq 62_mer data, showed that our e-e junctions could achieve higher coverage on gene region (>90%, Table 4).
Table 3. Statistic of mapping to e-e libraries
Library Total e-e Mapped e-e Mapped Reads Average per e-e
MOUSE Cerebrum 2,783,083 156,781 6,144,003 39.19
MOUSE Cerebellum 2,783,083 118,074 1,740,771 14.74
RAT Cerebrum 1,680,373 105,458 1,906,535 18.08
RAT Cerebellum 1,680,373 104,922 1,885,559 17.97
Table 4. Mapping results of different e-e junction strategy
Library Transcript e-e junctions Mapped transcript
Average percentage of each
gene’s covered region
Rat_v54_cDNA 34,704 Rat_ALEXA-seq
62_mer 2,080,420 32,549(94%) 0.37
Rat_v54_Optimized
e-e library 2,427,291 33,352(96%) 0.91
Mouse_v60_cDNA 82,508 Mouse_ALEXA-seq
62_mer 2,592,413 78,269(95%) 0.28
Mouse_v60_ Optimized
e-e library 2,712,329 81,333(99%) 0.98
Based on simulative libraries of mouse cerebellum, we evaluated the influence of sequencing depth on e-e junction detection (Figure 2), and found that the increasing rate of detected e-e junctions is 11% (from library A to B), 5% (B to C), and 4% (C to D) (Table S5). More RNA-seq reads led to more detected e-e junctions, and reached to a plateau.
Figure 2. The robustness of expression level and depth
of sequencing for detected e-e junctions. Robustness of expression level and depth of sequencing for detected e-e junctions. The-e de-ete-ecte-ed e-e-e-e junctions ke-ept incre-easing from library A to D.
Differentially expressed genes
Table 5. Results of gene expressing pattern confirmation
Gene ID_mouse Ratio_Realtime PCR
(cerebrum/cerebellum)
Ratio_RNA-Seq
(cerebrum/cerebellum) consistent
*
(Y/N)
ENSMUSG00000025020 3.84 69.04 Y
ENSMUSG00000022489 3.39 10.83 Y
ENSMUSG00000005089 0.89 1.26 N
ENSMUSG00000000560 1.04 1.12 Y
ENSMUSG00000021448 1.97 1.67 Y
ENSMUSG00000024500 1.48 2.02 Y
ENSMUSG00000035594 1.2 6.16 Y
ENSMUSG00000042453 0.41 0.28 Y
ENSMUSG00000055022 0.57 0.63 Y
ENSMUSG00000028488 0.35 0.46 Y
ENSMUSG00000053024 0.26 0.88 Y
ENSMUSG00000025964 0.59 0.90 Y
Gene ID_rat Ratio_Realtime PCR
(cerebrum/cerebellum)
Ratio_Sequence
(cerebrum/cerebellum) consistent (Y/N)
ENSRNOG00000026065 5.17 166.25 Y
ENSRNOG00000036828 4.41 5.96 Y
ENSRNOG00000005479 5.1 3.73 Y
ENSRNOG00000002349 6.41 3.40 Y
ENSRNOG00000014366 6.63 2.51 Y
ENSRNOG00000018851 7.11 4.26 Y
ENSRNOG00000013610 no signal 63/0 no signal
ENSRNOG00000021441 0.12 0.11 Y
ENSRNOG00000004438 1.18 0.41 N
ENSRNOG00000006761 0.62 0.34 Y
ENSRNOG00000009033 0.33 0.32 Y
ENSRNOG00000012424 0.87 0.50 Y
*If the ratios between cerebrum and cerebellum for certain gene from two methods are both higher or lower than 1, the expression pattern of this gene is considered consistent between the two methods.
Figure 3. The differentially expressed genes (A) and
e-e junctions (B). A) The-e numbe-er of diffe-ere-entially
expressed genes detected in rodents’ cerebrum and
cerebellum.The blue bars represented the genes highly expressed in cerebrum and the red bars represented those highly expressed in cerebellum. B) Overlapping map of differentially expressed genes and genes containing differentially expressed e-e junctions. The genes with differentially expressed e-e junctions were defined as DEEGs. The grey circle meant all the genes showed difference on gene expression level. The bars
standed for genes, which contained differentially expressed AS or constitutive e-e junctions.
Differentially expressed e-e junctions
genes). Only 94 genes contained both differentially expressed AS and constitutive e-e junctions. A certain amount of AS isoforms might be differentially expressed, without showing significant changes at gene expression level. In summary, the overlap between DEEGs and DEGS was approximately half of the DEEGs in all four
libraries.
Twelve differentially expressed e-e junctions were randomly selected to test their expression pattern in rat by Real-time PCR. Nine of them exhibited similar expression pattern in RNA-seq and Real-time PCR test (Table 6).
Table 6. Results of e-e junction expression confirmation
e-e junction DEEG
Ratio_Realtime PCR (cerebrum/cerebellum)
Ratio_Sequence
(cerebrum/cerebellum) consistent* (Y/N)
AA1** ENSRNOG00000024870 0.15 0.07 Y
AA2 ENSRNOG00000012421 0.99 0.24 Y
AA3 ENSRNOG00000011946 2.02 1.15 Y
AA4 ENSRNOG00000026034 0.74 0.35 Y
CA1*** ENSRNOG00000005985 4.24 24.07 Y
CA2 ENSRNOG00000026745 0.93 15.74 N
CA3 ENSRNOG00000012820 0.55 0.21 Y
CA4 ENSRNOG00000006037 2.97 5.77 Y
CC1**** ENSRNOG00000038868 0.74 0.22 Y
CC2 ENSRNOG00000013271 0.75 0.30 Y
CC3 ENSRNOG00000007014 1.13 0.29 N
CC4 ENSRNOG00000014876 0.80 5.18 N
*If the ratios between cerebrum and cerebellum for an e-e junction from two methods are both higher or lower than 1, the expression pattern is considered consistent between the two methods.
**AA meant the e-e consisted of two AS exons.
***CA meant the e-e consisted of an AS exon and a constitutive exon. ****CC meant the e-e consisted of two constitutive exons.
Functional cluster analysis
DAVID was implemented to conduct KEGG cluster analysis upon the four libraries. The DEGs and DEEGs were combined for functional cluster analysis. Inputting combined 11,428 mouse genes and 3,876 rat genes into the web database respectively, we obtained 51 pathways in mouse and 14 pathways in rat which showed significant enrichment (Table S6). In particular, nine of them were identified both in mouse and rat, which might be relative to brain function or disease, including Calcium signaling pathway, Axon guidance, MAPK signaling pathway, Phosphatidylinositol signaling system, Gap junction, Inositol phosphate metabolism, ErbB signaling pathway, Long-term depression, and Pathways in cancer. Figure 4 showed the Calcium signaling pathway marked with differentially expressed genes and e-e junctions. Figures of the Axon guidance and Pathways in cancer are provided in supplementary materials (Figure S3-4).
Figure 4. The Calcium signaling pathway marked with
differentially expressed genes.The pie marked aside the gene symbol was divided into four quarters, the blue and brown quarter meant the gene exhibited difference on gene expression level in rat and mouse, respectively. The green and pink quarter meant the gene expressed differentially on e-e junction level in mouse and rat,
respectively. PLCβ and CAMK marked with red pentagrams included the Phospholipase Cβ gene family
member PLCβ1 and CAMK gene family member
CaMKIIa, respectively.
expressed e-e junctions, showed no significant difference on gene expression level in mouse.
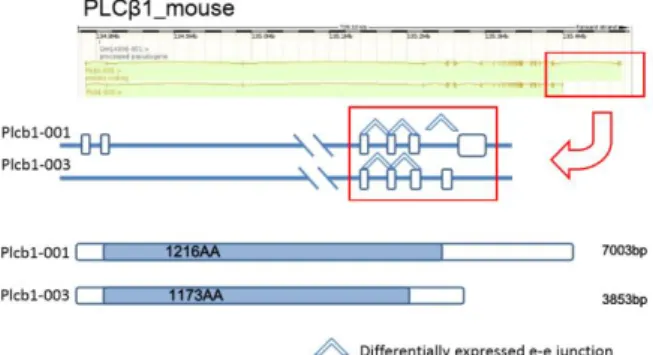
PLCβ1 is activated by members of the Gq family
of G proteins . Activation of PLC increases the hydrolysis of phosphatidylinositol 4,5-bisphosphate (PIP2) to generate inositol 1,4,5-trisphosphate (Ins[1,4,5]P3) and sn-1,2-diacylglycerol (DAG), a key step in the intracellular transduction of a variety of molecules involved in cell-cell communication . The two major isoforms (Plcb1-001 and Plcb1-003, Ensembl database) differed in their C-terminal sequences, which was responsible for their affinity and subcellular localization, and showed different functionally activities and expression preference in rat and human tissues . In our study, at the
C-terminal of PLCβ1, the unique e-e junction of
Plcb1-001 was highly expressed in cerebrum in mouse, but its alternative partner in Plcb1-003 showed no significant changes (Figure 5). This implied a vital role of Plcb1-001 in intracellular transduction in mouse cerebrum.
Figure 5. The differentially expressed e-e junctions and
protein domain prediction analysis of PLCβ1 isoforms
in mouse. The e-e junctions that were highly expressed in cerebrum were marked with up arrow. The protein coding region of each isoform is marked as grey. The tail e-e junction showed different expression pattern in the two isoforms.
The potassium large conductance calcium-activated channel (BK channel), subfamily M, alpha member 1 (Kcnma1) in rat is another gene contained significantly highly expressed AS e-e junctions in cerebrum but showed no difference on gene expression level. This gene, which usually generate several isoforms depending on several major alternative splicing exons (such as SV1, SS, and STREX), contributes to repolarization of the membrane potential and circuit excitability . Internal calcium level changing could cause the
skipping or obtaining of the STREX exon, which related to kinds of neuronal functions and diseases, such as mesial temporal lobe epilepsy . In our data, the detected highly expressed AS e-e junction of this gene belonged to isoform SS4 specifically (Figure 6A), while the remained isoforms that had no SS4 exon were significantly down-regulated, to stabilitate the gene expression level. This isoform might act as a dominant-negative expression regulator by inhibiting other isoforms surface expression . Our result suggested another exon skipping event in this gene, which showed difference between cerebrum and cerebellum. There might be unrevealed functional regulation mechanism through alternative splicing, which might not be neglected on gene expression level. Distinguished with the genes above, calcium/calmodulin-dependent protein kinase II alpha (CaMKIIa, marked as CAMK in Calcium signaling pathway, Figure 4) showed significantly difference both on gene expression level and on e-e junction le-eve-el in mouse-e. CaM kinase-es are-e a large-e family of Ser/Thr proteinkinases, and the family members such as CaMKI, CaMKII, and CaMKIV have been implicated in various neuronal functions. In mammals, CaMKII is a prominent kinase in the central nervous system that may function in long-term potentiation and neurotransmitter release . Its subunits are encoded
by four separated genes (α, β, γ, and δ), and
Figure 6. The differentially expressed e-e junctions and exon structure of Kcnma1 (A) and CaMKIIa (B). The up and down arrows represented the higher and lower expression level of e-e junctions in cerebrum, respectively. For CaMKIIa gene, fifteen differentially expressed e-e junctions are marked as up arrows. The protein coding region of each isoform was marked as
grey, and the protein kinase domain was marked as brown rectangle.
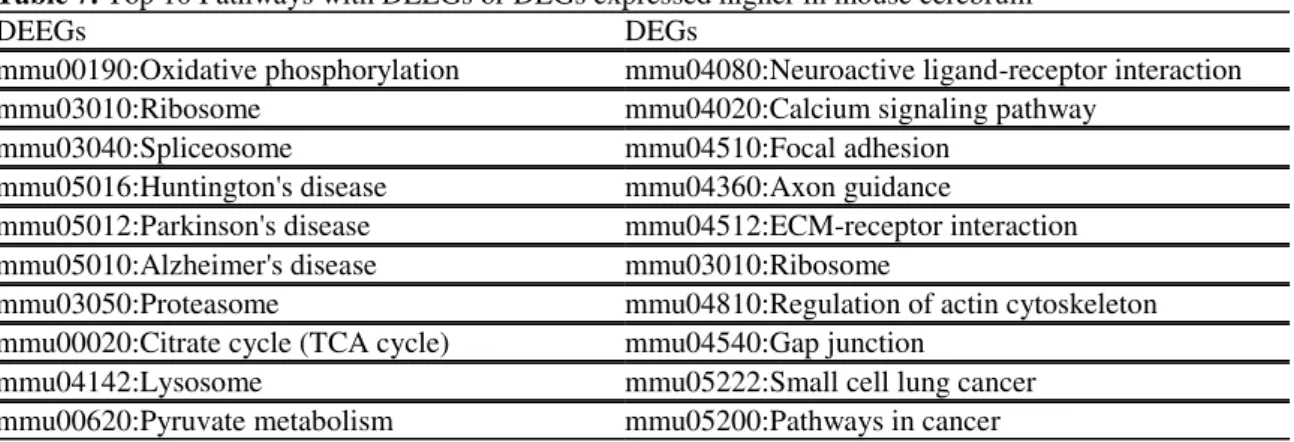
We performed pathway analysis with DEGs and DEEGs expressed higher in cerebrum (Table 7). Interestingly, Huntington's disease, Parkinson's disease and Alzheimer's disease pathways showed a high rank in the DEEGs-associated pathways list, but not in the DEGs-associated list. Taking the
Huntington’s disease pathway as an example, the
number of enriched DEEGs was 100, and DEGs was only 51. These three pathways were brain-related disease, and might be neglected in gene expression profile analysis. However, based on the e-e junction analysis, the importance of these pathways significantly increased and might give us more hints in functional analysis.
Table 7. Top 10 Pathways with DEEGs or DEGs expressed higher in mouse cerebrum
DEEGs DEGs
mmu00190:Oxidative phosphorylation mmu04080:Neuroactive ligand-receptor interaction
mmu03010:Ribosome mmu04020:Calcium signaling pathway
mmu03040:Spliceosome mmu04510:Focal adhesion
mmu05016:Huntington's disease mmu04360:Axon guidance
mmu05012:Parkinson's disease mmu04512:ECM-receptor interaction mmu05010:Alzheimer's disease mmu03010:Ribosome
mmu03050:Proteasome mmu04810:Regulation of actin cytoskeleton mmu00020:Citrate cycle (TCA cycle) mmu04540:Gap junction
mmu04142:Lysosome mmu05222:Small cell lung cancer
mmu00620:Pyruvate metabolism mmu05200:Pathways in cancer
DISCUSSION
The analytic strategy and algorithm on AS have been advanced to elucidate the changes on transcriptome more accurately. TopHat has been a mature process which aligns RNA-Seq reads to mammalian-sized genomes using the ultra high-throughput short read aligner Bowtie, and then analyzes the mapping results to identify splice junctions. During this process, a read can be divided into two or three parts to predict splicing events based on the GT-AG rule and other exon structure rules . SpliceMap adopts another strategy that identifies approximate location of a junction using the mapping of half-reads . Although Mapping approach is an effective way to align junction reads,the fixed-length dividing (SpliceMap) and the seed-extend dividing
extend into the adjacent intron and the reads would fail to map on it.
In our optimized e-e library construction method, full-length exon sequence was used to build the library and could be applied to RNA-seq data with different read lengths (Figure S2). Compared with the Mapping strategy (e.g. TopHat), many splice sites could be exclusively identified with our method, which provided a useful and alternative tool in AS events analysis (Table S4). In addition, the optimized e-e junctions exhibited higher coverage on gene region than that using fixed length method (e.g. ALEXA-seq) (Table 4). Thus, the full-length e-e junction tactics help to not only improve the efficiency on sequence read usage, but also increase the number of detected transcripts. Table 1 and 2 demonstrated that the higher coverage did not increase the number of detected genes significantly. To evaluate the influence on differentially expressed genes, we picked half of the mouse cerebrum data randomly (coverage less than other libraries) and compared with the library cerebellum. The number of highly expressed and lowly expressed genes was 4,737 and 1,710, respectively, which was consistent with the preceding observation (5,000 and 1,736 genes, full library) (Figure S5).
Despite of strict principle in data processing, the sequencing depth and the annotation of the genome might also introduce some bias and influenced the e-e results. Thus, based on the random reads extraction, we calculated the e-e expression value (RPKM-like) in different depth (data not shown). The e-e with more mapping reads often had a stable value even in 1/4 depth of the original data, and the mouse cerebrum (19M) and cerebellum (10M) data were also comparable. In addition, we performed Real-time PCR to test the candidate e in rat (Table 6). Although 75% e-e junctions showe-ed similar e-expre-ession patte-ern in RNA-seq and Real-time PCR test, the significance of e-e expression changes was not very accordant in these two experiments. Since the cost of RNA-seq continuously decreasing, higher RNA-sequencing depth was suggested when focusing on low frequece isoform finding and isoform expression changes.
The accurate of e-e junction was also limited by the genome annotation, which mainly depended on the accumulation of the knowledge. The asymmetry of research on mouse and rat might introduce some bias in the e-e junction analysis. In the database, the number of isoforms belonging to
mouse was greater than that belonging to rat, and this might be the reason why the proportion of constitutive e-e in rat was higher than that in mouse. However, despite of difference on e-e quantities, the overlap between DEEGs and DEGS was approximately half of the DEEGs in both mouse and rat. That meant only half of the differentially expressed isoform was reflected at the gene expression level, and this might imply an important balance on gene expression regulation. As a common research animal, the rat genome is intermedia between mouse and human, and the pathway analysis in mouse might not work in rat. Here, we did not do much comparison between mouse and rat, but shown these differences (isoforms, genes, and pathways) in a comprehensive scale, providing more information on animal model research for human disease.
CONCLUSIONS
RNA-seq data analysis based on optimized e-e junction library could observe the expression varieties of one or more transcript variants, such differences might not be reflected on gene
expression level, just as PLCβ1 and Kcmna1
described above. Furthermore, the gene exhibited significant difference both
on gene expression level and e-e junction level can help us understand which transcript variant contributed most, such as CaMKIIa. These observations could give more hints on the regulation of gene expression and function. Further study such as expression verification in
large rodents’ samples and functional experiments
should be performed for specific gene target.
COMPETING INTERESTS
The authors declare that they have no
competing interests.
ACKNOWLEDGMENTS
and 2012AA020409), and the Science and Technology Commission of Shanghai Municipality (grant numbers 11JC1400900, 12ZR1421300, and 16ZR1423900).
REFERENCES
1. Sharma A, Lou H. Depolarization-mediated regulation of alternative splicing. Frontiers in Neuroscience. 2011;5.
2. Xu J, Dou T, Liu C, Fu M, Huang Y, Gu S, et al. The evolution of alternative splicing exons in vascular endothelial growth factor A. Gene. 2011.
3. Pan Q, Shai O, Lee LJ, Frey BJ, Blencowe BJ. Deep surveying of alternative splicing complexity in the human transcriptome by high-throughput sequencing. Nature genetics. 2008;40(12):1413-5.
4. Wang ET, Sandberg R, Luo S, Khrebtukova I, Zhang L, Mayr C, et al. Alternative isoform regulation in human tissue transcriptomes. Nature. 2008;456(7221):470-6.
5. Johnson MB, Kawasawa YI, Mason CE, Krsnik Z, Coppola G, Bogdanovic D, et al. Functional and evolutionary insights into human brain development through global transcriptome analysis. Neuron. 2009;62(4):494-509.
6. Yeo G, Holste D, Kreiman G, Burge CB. Variation in alternative splicing across human tissues. Genome biology. 2004;5(10):R74.
7. Xu AG, He L, Li Z, Xu Y, Li M, Fu X, et al. Intergenic and repeat transcription in human, chimpanzee and macaque brains measured by RNA-Seq. PLoS computational biology. 2010;6:e1000843. 8. Wang L, Xi Y, Yu J, Dong L, Yen L, Li W. A
statistical method for the detection of alternative splicing using RNA-seq. PloS one. 2010;5(1):e8529. 9. Trapnell C, Pachter L, Salzberg SL. TopHat:
discovering splice junctions with RNA-Seq. Bioinformatics. 2009;25(9):1105-11.
10. Trapnell C, Williams BA, Pertea G, Mortazavi A, Kwan G, van Baren MJ, et al. Transcript assembly and quantification by RNA-Seq reveals unannotated transcripts and isoform switching during cell differentiation. Nature biotechnology. 2010;28(5):511-5.
11. Griffith M, Griffith OL, Mwenifumbo J, Goya R, Morrissy AS, Morin RD, et al. Alternative expression analysis by RNA sequencing. Nature methods. 2010;7(10):843-7.
12. Liu S, Lin L, Jiang P, Wang D, Xing Y. A comparison of RNA-Seq and high-density exon array for detecting differential gene expression between closely related species. Nucleic acids research. 2011;39(2):578-88.
13. Rahman FA, Aziz N, Coverley D. Differential detection of alternatively spliced variants of Ciz1 in
normal and cancer cells using a custom exon-junction microarray. BMC cancer. 2010;10:482.
14. Menghi F, Jacques TS, Barenco M, Schwalbe EC, Clifford SC, Hubank M, et al. Genome-wide analysis of alternative splicing in medulloblastoma identifies splicing patterns characteristic of normal cerebellar development. Cancer research. 2011;71(6):2045. 15. Nagao K, Togawa N, Fujii K, Uchikawa H, Kohno
Y, Yamada M, et al. Detecting tissue-specific alternative splicing and disease-associated aberrant splicing of the PTCH gene with exon junction microarrays. Human molecular genetics. 2005;14(22):3379-88.
16. Dong L, Jensen RV, De Rienzo A, Gordon GJ, Xu Y, Sugarbaker DJ, et al. Differentially expressed alternatively spliced genes in malignant pleural mesothelioma identified using massively parallel transcriptome sequencing. BMC medical genetics. 2009;10:149.
17. Zhang Y, Lameijer EW, t Hoen PA, Ning Z, Slagboom PE, Ye K. PASSion: a pattern growth algorithm-based pipeline for splice junction detection in paired-end RNA-Seq data. Bioinformatics. 2012;28(4):479-86.
18. Au KF, Jiang H, Lin L, Xing Y, Wong WH. Detection of splice junctions from paired-end RNA-seq data by SpliceMap. Nucleic acids research. 2010;38(14):4570-8.
19. Dimon MT, Sorber K, DeRisi JL. HMMSplicer: a tool for efficient and sensitive discovery of known and novel splice junctions in RNA-Seq data. PloS one. 2010;5(11):e13875.
20. Guttman M, Garber M, Levin JZ, Donaghey J, Robinson J, Adiconis X, et al. Ab initio reconstruction of cell type-specific transcriptomes in mouse reveals the conserved multi-exonic structure of lincRNAs. Nature biotechnology. 2010;28(5):503-10.
21. Derti A, Garrett-Engele P, MacIsaac KD, Stevens RC, Sriram S, Chen R, et al. A quantitative atlas of polyadenylation in five mammals. Genome research. 2012;22(6):1173-83.
22. Merkin J, Russell C, Chen P, Burge CB. Evolutionary dynamics of gene and isoform regulation in mammalian tissues. Science. 2012;338(6114):1593-9.
23. Mullins LJ, Mullins JJ. Insights from the rat genome sequence. Genome Biol. 2004;5(5):221.
24. Rumble SM, Lacroute P, Dalca AV, Fiume M, Sidow A, Brudno M. SHRiMP: accurate mapping of short color-space reads. PLoS computational biology. 2009;5(5):e1000386.
25. Smyth G, Smyth MG. The statmod package. 2007. 26. Da Wei Huang BTS, Lempicki RA. Systematic and
integrative analysis of large gene lists using DAVID bioinformatics resources. Nature protocols. 2008;4(1):44-57.
functional analysis of large gene lists. Nucleic acids research. 2009;37(1):1-13.
28. Sun L, Mao G, Kunapuli SP, Dhanasekaran DN, Rao AK. Alternative splice variants of phospholipase C-β 2 are expressed in platelets: Effect on G α q-dependent activation and localization. Platelets. 2007;18(3):217-23.
29. Arthur JF, Matkovich SJ, Mitchell CJ, Biden TJ, Woodcock EA. Evidence for selective coupling of α 1-adrenergic receptors to phospholipase C-β1 in rat neonatal cardiomyocytes. Journal of Biological Chemistry. 2001;276(40):37341-6.
30. Grubb DR, Vasilevski O, Huynh H, Woodcock EA. The extreme C-terminal region of phospholipase Cβ1 determines subcellular localization and function; the
“b” splice variant mediates α1-adrenergic receptor
responses in cardiomyocytes. The FASEB Journal. 2008;22(8):2768-74.
31. Caricasole A, Sala C, Roncarati R, Formenti E, Terstappen GC. Cloning and characterization of the human phosphoinositide-specific phospholipase C-beta 1 (PLCβ1). Biochimica et Biophysica Acta (BBA)-Gene Structure and Expression. 2000;1517(1):63-72.
32. Ha TS, Jeong SY, Cho SW, Jeon Hk, Roh GS, Choi WS, et al. Functional characteristics of two BKCa channel variants differentially expressed in rat brain tissues. European Journal of Biochemistry. 2000;267(3):910-8.
33. Poulsen AN, Wulf H, Hay-Schmidt A, Jansen-Olesen I, Jansen-Olesen J, Klaerke DA. Differential expression of BK channel isoforms and β-subunits in rat neuro-vascular tissues. Biochimica et Biophysica Acta (BBA)-Biomembranes. 2009;1788(2):380-9. 34. Ermolinsky BS, Skinner F, Garcia I, Arshadmansab
MF, Otalora LF, Zarei MM, et al. Upregulation of STREX splice variant of the large conductance Ca2+-activated potassium (BK) channel in a rat model of mesial temporal lobe epilepsy. Neurosci Res. 2011;69(1):73-80.
35. Davies KP, Stanevsky Y, Tar MT, Chang JS, Chance MR, Melman A. Ageing causes cytoplasmic retention of MaxiK channels in rat corporal smooth muscle cells. International journal of impotence research. 2007;19(4):371-7.
36. Coultrap SJ, Vest RS, Ashpole NM, Hudmon A, Bayer KU. CaMKII in cerebral ischemia. Acta Pharmacologica Sinica. 2011;32(7):861-72.
37. Erondu NE, Kennedy MB. Regional distribution of type II Ca2+/calmodulin-dependent protein kinase in rat brain. The Journal of neuroscience. 1985;5(12):3270-7.
38. BAYER K-U, LO¨HLER JR, HARBERS K. An Alternative, Nonkinase Product of the Brain-Specifically Expressed Ca21/Calmodulin-Dependent Kinase II a Isoform Gene in Skeletal Muscle. MOLECULAR AND CELLULAR BIOLOGY. 1996;16(1):29-36.
39. Thierry-Mieg D, Thierry-Mieg J. AceView: a comprehensive cDNA-supported gene and transcripts. Genome biology. 2006;7(1):S12.