270
Revista da Universidade Vale do Rio Verde, Três Corações, v. 13, n. 1, p. 270-283, 2015
STUDY OF FERMENTATION GROWTH KINETICS AND SURVIVAL AFTER FREEZING AND LYOPHILIZATION OF MICROORGANISMS ISOLATED FROM
BRAZILIAN GRAPE SOURDOUGH
Krischina Singer APLEVICZ1 Tiago da SILVA2 Luiz Rodrigo Ito MORIOKA3 Ernani Sebastião SANT’ANNA4 Regina Coeli de Oliveira TORRES5
1
PhD in Food Sciences , Professor at the Federal Institute of Santa Catarina, aplevicz@gmail.com
2 Fellow Student Federal University of Santa Catarina, tiagroalimentar@gmail.com
3 PhD in Food Sciences , Post- doctoral student of the Federal University of Santa Catarina, lrodrigoi@yahoo.com.br 4 PhD in Food Sciences , Professor at the Federal University of Santa Catarina, ernanis.santanna@ufsc.br
5
PhD in Food Sciences , Central Laboratory of Public Health , Florianópolis , rcotorres@gmail.com
Recebido em: 17/12/2014 - Aprovado em: 04/06/2015 - Disponibilizado em: 15/07/2015
ABSTRACT: This study was developed to evaluate the influence of strains of Lactobacillus paracasei (LP1 and LP2)
and Saccharomyces cerevisiae (SC1 and SC2) in fermentation and in survival during the processes of freezing and lyophilization. The microorganisms were cultivated in a discontinuous fermentation system for 15 h and the analyses of pH, absorbance, dry biomass and plate counts were performed. LP1 showed the same exponential phase as LP2, and its specific speed of growth was higher and statistically different from the others (P < 0.05). The yeasts presented growth rates higher than the LAB. However, the LAB presented higher biomass yields and lower pH values. LP2 showed the same exponential phase as LP1, its specific rate of growth was higher and statistically different from the others (P < 0.05). The microorganisms presented good stability before and after lyophilization, with LP2 showing lower microbial reduction.
Keywords: fermentation, kinetics, lyophilization.
ESTUDO DA CINÉTICA DE FERMENTAÇÃO E SOBREVIVÊNCIA AO CONGELAMENTO E LIOFILIZAÇÃO DE MICRO-ORGANISMOS ISOLADOS DO
FERMENTO NATURAL DE UVA BRASILEIRA
RESUMO: Este estudo avaliou a influência de cepas de Lactobacillus paracasei (LP1 e LP2) e de Saccharomyces cerevisiae (SC1 e SC2) na fermentação e na sobrevivência ao congelamento e à liofilização. Os micro-organismos
foram cultivados em um sistema de fermentação descontínua durante 15 h, sendo realizadas as análises de pH, absorbância, biomassa seca e contagem em placas. LP1 teve a mesma fase exponencial que LP2, mas a sua velocidade específica de crescimento foi maior e estatisticamente diferente das demais (P < 0,05). As leveduras apresentaram um crescimento mais rápido que as bactérias láticas. Entretanto, as bactérias láticas apresentaram maior biomassa e menor pH. LP2 obteve a mesma fase exponencial que LP1, e seu crescimento específico foi maior e estatisticamente diferentes dos demais (P < 0,05). Os micro-organismos apresentaram uma boa estabilidade antes e após a liofilização e LP2 obteve a menor redução microbiana.
Palavras-chave: fermentação, cinética, liofilização.
INTRODUCTION
Sourdough is a mixture of flour and water fermented by LAB and yeast
(HANSEN, 2006), which have low pH and high acidity. The LAB microbiota is predominant (8 log CFU/ g) and is mainly
271
Revista da Universidade Vale do Rio Verde, Três Corações, v. 13, n. 1, p. 270-283, 2015
represented by members of the Lactobacillus genus. Yeasts are generally counted at lower levels (7 log CFU/g) and can even be absent. The yeasts mainly belong to the
Saccharomyces and Candida genera.
Sourdoughs can be obtained from different methods, either through spontaneous fermentation or with selected starter strains (DE VUYST, NEYSENS 2005; HAMMES et al., 2005; CORSETTI, SETTANNI, 2007).
The current renaissance of sourdough application in bread making is motivated by the beneficial effects of sourdough on flavor, texture, shelf life and nutritional properties (GÄNZLE et al., 2007). Consecutive microbial re-inoculation, often called ‘‘backslopping’’, of the microorganisms from a previous batch is used to maintain the microbial flora, which is adapted and selected to the process applied (HÄGGMAN, SALOVAARA, 2008). Hence, backslopping results in the dominance of the best adapted strains (LEROY, DE VUYST, 2004). Tulha et al. (2011) have observed that the continued propagation of sourdough is designed to keep the microorganisms active.
Originally, industrial starter cultures were maintained by daily propagation. Later, they became available as frozen concentrates and dried or lyophilized preparations, produced on an industrial scale, some of them allowing direct vat inoculation (SANDINE, 1996).
The quality and shelf life of foods are often determined by the growth of microorganisms that are dependent on intrinsic factors, such as water activity and acidity, and extrinsic factors, such as temperature and oxygen (WIJTZES et al., 1995). Apart from the variations in the type of starter cultures used in the fermentation
process, the fermentation regime
(temperature, time, pH, etc.) may also differ significantly, depending on the process applied (HANSEN, SCHIEBERLE, 2005).
The objective of this study was evaluate the influence of LAB of
Lactobacillus paracasei (LP1 and LP2) and yeast Saccharomyces cerevisiae (SC1 and
SC2) in fermentation, in surviving freezing and lyophilization, as well as their effect on sourdough preparation using the three-stage technique.
MATERIALS AND METHODS
Cultivation of microorganisms
Grape sourdough was spontaneously fermented using “Niagara rosada” grape juice as substrate, which was obtained commercially locally and previously cleaned. The strains used in this study were isolated from Brazilian grape sourdough and
characterized phenotypically and
genotypically as Lactobacillus paracasei (LP1 and LP2) and Saccharomyces cerevisiae (SC1 and SC2).
272
Revista da Universidade Vale do Rio Verde, Três Corações, v. 13, n. 1, p. 270-283, 2015
Inoculates were produced from an isolated culture that was peaked monthly and activated in individual tubes containing 5 mL of MRS broth (Difco, Sparks, USA) at 30 °C/16 h for LAB, and malt extract broth (HiMedia, Mumbai, India) at 25 °C/24 h for the yeasts. The final population of the inoculate was 5.45 log CFU/g for LP1, 9.79 log CFU/g for LP2, 4.67 log CFU/g for SC1 and 4.54 log CFU/g for SC2.
The microorganisms were cultivated in a discontinuous fermentation system (model Bioflo 2000, New Brunswick Scientific, USA) containing 4.5 L of culture media at 100 rpm for 15 h.
After each culture reached the stationary stage the fermentation was centrifuged (model NT-825, Novatécnica, Piracicaba, Brazil) at 6000 × g for 15 min at 4 °C. The supernatant was discarded and the biomass was washed twice with sterile peptone water 0.1 g 100 g-1 using the same proportion of the original broth volume and
re-suspended to 1/40 volume of
microorganisms in skimmed milk (10% m.v-1) as cryoprotectant (adapted FIORENTINI et al., 2009). The solution was frozen at – 20 °C in 50 mL falcons using only 1/3 of their capacity. The whole process was conducted under aseptic conditions.
Evaluation of fermentation
Samples were collected every 60 minutes consecutively for 15 h in sterile vials
for analysis of pH, absorbance, dry biomass and plate counts. The pH was measured by pH meter (model Q-400a, Quimis, Diadema,
Brazil) and absorbance in a
spectrophotometer (model U-2010, Hitachi, Tokyo, Japan) at 660 nm (OD 660nm) (ANASTASSIADIS et al., 2005; EDWARD et al. 2011). The dry biomass was obtained by filtration in Durapore HV 0.45 µm (Millipore) membranes and dried in an oven at 60 °C until constant weight. The result was expressed in g/L. The evaluation of growth was determined by plate counts of logarithm of the number of viable cells (log CFU/g). The LAB were grown in MRS Agar (Difco, Sparks, USA) at 30 ºC/48 h and the yeasts were grown in PDA Agar (HiMedia, Mumbai, India) with tartaric acid (10%) at 25 ºC/72 h. Results were expressed as mean ± standard deviation of three replicates in duplicate.
Specific growth rate and duplication time
The fermentation kinetics were carried out to verify the exponential time of each microorganism to make the largest collection of biomass. The specific growth rate, µ (h-1) and the doubling time, td (h) of
LAB and yeast were calculated from the growth curves of the number of viable cells (CFU/g) versus time (h).
The maximum specific growth rate was in accordance with the angular coefficient (inclination) of the linear equation of the natural logarithm of the number of colonies ln
273
Revista da Universidade Vale do Rio Verde, Três Corações, v. 13, n. 1, p. 270-283, 2015
[N] in function of the fermentation period t (h) related to the exponential growth phase, which was determined by the linear regression (RIBEIRO, HORRI, 2004).
The doubling time (td) was defined
by Montville (1997) and recorded according to Equation (1).
td = ln 2/ µ (1)
Lyophilization
Samples of microorganisms were placed in a lyophilizer (model LT1000, Terroni, São Carlos, Brazil) for 24 h at 90
µHg vacuum. The lyophilized cultures were
stored at - 20 °C.
Survival of the microorganisms after lyophilization
Survival was measured by a log of the number of viable cells in colony-forming units per g (log CFU/g), before and after lyophilization. An aliquot of the culture in milk solution was withdrawn and subjected to decimal dilution using 0.1 g 100 g-1 of sterile peptone water. It was then plated and incubated. The lyophilized samples were analyzed initially and after 6 months. They were, re-suspended in peptone water, diluted, plated and incubated (PALMFELDT, HAHN- HÄGERDAL, 2000). Experiments were performed in triplicate in three replications.
Statistical analysis
The statistical analysis was carried out using Statistica® software version 8.0 (Statsoft Inc., Tulsa, OK, USA). The fermentation growth kinetics during 15 h was studied by a simple linear regression model, given by Y= β0+ β1X + Ɛ, where X is the
fermentation time in hours. Differences between the means were established using one-way analysis of variance (ANOVA) followed by Tukey’s test. Differences at the 5% level (P < 0.05) were considered statistically significant.
RESULTS AND DISCUSSION
Fermentation growth kinetics
The estimated equations of analysis of linear regression for pH, absorbance at 660 nm, dry biomass and plate counts of microorganisms studied at 15 h are shown in Figure 1 (A, B, C and D).
The analyses of linear regression after 15 h indicated that the linear and angular coefficients of SC1 and SC2 and the angular coefficient of LP1 and LP2 regarding the rate of decrease of pH (Figure 1A) were statistically similar (P > 0.05). Therefore, H0
was not rejected for the F test at significance level of 5%, where H0 indicates that angular
coefficients are equal. All other contrasts showed statistical difference between treatments (P < 0.05). In the pH analysis a higher coefficient of determination for the
274
Revista da Universidade Vale do Rio Verde, Três Corações, v. 13, n. 1, p. 270-283, 2015
LAB (LP1: 0.9090; LP2: 0.9823) was observed, followed by the SC2 (0.8328) and SC1 yeasts (0.6577).
From the results obtained for the rate of increase in absorbance at 660nm during 15 h of fermentation (Figure 1B) it was observed that the regression coefficients of LP2/SC2 were equal. The linear coefficients were significantly different for LP1/SC2 and SC1/SC2. We observed a higher coefficient of determination in absorbance for LP2, followed by SC2; SC1 and LP1 (r2 = 0.9878; 0.9726; 0.9530; 0.8111). Corsetti et al. (2000) reported that the absorbance obtained exceed the registered maximum of 1.25 for a count of 9 CFU/g of LAB when cultivated at 24 °C in MRS broth. Counts of L. plantarum varied between 9.1 and 10.6 log CFU/g for the fermentations inoculated with the starter strains after 48 h of fermentation (EDWARD et al. 2011). The initial pH of L. brevis was 6.33 and at 10 h it was 4.98 (LEÓN et al., 2006).
The regression analysis relating to the increase of biomass during 15 h (Figure 1C), using F test to contrast angular coefficients, indicated that LP1 and SC2 differed between themselves; they showed different rates of growth at a significance level of 5%. All the other tests of comparison of angular coefficients did not show significant difference between treatments (P > 0.05). Regarding the linear coefficient, only SC1 and SC2 were equal. Other comparisons
between the linear coefficients were significantly different (P < 0.05). SC2 had the highest result of coefficient of determination for dry biomass of 0.9717, followed by LP2, SC1 and LP1. The Lactobacillus fermentum strain produced 2.8 g/L biomass compared to 2.6 g/L for L. mesenteroides ssp.
mesenteroides and 5.1 g/L produced by L. plantarum. The L. fermentum strain obtained
end counts of 11.6 (log CFU/g) with 18 h of fermentation, while L. plantarum presented 12.2 log CFU/g. The biomass produced by
Weissella paramesenteroides strains
BFE7601 and BFE7608 were only 1.4 and 3.7 g/L, respectively, and the counts in freeze-dried residue were between 11.3 and 12.2 log CFU/g. The fermentation time was between 8 and 14.5 h (EDWARD et al., 2011).
Regarding plate counts during 15 h (Figure 1D), regression analysis indicated that the angular and linear coefficients of SC1 and SC2 and the linear coefficient of LP1 and SC1 were statistically equal (P > 0.05). Consequently, H0 was not rejected by F test at
a significance level of 5%. All other comparisons between angular and linear coefficients showed statistical difference between treatments (P < 0.05). The highest coefficients of determination (r2) for plate counts were for LP2 (0.9926) and LP1 (0.9772), followed by SC2 (0.8159) and SC1 (0.7271). León et al. (2006) reported that L.
brevis showed a rapid growth from the
275
Revista da Universidade Vale do Rio Verde, Três Corações, v. 13, n. 1, p. 270-283, 2015
(absorbance 0.130), in 10 h with 11.91 log CFU/g (absorbance 1.180) reached in 12 h (the stationary phase) and decline at 21 h. Salovaara (2004) obtained similar growth values between 7 and 8 h of cultivation, with 9.28 CFU/g.
The highest growth rates were for LP1 and were observed after 15 h, with pH of 4.28 ± 0.16, absorbance of 1.793 ± 0.15 and 8.81 log CFU/g. Also after a period of 15 h, LP2 showed pH of 4.44 ± 0.01, absorbance of 2.346 ± 0.06 and 13.23 log CFU/g. Biomass production of 3.6 ± 0.28 and 3.5 ± 0.14 g/L were observed for LP1 and LP2, respectively. After 10 h, SC1 showed pH of 4.72 ± 0.30, while after 14 h SC2 showed 4.69 ± 0.17. Both yeasts presented the same biomass production of 1.6 ± 0.00 g/L, absorbance 1.479 ± 0.01 and 1.456 ± 0.01 and plate
counts of 7.68 log CFU/g and 7.50 log CFU/g, respectively.
The results showed that the yeasts presented growth rates higher than the LAB. However, the LAB presented higher biomass production and lower pH values. Starter cultures can be composed of individual strains of LAB or mixtures of LAB and yeasts. Their use ensures quality in bread making. The use of starter cultures requires prior knowledge of their biochemical characteristics and the baking potential of the microorganisms. The performance of isolated LAB has mainly been studied by characterization of the acidification properties such as pH, total titratable acidity and lactic and acetic acids, which are produced during sourdough fermentation (COLLAR, 1996; CORSETTI et al., 1998; HAMMES, GÄNZLE, 1998). pH T ime (hours) p H -2 0 2 4 6 8 10 12 14 16 4,0 4,2 4,4 4,6 4,8 5,0 5,2 5,4 5,6 5,8 6,0 6,2 6,4 : LP1 y = 6.6153 - 0.1412*x; r2 = 0.9090 : LP2 y = 6.3031 - 0.1287*x; r2 = 0.9823 : SC1 y = 5.3928 - 0.0452*x; r2 = 0.6577 : SC2 y = 5.3232 - 0.0538*x; r2 = 0.8328 A
276
Revista da Universidade Vale do Rio Verde, Três Corações, v. 13, n. 1, p. 270-283, 2015
Absorbance at 660 nm T ime (hours) A B S -2 0 2 4 6 8 10 12 14 16 0,0 0,2 0,4 0,6 0,8 1,0 1,2 1,4 1,6 1,8 2,0 2,2 2,4 2,6 : LP1 y = -0.3431 + 0.1182*x; r2 = 0.8111 : LP2 y = -0.1466 + 0.1735*x; r2 = 0.9878 : SC1 y = -0.2428 + 0.1456*x; r2 = 0.9530 : SC2 y = 0.0289 + 0.1039*x; r2 = 0.9726 Dry biomass T ime (hours) g / L -2 0 2 4 6 8 10 12 14 16 0,0 0,5 1,0 1,5 2,0 2,5 3,0 3,5 4,0 : LP1 y = 1.1618 + 0.1193*x; r2 = 0.8426 : LP2 y = 1.6765 + 0.109*x; r2 = 0.9369 : SC1 y = 0.4279 + 0.0954*x; r2 = 0.8953 : SC2 y = 0.361 + 0.091*x; r2 = 0.9717 B C
277
Revista da Universidade Vale do Rio Verde, Três Corações, v. 13, n. 1, p. 270-283, 2015
Plate counts T ime (hours) L o g C F U / g -2 0 2 4 6 8 10 12 14 16 4 5 6 7 8 9 10 11 12 13 14 : LP1 y = 5.3745 + 0.2545*x; r2 = 0.9772 : LP2 y = 7.1769 + 0.4337*x; r2 = 0.9926 : SC1 y = 5.7387 + 0.1437*x; r2 = 0.7271 : SC2 y = 5.8408 + 0.1308*x; r2 = 0.8159
Figure 1 - Evolution of pH (A), absorbance at 660nm (B), dry biomass (C) and plate counts (D) over time
Evaluation of specific growth rate duplication time
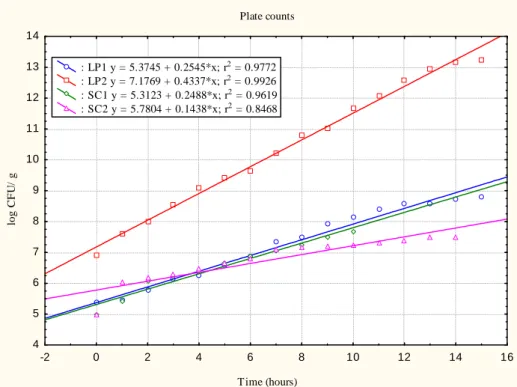
The evolution of plate counts in the exponential phase over time is illustrated in Figure 2. The specific growth rate and
doubling time of microorganisms are presented in Table 1. Plate counts T ime (hours) lo g C F U / g -2 0 2 4 6 8 10 12 14 16 4 5 6 7 8 9 10 11 12 13 14 : LP1 y = 5.3745 + 0.2545*x; r2 = 0.9772 : LP2 y = 7.1769 + 0.4337*x; r2 = 0.9926 : SC1 y = 5.3123 + 0.2488*x; r2 = 0.9619 : SC2 y = 5.7804 + 0.1438*x; r2 = 0.8468
Figure 2 - Evolution of plate counts in exponential phase over time
278
Revista da Universidade Vale do Rio Verde, Três Corações, v. 13, n. 1, p. 270-283, 2015
First order kinetic reactions can be used to describe changes in cell numbers during the exponential phase of growth. Food microbiologists generally use the doubling time (td) as a kinetic constant to describe the
rate of exponential growth (MONTVILLE, 1997). The length of the lag phase may vary
considerably; it may be short or even be absent if the inoculum is obtained from a culture in the exponential phase of growth. It may be long if the inoculum is obtained from a rich medium and the microorganism is placed in a minimally defined medium (INGRAHAM et al., 1997).
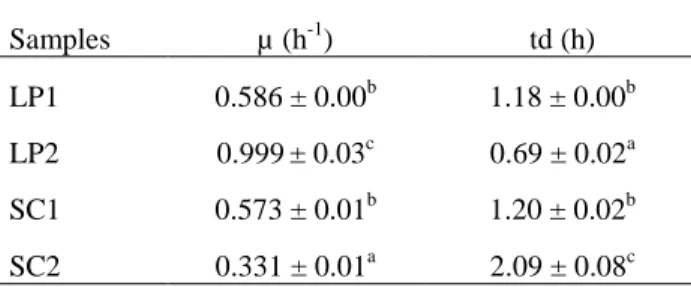
Table 1 - Specific growth rate (µ) and doubling time (td) of microorganisms
Samples µ (h-1) td (h)
LP1 0.586 ± 0.00b 1.18 ± 0.00b
LP2 0.999± 0.03c 0.69 ± 0.02a
SC1 0.573 ± 0.01b 1.20 ± 0.02b
SC2 0.331 ± 0.01a 2.09 ± 0.08c
Results as mean ± standard deviation. a–c Different superscript letters between samples in the same column denote significant differences (Tukey’s test, P < 0.05).
The exponential phase of the LP1 culture was 0 to 15 h. LP1 showed a specific growth rate of 0.586 h-1, corresponding to a doubling time of 1.18 h. Despite the fact that the inoculates originated from cultures in the exponential phase, a lag phase of 1 h was observed for LP1.
LP2 showed the same exponential phase as LP1 but its specific growth rate was greater at 0.999 h-1 with 0.69 h of doubling time, which was statistically different from the others (P < 0.05). In broth with LP2, the value of r2 was 0.9926, meaning that the adjustment of regression explains 99.26% of
the total variance of Y, but only 0.74% for the residual variation (error), which is considered a good fit.
Shin et al. (2000) reported that the mean doubling time of Bifidobacterium spp. grown in skimmed milk was 3.95 h.
Lactobacillus sp. (LB - 12) showed higher
specific growth rate and thus less doubling time (µ: 0.5480 h-1; Td: 1.2 h). Lactobacillus
acidophilus presented a specific growth rate
of 0.4930 h-1 and Td of 1.4 h (Brizuela et al.,
2001). Adamberg et al. (2003) found that during the decrease of pH from 6.2 to 5.8 the specific growth rate of L. bulgaricus was
279
Revista da Universidade Vale do Rio Verde, Três Corações, v. 13, n. 1, p. 270-283, 2015
almost constant (1.15 h-1). L. acidophilus and
L. paracasei had the lowest specific growth
rates (0.5 and 0.3 h-1), respectively.
In the broth with SC1 yeast, the exponential phase was lower (only 10 h) with 0.573 h-1 of specific growth rate and 1.20 h of doubling time. The regression coefficients for plate counts in the exponential phase of LP1 and SC1 were equal (P > 0.05). All other angular and linear coefficients were significantly different.
In the broth with SC2, the culture remained in the exponential phase for 14 h (0 to 14 h), time that was used to estimate the linear regression equation. The specific growth rate was 0.331 h-1, with the largest doubling time of 2.09 h, which was statistically different from the others (P < 0.05). The specific growth rate is a key control parameter in the industrial production of baker’s yeast (VAN HOEK et al., 1998).
Survival in relation to freezing and lyophilization
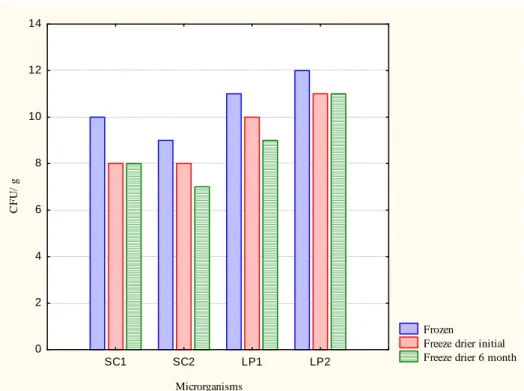
Frozen LP2 and LP1 presented similar results, 11.81 log and 11.28 CFU/g, respectively, considering a reduction of 0.53 log cycles. The highest index of survival after lyophilization was for LP2, which presented 1.65 log cycles more than LP1. Similar values to frozen LP1 and lyophilized LP2 were found, with 11.25 log CFU/g. These results are shown in Figure 3.
In relation to the yeasts, it is worth stating that before lyophilization SC1
presented 9.77 log CFU/g, while SC2 presented 8.91 log CFU/g, representing a reduction of 0.86 log cycles. The greatest index survival of the lyophilized samples was for SC1, with 8.30 log CFU/g, while SC2 presented 7.5 log CFU/g. During 6 months of storage a small reduction in the number of cells was observed. The results showed that the microorganisms in the study presented good stability, both before and after lyophilization, and that LP2 showed the lowest microbial reduction. Fiorentini et al. (2009) reported that cultures of
Staphylococcus xylosus strains stored for 1
and 6 months at -20 ºC presented good stability using the freeze-drying process. A small decrease in the number of cells was observed during storage, which was probably due to the positive effect of storage conditions and also the cryoprotectant that was used (skimmed milk). Desirable storage conditions for freeze-dried starters are freezing temperatures below -15 °C, and the absence of oxygen and humidity. Under these conditions, the optimal activity of the starter culture will be guaranteed for eight months (BUCKENHÜSKES, 1993). According to Carvalho et al. (2004), skimmed milk is able to prevent cellular damage by stabilizing the cell membrane and providing a protective coating for the cells. Zhao and Zhang (2005) reported that when the bacterial cells of L.
brevis and Oenococcus oeni were frozen more
280
Revista da Universidade Vale do Rio Verde, Três Corações, v. 13, n. 1, p. 270-283, 2015
both showed increased viability after freeze-drying. Microrganisms C F U / g Frozen
Freeze drier initial Freeze drier 6 month
SC1 SC2 LP1 LP2 0 2 4 6 8 10 12 14
Figure 3 - Survival of frozen and lyophilized microorganisms in log CFU/g
CONCLUSION
The results of this study showed that the yeasts presented growth rates higher than the LAB. However, the LAB presented higher biomass yields and lower pH values.
LP2 showed the same exponential phase as LP1, its specific rate of growth was higher and statistically different from the others (P < 0.05). SC2 showed the lowest specific growth rate (P < 0.05), different from LP2 and SC1. The microorganisms in this study presented good stability, before and after lyophilization, with LP2 showing the lowest microbial reduction.
ACKNOWLEDGMENTS
The authors thank to the Conselho Nacional de Desenvolvimento Científico e Tecnológico (CNPq), for their financial support.
REFERENCES
ADAMBERG, K.; KASKA, S.; PAALMEA, T.L.T. The effect of temperature and pH on the growth of lactic acid bacteria: a pH-auxostat study. International Journal of
Food Microbiology, v.85, p.171-183, 2003.
ANASTASSIADIS, S.; AIVASIDIS, A.; WANDREY, C.; REHM, H.J. Process
281
Revista da Universidade Vale do Rio Verde, Três Corações, v. 13, n. 1, p. 270-283, 2015
optimization of continuous gluconic acid fermentation by isolated yeast-like strains of
Aureobasidium pullulans. Biotechnology and
Bioengineering, v. 9, p. 494-501, 2005.
BRIZUELA, M. A.; SERRANO, P.; PÉREZ, Y. Studies on probiotics properties of two Lactobacillus strains. Brazilian Archives
Biology Technology, v. 44, p. 95–99, 2001.
BUCKENHÜSKES, H.J. Selection criteria for lactic acid bacteria to be used as starter cultures for various food commodities. FEMS
Microbiology, v. 12, p. 253-272, 1993.
CARVALHO, A.S.; SILVA, J.; HO, P.; TEIXEIRA, P.; MALCATA, F.X.; GIBBS, P. Relevant factors for the preparation of freeze-dried lactic acid bacteria. International
Dairy Journal, v. 14, p. 835-847, 2004.
COLLAR, C. Biochemical and technological assessment of the metabolism of pure and mixed cultures of yeast and lactic acid bacteria in breadmaking applications. Food
Science and Technology International, v. 2,
p. 349–367, 1996.
CORSETTI, A.; GOBBETTI, M.;
BALESTRIERI, F.; PAOLETTI, F.; RUSSI, L.; ROSSI, J. Sourdough lactic acid bacteria effects on bread firmness and staling. Journal
of Food Science, v. 6, p. 347–351,1998.
CORSETTI, A.; GOBETTI, M.; DE
MARCO, B.; BALESTRIERI, F.; RUSSI, L.; ROSSI, I. Combined effect of sourdough lactic acid bacteria and additives on bread firmness and staling. Journal Agricuture
Food Chemistry, v. 48, p. 3044-3051, 2000.
CORSETTI, A.; SETTANNI, L. Lactobacilli in sourdough fermentation. Food Research
International, v. 40, p. 539–558. 2007.
DE VUYST, L.; NEYSENS, P. The sourdough microflora: biodiversity and metabolic interactions. Trends Food Science
Technology, v. 16, p. 43-56, 2005.
EDWARD, V.A.; HUCH, M.; DORTU, C.; THONART, P.; EGOUNLETY, M.; VAN ZYL, P.J.; SINGH, S.; HOLZAPFEL, W. H.; FRANZ, C.M.A.P. Biomass production and small-scale testing of freeze-dried lactic acid bacteria starter strains for cassava fermentations. Food Control, v. 22, p. 389-395, 2011.
FIORENTINI, A.M.; SAWITZKI, M.C.;
BERTOL, T.M.; SANT’ANNA, E.S.
Viability of Staphylococcus xylosus isolated from artisanal sausages for application as starter cultures in meat products. Brazilian
Journal of Microbiology, v. 40, p.129-133,
2009.
GÄNZLE, M.G.; VERMEULEN, N.;
282
Revista da Universidade Vale do Rio Verde, Três Corações, v. 13, n. 1, p. 270-283, 2015
metabolism of lactic acid bacteria in sourdough. Food Microbiology, v. 24, p.128-138, 2007.
HÄGGMAN, M.; SALOVAARA, H.
Microbial re-inoculation reveals differences in the leavening power of sourdough yeast strains. Lebensm-Wiss Technology, v. 4, p.148–154, 2008.
HAMMES, W.P.; BRANDT, M.J.;
FRANCIS, K.L.; ROSENHEIM, J.;
SEITTER, M.F.H.; VOGELMANN, S.A. Microbial ecology of cereal fermentations.
Trends in Food Science and Technology, v.
16, p. 4-11, 2005.
HAMMES, W.P.; GÄNZLE, M.G.
Sourdough breads and related products. In:
Woods BJB Microbiology of Fermented
Foods, London: Blackie Academic/
Professional, 1998. p. 199–216.
HANSEN, A.; SCHIEBERLE, P. Generation of aroma compounds during sourdough fermentation: applied and fundamental
aspects. Trends in Food Science
Technology, v. 16, p. 85–94, 2005.
HANSEN, A. Sourdough bread. In: HUI, Y.H.; SHERKA, F. Handbook of food
science, technology and engineering, 4 ed.
Taylor and Francis Group, LLC, 2006, p.183-210.
INGRAHAM, J.L.; MAALØE, O.;
NEIDHARDT, F.C. Microbial growth. IN: PERRY, J.J.; STALEY, J.T. Microbiology: dynamics and diversity, Sauders College Publishing, 1997. p. 136-157.
LEÓN, A.M.; MONTOYA, O.I.; MOTATO, K.E.; GRANDA, D.M.; CARO, C.A.;
RESTREPO, J.M.; ECHEVERRI, S.;
VALENCIA, J.; QUINCHÍA, L. Bacterias ácido lácticas silvestres colombianas presentan propiedades adecuadas para la fabricación de masa ácida. Revista de la
Faculdade de Química Farmaceutica, v. 13,
p. 26-35, 2006.
LEROY, F.; DE VUYST, L. Functional lactic acid bacteria starter cultures for the food fermentation industry. Trends in Food
Science and Technology, v. 15, p. 67–78,
2004.
MONTVILLE, T.J. Principles which
influence microbial growth, survival and death in foods. In: DOYLE, M.P.; BEUCHAT, L.R.; MONTVILLE, T.J. Food microbiology: fundamentals and frontiers. Washington, DC, ASM, 1997. p. 13-29.
PALMFELDT, J.; HAHN-HÄGERDAL, B. Influence of culture pH on survival of
freeze-283
Revista da Universidade Vale do Rio Verde, Três Corações, v. 13, n. 1, p. 270-283, 2015
drying. International Journal of Food
Microbiology, v. 55, p. 235–238, 2000.
RIBEIRO, C.A.F.; HORII, J. Negative H2S
character and flocculation as yeast strain markers for inoculum recovery. Science
Agriculture, v. 61, p. 292-297, 2004.
SALOVAARA, H. Lactic acid bacteria in
cereal-based products. In: SALMINEN, S.;
VON WRIGHT, A.; OUWEHAND, A. Lactic acid bacteria, microbiology and functional aspects, New York, Marcel Dekker, 2004. p 115-135.
SANDINE, W. E. Commercial production
of dairy starter cultures. In: COGAN, T.M.;
ACCOLAS, J.P. Dairy starters culture, New York, J.P. VCH, 1996. p 101-129.
SHIN, H.S.; LEE, J.H.; PESTKA, J.J.; USTUNOL, Z. Growth and viability of commercial Bifidobacterium spp in skim milk containing oligosaccharides and inulin.
Journal of Food Science, v. 65, p. 884-887,
2000.
TULHA, J.; CARVALHO, J.; ARMADA, R.; FARIA-OLIVEIRA, F.; LUCAS, C.; PAIS, C.; ALMEIDA, J.; FERREIRA, C.
Yeast, the man’s best friend. In: INTECH
Open Acecss Publisher, 2011. p.255-278.
VAN HOEK, P.; VAN DIJKEN, J.P.; PRONK, J.T. Effect of specific growth rate on fermentative capacity of baker’s yeast.
Applied and Environmental Microbiology,
v. 64, p. 4226-4233, 1998.
WIJTZES, T.; DE WIT, J.C.; IN’T VELD, J.H.; VAN’TRIET, K.; ZWIETERING, M.H. Modelling bacterial growth of Lactobacillus
curvatus as a function of acidity and
temperature. Applied and Enviromental
Microbiology, v. 61, p. 2533–2539, 1995.
ZHAO, G.; ZHANG, G. Effect of protective agents, freezing temperature, rehydration media on viability of malolactic bacteria subjected to freeze-drying. Journal of
Applied Microbiology, v. 99, p. 333–338,