i INTEGRATED MASTER IN PSYCHOLOGY
ORGANIZATIONAL, SOCIAL AND WORK PSYCHOLOGY
Adaptation of the Loneliness at Work Scale
for the Portuguese population
Gonçalo Manuel Pereira da Silva Monteiro
dos Reis
M
ii
Adaptation of the Loneliness at Work Scale for the
Portuguese population
Gonçalo Manuel Pereira da Silva Monteiro dos Reis
June 2019
Dissertation presented in the Integrated Master in
Psychology of the Faculty of Psychology and
Educational Sciences of the University of Porto, with
the orientation of Professor Félix Neto (FPCEUP)
iii
LEGAL WARNINGS
The content of this dissertation reflects the author's perspectives, work and interpretations at the time of submission. This dissertation may contain both conceptual and methodological inaccuracies, which may have been identified at a later date. Therefore, any use of its contents
should be exercised with caution.
By submitting this dissertation, the author declares that it is the result of his own work, that it contains original contributions and that all the sources used are recognized, and that such sources are duly cited in the body of the text and identified in the references section. The author
also declares that he does not disclose in this dissertation any content whose reproduction is prohibited by copyright or industrial property rights.
iv Acknowledgements
Aos meus pais e irmã, por sempre me terem apoiado ao longo deste percurso.
À minha avó, aos meus tios e aos meus primos, por me proporcionarem momentos de alegria e descontração quando mais precisava.
Ao Prof. Dr. Félix Neto, por ter sido o meu guia neste caminho, com disponibilidade e conselhos valiosos.
Aos meus amigos, que partilharam comigo o sabor das vitórias e me deram alento perante os obstáculos.
v Resumo
O presente estudo pretende adaptar a Escala de Solidão no Trabalho (Wright, Burt, & Strongman, 2006) à população portuguesa, bem como determinar se existe validade convergente entre a solidão no trabalho, satisfação no trabalho e solidão e, ainda, investigar se as variáveis de satisfação no trabalho são preditoras das componentes da Escala de Solidão no Trabalho. Foi realizado um questionário online ao qual responderam 172 trabalhadores a tempo inteiro. Para adaptar a Escala de Solidão no Trabalho foi realizada uma análise fatorial exploratória. Todas as variáveis foram correlacionadas, com o objetivo de verificar a sua validade convergente. Foram feitas regressões lineares múltiplas para determinar se as variáveis da satisfação no trabalho predizem as subescalas privação emocional e companheirismo social. A Escala de Solidão no Trabalho apresentou resultados satisfatórios de fiabilidade. Os níveis de validade convergente foram expressivos entre todas as variáveis e as componentes da Escala de Solidão no Trabalho. A privação emocional foi predita pelas variáveis de satisfação no trabalho, enquanto que a predição do companheirismo social foi apenas parcialmente confirmada pelas mesmas. Concluiu-se que a versão adaptada da Escala de Solidão no Trabalho mede de forma fiável e válida a solidão no contexto de trabalho para a população portuguesa.
Palavras-chave: solidão no trabalho, privação emocional, companheirismo social, satisfação no trabalho
vi Abstract
This study aims to adapt the Loneliness at Work Scale (Wright, Burt, & Strongman, 2006) to the Portuguese population, and to determine whether there is convergent validity between loneliness at work, workplace satisfaction and loneliness, as well as to investigate whether the workplace satisfaction variables are predictors of the components of the Loneliness at Work Scale. It was created an online survey that was answered by 172 full-time workers. An exploratory factorial analysis was performed for the adaptation of the Loneliness at Work Scale. The existence of convergent validity was assessed through correlations between all variables. Multiple linear regressions were made to determine whether the variables of workplace satisfaction are predictors of the subscales emotional deprivation and social companionship. Results indicated expressive levels of reliability on the Loneliness at Work Scale, and a solid convergent validity between all the variables and the components of the scale. Emotional deprivation was predicted by the workplace satisfaction variables, while the prediction of social companionship was only partially confirmed by them. We concluded that the adapted version of the Loneliness at Work Scale reliably and validly measures loneliness in the work context, for the Portuguese population.
Key words: loneliness at work, emotional deprivation, social companionship, workplace satisfaction
vii Index 1. Introduction ... 1 1.1. Loneliness ... 1 1.2. Loneliness at work ... 2 1.3. Workplace satisfaction ... 3 1.4. Present study ... 4 2. Method ... 5 2.1 Sample ... 5 2.2 Measures ... 6 2.3 Procedure... 7 2.4 Data analysis... 8 3. Results ... 8 4. Discussion ... 13 References... 16
1
1. Introduction
1.1. Loneliness
Loneliness is a common, stressful, and ever-present phenomena (Russell, Peplau, & Cutrona, 1980) with growing importance, that affects individuals of all ages (Gierveld, 1998). On the one hand, loneliness can be viewed as a unidimensional construct, with different levels of intensity, if we consider it to be an unpleasant experience that occurs when the social relationships of the individual aren’t enough, at a quantitative or qualitative level (Perlman & Peplau, 1981). On the other hand, it can also be seen as a multidimensional phenomenon, if we consider it to be dependent of the way the individual perceives, experiences, and evaluates its loneliness, regardless of being alone or not (Gierveld, 1989).
Philosophers spoke about positive loneliness as an intentional alienation of everyday life and an orientation to goals such as reflection, meditation or communication with God (Gierveld, 1998). However, loneliness as the absence of communication with other people, of companionship, and of quality relationships is an undesired and negative phenomenon whose impact is the most prominent in young adults (Gierveld, 1998). This negative connotation of loneliness and the stigma associated to it leads to the individuals affected not always admitting their loneliness (Rotenberg & Kmill, 1992), which can result in personality disorders, adaptation difficulties, low self-esteem, extreme anxiety, or feelings of lack of control (Nerviano & Gross, 1976). At the same time, society’s norms and values regarding the optimal number of relationships, can affect people that don’t fulfil those ideals, by increasing the risk of them feeling lonely (Stessman, Ginsberg, Klein, Hammerman-Rozenberg, Friedman, & Cohen, 1996). Besides, it can influence those people’s own abilities to adjust to said norms and values (Stessman et al., 1996).
Even though a lack of social support indicates shortcomings in one’s personal resources, loneliness has more to do with the individual’s perception of such insufficiencies (Perlman & Peplau, 1984). Nevertheless, loneliness can be even more impactful and painful if the individual feels lonely in a social setting, instead of feeling lonely as a result of being, in fact, alone (Sermat, 1980).
Marriage is one of the protective factors of loneliness (Victor & Yang, 2012), since intimate relationships convey cohesion and a feeling of belonging to people’s lives (Gierveld, 1998). In fact, individuals who are divorced, widowed, separated from their
2 partners, that never married or that live alone, present a greater risk of experiencing loneliness, than individuals who are married (Stessman et al., 1996).
1.2. Loneliness at work
According to Wright, Burt and Strongman (2006), it is in the workplace that individuals can find company and create healthy interpersonal relationships. In fact, the act of working requires cooperation and it seems to increase the individual’s need for affiliation (Cacioppo, Hawkley, & Bernston, 2003). Nevertheless, being in a social environment might not be enough for some employees (Wright et al., 2006), since some workplaces present conditions that can cause social and emotional isolation or simply don’t provide an adequate atmosphere for genuine social connections (Wright, 2007). Thus, the concept of loneliness at work emerges and it can be divided into two different components: emotional deprivation and social companionship (Wright et al., 2006). Emotional deprivation is the individual’s perception of the emotional quality of the relationships established at work, while social companionship is related to the perception of quantifiable job characteristics such the adequacy of the amount of social interactions one has at work (Wright et al., 2006). Since the workplace is a social setting, there seems to be no obvious lack of social companionship, which leads to most of the feelings of loneliness at work arising from factors that shift the perception of the established relationships’ quality (Wright et al., 2006). Being displeased with the relationships’ quality is more associated with loneliness than the volume of interactions one objectively gets involved in (Wright at al., 2006).
Another influential cause for loneliness at work is the salary, since the higher the income, the less one feels lonely (Pinquart & Sorensen, 2001). A higher income might influence the variety and number of activities in which one has the opportunity to engage and, in its turn, those activities might work as a coping mechanism for the individual’s perception of their loneliness (Pinquart & Sorensen, 2001). In contrast, limited financial resources can inhibit the individual from seeking social activities and interactions, due to an associated low self-esteem (Pinquart & Sorensen, 2001), which will prolong the individual’s feelings of loneliness.
Loneliness is, then, a result of the individual’s lack of satisfaction with its own social experiences (Youngblade, Berlin & Belsky, 1999), since it is influenced not only by personal characteristics, but also by context variables (Rokach & Neto, 2005). This
3 lack of satisfaction can be transported to the work dimension. The workplace climate, that is the perception that a group of people share of their social environment, is an example of a loneliness at the workplace predictor as it is closely related to workplace satisfaction (Weiner & Craighead, 2010). The perception that an individual develops about the workplace climate, consequently, influences one’s motivation, attitudes, behavior, and capacity to establish quality relationships, leading to feelings of unbelonging and loneliness (Wright, 2005). Moreover, if workplace colleagues don’t share the same views and don’t have any experiences in common or if the workplace advocates competitiveness and individualism between employees, the quality of the relationships established might be low or perceived as insufficient, which may decrease levels of workplace satisfaction (Erdil & Ertosun, 2011) and increase levels of loneliness. Furthermore, if an individual has negative feelings and low levels of satisfaction towards its workplace and remains in that same job for a long time, its feelings of loneliness increase (Ernst & Cacioppo, 1999).
The physical and psychological symptoms of loneliness represent a risk for the workplace in which concerns employees’ safety and health conditions (Serpil, 2015), hence the study of loneliness at work being essential to help understand and solve organizational problems such as communication and interpersonal issues, that might contribute to a negative climate (Wright et al., 2006). To create a positive organizational climate is, consequently, to promote greater job satisfaction.
1.3. Workplace satisfaction
Over the years, philosophy and psychology focused on understanding what is a good life, how we can achieve it (Guignon, 1999) and how we can maintain it. Ultimately, happiness has been considered the pursuit of pleasure, meaning and engagement (Peterson, Park, & Seligman, 2005).
Likewise, satisfaction with the work one does has been a key topic in the last few decades (Warr, 2007). Even though workplace satisfaction is often operationalized only as job affective well-being, Warr (2007) separated from that perspective to create a model in the context of the workplace. On the one hand, Warr (2007) defined job affective well-being as global assessment of how well the subject feels while at work, and while well-being affected by personal and social characteristics. On the other hand, job satisfaction involves specific work-related facets such as satisfaction with coworkers and salary levels. Consequently, workplace satisfaction is a multifaceted construct that includes positive and negative states of arousal and is predicted differently according to the various work
4 characteristics (Warr, 2007). Therefore, it seems to be essential to examine both job-related affective well-being and job satisfaction in order to better capture workplace satisfaction (Wilks & Neto, 2013).
Satisfied employees are considered significant contributors to the efficiency and long-term accomplishments of an organization (Naumann, 1993). Furthermore, individuals who assess attitudinal objects in a favorable way tend to participate in activities that support or promote it, whereas individuals who assess it in a negative way tend to participate in activities that hinder or oppose it (Eagly & Chaiken, 1993). Attitudes towards the job should be linked to one’s own job behaviors, being work performance one of the most influenced by those attitudes (Eagly & Chaiken, 1993). Another strong predictor of job satisfaction seems to be employees’ income. When we ask most individuals why they work, the most common answer is related to the money they receive (Jurgensen, 1978). The comparison between the predicted income and the real income plays an important role in the individuals’ satisfaction, whereby a higher income leads to an increased satisfaction with the job (Clark & Oswald, 1996).
In conclusion, recognizing risk groups in the organizations and identifying explanations to their reduced levels of workplace satisfaction is essential, as it is that institutions apply the necessary changes to achieve greater employee satisfaction, such as a bigger flexibility in work schedules or the improvement of working conditions (Wilks & Neto, 2013). Consequently, workplace satisfaction is crucial to the employees’ psychological and physical well-being, impacting the workplace environment (Serpil, 2015).
1.4. Present study
The present study aims to achieve three goals.
Objective 1. To adapt the Loneliness at Work Scale (LAWS), by Wright, Burt and Strongman (2006) to the Portuguese population.
Objective 2. To investigate whether there is convergent validity between loneliness at work, loneliness, and the workplace satisfaction variables, namely, satisfaction with job life, job satisfaction and job affective well-being. It is expected convergent validity between loneliness at work and loneliness, as well as between loneliness at work and all workplace satisfaction variables. Particularly, it is hypothesized that loneliness at work
5 correlates positively with loneliness and negatively with the workplace satisfaction variables.
Objective 3. To investigate whether workplace satisfaction variables are predictors of emotional deprivation and social companionship. It is hypothesized for workplace satisfaction variables to be significant predictors of emotional deprivation, but not of social companionship.
2. Method
2.1 Sample
The sample is constituted by 172 individuals. In order to participate in the study, individuals had to be full time workers, at the time of the completion of the survey. The sample, mostly composed of females (72.7%), has an age range of 18 to 62 years old (M = 34.35, SD = 10.45).
All the participants are Portuguese, and most of them live in Porto (23.3%). Most of the participants are married or in a domestic partnership (55.2%), the remainder are either single or divorced. However, only 34.9% have one or more children. The education level of the participants in the sample is relatively high, since 70.9% of individuals possess a higher education.
Regarding the individuals’ current jobs’ characteristics, 93.6% of participants have only one job, while 6.4% have two jobs and the mean of working hours is 41:24h per week. The majority of the individuals (62.2%) earns less than 1200€ of monthly gross income and the remainder earns more than 1200€. Most of these employees (85.5%) are regular workers while 14.5 % are working students. Less than half of these workers (44.8%) report stability in their work schedule, but only 22.1% report work schedules based on turns. Concerning organization dimension, 51.7% of participants work in a big organization (with more than 250 workers) and the rest work in small or medium organizations (with less than 250 workers). Besides, when answering the survey, 1.2% of individuals were in a medical leave.
6
2.2 Measures
Sociodemographic Questionnaire. The questionnaire contains questions regarding participant’s age, gender, residence, marital status, number of children, educational level, number of jobs, number of working hours, monthly gross income, whether they were regular workers or working students, work schedule stability, shift work, organization dimension, and medical leave.
Satisfaction with job life. The Satisfaction with Job Life Scale was developed by Neto and Fonseca (2018) to measure a global and subjective evaluation of quality of life in work. The scale contains 5 items, such as ‘I am satisfied with my work life’, to which participants answers ranged from 1 (strongly disagree) to 5 (strongly agree). It was calculated a mean score of the 5 items, where higher scores meant higher satisfaction with one’s job. In the current sample, the internal consistency for this scale was considerably high, .93.
Job satisfaction. Job satisfaction was evaluated with a scale based on a measure by Warr, Cook and Wall (1979), adapted to the Portuguese population by Wilks and Neto (2013). With 16 items, the scale includes the most significant job facets commonly used in studies of the construct, encompassing both intrinsic and extrinsic variables such as opportunity to use skills, job demands and pressure, diversity of tasks, pay level, appropriate physical environment, job safety and career perspective. The scale included items such as “How satisfied am I with my work schedule”. Participants were instructed to rate their degree of satisfaction with each item on a 5-point Likert-type scale, ranging from 1 (very unsatisfied) to 5 (extremely satisfied). For the current sample, the scale showed a fairly high consistency level, .94. In the 16 items of the scale, a mean score was calculated, where greater scores indicated greater satisfaction
Job affective well-being. Job-related affective well-being was evaluated with the 12-item scale of Warr (1990), adapted to the Portuguese population by Wilks and Neto (2013). The items of the scale comprised six favorable feelings, namely enthusiastic contented, excited, comfortable, interested and relaxed, as well as six negative feelings, such as tense, anxious, gloomy, depressed, worried and miserable. In this scale, participants were required to report how they feel at work, selecting the degree to which they felt each of those feelings on a Likert-type scale, from 1 (Absolutely nothing) to 5 (Very much). The scale of the current study presented a high level of internal consistency, .85. As outlined by Warr (1990), the scale's negative adjectives were reversed and a mean
7 score of the 12 items was calculated, with higher scores showing greater global well-being on the job.
Loneliness. The brief Portuguese version of the Revised UCLA Loneliness Scale (Russell, Peplau, & Cutrona, 1980) was used (ULS-6; Neto, 1992, 2014). This six-item scale includes items such as 'I feel isolated from others.' Participants were requested to indicate how frequently they felt each affirmation on a scale from 1 (never) to 4 (often). The scale used in this study showed a high internal consistency (.87). It was also calculated a mean score of the 6 items of the scale, where higher scores indicated greater levels of loneliness.
Loneliness at work. The scale by Wright, Burt, and Strongman (2006) was developed to measure the individual´s loneliness at work. The scale contains two dimensions: emotional deprivation and social companionship. The 16 statements of the scale were answered from a range of 1 (strongly disagree) to 5 (strongly agree). It was calculated a mean score of the seven items of the subscale emotional deprivation and for the nine items of the subscale social companionship. Higher scores indicated greater levels of emotional deprivation and lower levels of social companionship. All items are present in Table 1.
2.3 Procedure
It was created an online survey, through Google Forms, and, subsequently, the link was shared with several institutions, organizations and individuals, which were allowed to share the link with as many people as they saw fit, in order to increase the number of participants. The survey, available to be responded from October to February, included the following measures, by order: Sociodemographic questionnaire, Satisfaction with Job Life Scale, Job Satisfaction Scale, Job Related Affective Well-Being Scale, UCLA Loneliness Scale and Loneliness at Work Scale.
To complete the survey, all the participants were informed, prior to their responses, about the study objectives, as well as the voluntary, anonymous and confidential nature of their participation, and the possibility of accessing the results of the study, afterwards.
8
2.4 Data analysis
Objective 1. To adapt the Loneliness at Work Scale to the Portuguese population, a factor analysis was conducted. The analysis had the aim of testing the scale’s adjustment to the multifactorial model composed by the subscales emotional deprivation and social companionship, as suggested by the theory of Weiss (1973) and proposed by the original scale of Wright, Burt and Strongman (2006). The analysis also aimed to verify whether each item fitted the respective subscale in the Portuguese population.
Objective 2. To analyse the presence of convergent validity between loneliness at work, loneliness, and workplace satisfaction variables, correlations were conducted between all of these.
Objective 3. To investigate if workplace satisfaction variables are predictors of loneliness at work, two multiple linear regressions were conducted: the first with the emotional deprivation as the dependent variable; and the second with the social companionship as the dependent variable.
Analysis of variance. To further investigate if significant differences were found in loneliness at work by some sociodemographic variables, t-tests were conducted. The sociodemographic variables were gender, education level (categorized by higher education and non-higher education), marital status (categorized by in a union with a partner and in no union), unstable work schedules, shift work, number of children (categorized by 0 children and 1 or more children) and organization dimension (characterized by small and medium organizations, that employ less than 250 workers, and big organizations, that employ more than 250 workers).
3. Results
Objective 1. The Kaiser-Meyer-Olkin (K-M-O) sampling adequacy measure and the Bartlett sphericity test were conducted to evaluate the suitability of factor analysis on the data set. The measurement of K-M-O shows the proportion of common variance in the observed variables, where values above .90 are deemed suitable for factor analysis (Tabachnik & Fidell, 1989). Since the K-M-O in this research was .91, the analysis is suitable. The Bartlett test of sphericity was utilized in combination with the factor analysis to verify for variable independence. The value obtained was 1703.54 (df = 120,
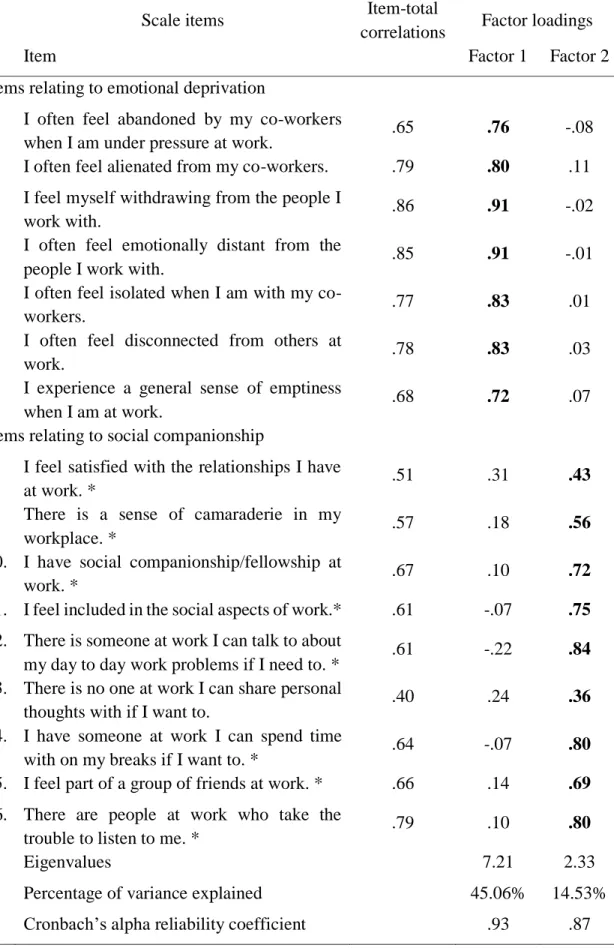
9 was greater than 10:1, which is deemed appropriate for conducting factor analytical methods (Kunce, Cook, & Miller, 1994). The item-total correlations varied from .40 to .86. Given that each item attained the required .40 item-total correlation cut-off as suggested by Nunnally (1978), all items were maintained for the factor analysis. Table 1 presents the item-total correlations.
The Kaiser test indicated that, for the factor analysis, two factors should be extracted (eigenvalues of 7.21 and 2.33 for each factor). A scree plot analysis verified this indication. In order to enable correlations between the factors, the selected extraction method was factor analysis with oblique rotation. While oblique rotation is less prevalent in psychological studies, it is often more accurate in representing the variables as the axes can rotate more easily and correlations between factors are possible (Wright et al., 2006). Table 1 shows the pattern matrix from the oblique rotation.
Items had high loadings on their associated factor with no cross loading above .40 on their corresponding factor. However, items 5 and 6 did not have high loadings on their corresponding factor, loading more strongly in the social companionship factor. These findings, while not equal, are equivalent to those described in the original article of this scale, defining two factors: emotional deprivation at work (items 1 to 9, excluding 5 and 6) and social partnership (items 10 to 16, including 5 and 6). The first factor explained 45.06% of the total variance of the scale and included seven negative items and two positive items, whereas the second factor explained 14.53% and consisted of six positive items and one negative item. The emotional deprivation factor evaluated the qualitative characteristics of co-worker interactions, including words such as ‘feel’ and ‘disconnected’ in its items. The item-loadings on this factor reflect Weiss' (1973) idea of emotional loneliness with items related to the perception of quality of working interactions. Consequently, this factor could be described as the perception of the emotional quality of one's connections in the workplace. The social companionship factor was linked with the quantitative elements of co-worker interactions, including words like 'share' and 'part of a community', expressions referring to a safe and reliable social partnership. The item-loadings of the social companionship factor represented the notion of social loneliness of Weiss (1973), depicting items related to social networks and the amount of social opportunities. This factor can be described as one's own interpretation of the quantifiable social elements of one's working interactions. The internal consistency was high for the emotional deprivation factor, with a value of .93, as for the social
10 companionship subscale, with a value of .87. Thus, this analysis confirms, now with a Portuguese sample, that there are two distinct dimensions of loneliness at work.
Table 1. Item-total correlations and pattern matrix for the loneliness at work scale
Scale items Item-total
correlations Factor loadings
Item Factor 1 Factor 2
Items relating to emotional deprivation
1. I often feel abandoned by my co-workers
when I am under pressure at work. .65 .76 -.08
2. I often feel alienated from my co-workers. .79 .80 .11
3. I feel myself withdrawing from the people I
work with. .86 .91 -.02
4. I often feel emotionally distant from the
people I work with. .85 .91 -.01
7. I often feel isolated when I am with my
co-workers. .77 .83 .01
8. I often feel disconnected from others at
work. .78 .83 .03
9. I experience a general sense of emptiness
when I am at work. .68 .72 .07
Items relating to social companionship
5. I feel satisfied with the relationships I have
at work. * .51 .31 .43
6. There is a sense of camaraderie in my
workplace. * .57 .18 .56
10. I have social companionship/fellowship at
work. * .67 .10 .72
11. I feel included in the social aspects of work.* .61 -.07 .75 12. There is someone at work I can talk to about
my day to day work problems if I need to. * .61 -.22 .84
13. There is no one at work I can share personal
thoughts with if I want to. .40 .24 .36
14. I have someone at work I can spend time
with on my breaks if I want to. * .64 -.07 .80
15. I feel part of a group of friends at work. * .66 .14 .69 16. There are people at work who take the
trouble to listen to me. * .79 .10 .80
Eigenvalues 7.21 2.33
Percentage of variance explained 45.06% 14.53%
Cronbach’s alpha reliability coefficient .93 .87
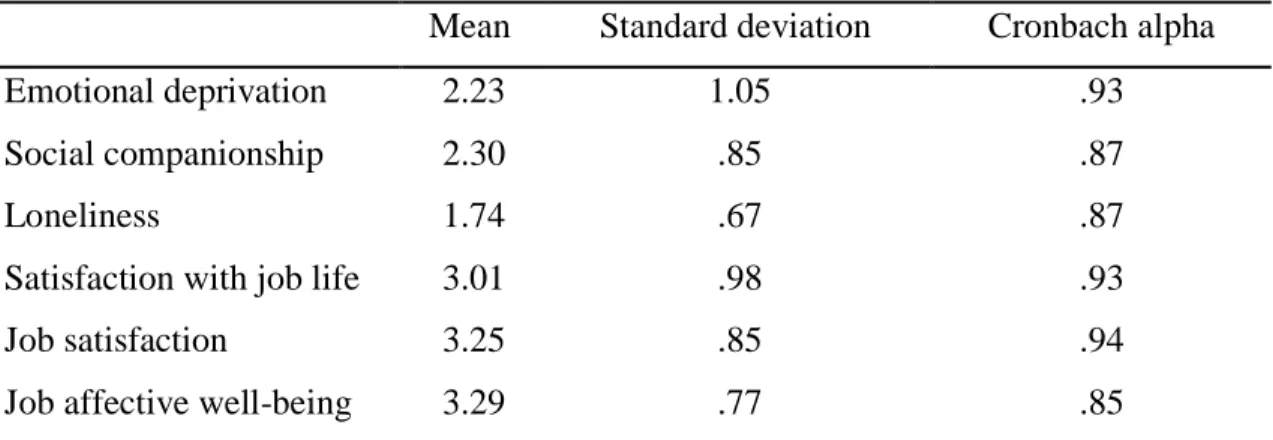
11 Objective 2. Table 2 presents the descriptive statistics of the scales used in this study. As showed in Table 3, there is a strong positive correlation between emotional deprivation and social companionship (r = .54, p > .01). Loneliness also correlated with these two factors of loneliness at work, displaying a strong positive correlation with emotional deprivation and social companionship (emotional deprivation: r = .77, p > .01; social companionship: r = .65, p > .01). Satisfaction with job life correlated negatively with the loneliness-related variables. Specifically, it exhibited a strong negative correlation with emotional deprivation (r = -.53, p > .01), and a moderate one with social companionship (r = -.35, p > .01), and loneliness (r = -.43, p > .01). Regarding job satisfaction, it also correlated strongly and negatively with the loneliness-related variables (emotional deprivation: r = -.55, p > .01; loneliness: r = -.52, p > .01), except with social companionship that presented a moderate one (r = -.40, p > .01), while displaying a strong positive correlation with satisfaction with job life (r = .66, p > .01). Finally, job affective well-being showed a strong negative correlation with emotional deprivation (r = -.60, p > .01) and loneliness (r = -.61, p > .01), a moderate negative correlation with social companionship (r = -.40, p > .01) and a strong positive correlation with satisfaction with job life (r = .58, p > .01) and job satisfaction (r = .59, p > .01).
Table 2. Descriptive statistics and reliabilities of the scales
Table 3. Intercorrelations among variables
Variables 1 2 3 4 5 6
1. Emotional deprivation -
2. Social Companionship .54* -
3. Loneliness .77* .65* -
4. Satisfaction with job life -.53* -.35* -.43* -
5. Job satisfaction -.55* -.40* -.52* .66* -
6. Job affective well-being -.60* -.40* -.61* .58* .59* -
Mean Standard deviation Cronbach alpha
Emotional deprivation 2.23 1.05 .93
Social companionship 2.30 .85 .87
Loneliness 1.74 .67 .87
Satisfaction with job life 3.01 .98 .93
Job satisfaction 3.25 .85 .94
Job affective well-being 3.29 .77 .85
12 Objective 3. After that, as displayed in Table 4, a multiple linear regression was conducted with emotional deprivation as the dependent variable and the satisfaction with job life, job satisfaction, and job affective well-being as the independent variables. It was concluded that the model is statistically significant for the prediction of emotional deprivation levels [F(3,168) = 42.50, p < .001, R2 = .43], and that satisfaction with job life [t(168) = 2.05, p = .04, B = .18, SE B = .09, β = .17], job satisfaction [t(168) = 2.57, p = 0.01, B = .26, SE B = .10, β = .21], and job affective wellbeing [t(168) = -5.05, p < .001, B = -.52, SE B = .10, β = -.38] are all statistically significant predictors.
A second multiple linear regression was made with the same independent variables but with social companionship as the dependent variable, as shown in Table 4. It was determined that the model is statistically significant for the prediction of social companionship levels [F(3,168) = 14.73, p < .001, R2 = .21], and that both job satisfaction
[t(168) = -2.25, p = .03, B = -.22, SE B = .10, β = -.22] and job affective well-being [t(168) = -2.59, p = .01, B = -.25, SE B = .10, β = -.23] are statistically significant predictors, while satisfaction with job life [t(168) = -.79, p = .43, B = -.07, SE B = .08, β = -.08] is not a statistically significant predictor.
Table 4. Multiple linear regressions
Emotional deprivation Social companionship
B SE B β t B SE B β t
Satisfaction with job life -.18 .09 -.17 -2.05* -.07 .08 -.08 -.79 Job satisfaction -.26 .10 -.21 -2.57* -.22 .10 -.22 -2.25* Job affective well-being -.52 .10 -.38 -5.05** -.25 .10 -.23 -2.59*
* p < .05; ** p < .01
Analysis of variance. There were found differences at social companionship by education level (p = .03) – individuals with higher education (M = 2.21, SD = .83) report higher levels of social companionship than individuals with no higher education (M = 2.52, SD = .87) - but not within emotional deprivation (p > .05). There were found no differences in gender, marital status, monthly gross income, unstable work schedules, shift work, number of children or organization dimension among any of the two variables (p > .05).
13
4. Discussion
Concerning the objective 1, the factor analysis shows that the adaptation of the Loneliness at Work Scale to the Portuguese population behaves similarly to the original scale, by Wright, Burt and Strongman (2006), even though two items belonging to the emotional deprivation factor had to be moved to the social companionship factor, namely item 5: ‘I feel satisfied with the relationships I have at work’, and item 6: ‘There is a sense of camaraderie in my workplace’. In fact, these items appear to be conceptually closer to the ones of the social companionship factor, such as ‘I feel included in the social aspects of work’, than with those of the emotional deprivation factor, such as ‘I often feel isolated when I am with my co-workers’, because of their phrasing that seems to be focused more on the perception of social aspects at work than on the perception of emotional quality of the interactions. Another reason for this might be the fact that all items in the emotional deprivation factor are constructed in the negative direction, while almost all items in the social companionship are constructed in a positive direction, the same as items 5 and 6. Therefore, the better fit of items 5 and 6 in the social companionship factor requires further examination, since it has to be determined whether it was conceptually relevant or influenced by the item wording (DiStefano & Motl, 2006).
Concerning the objective 2, emotional deprivation and social companionship proved to be strongly and positively correlated. These findings support the idea that, even though these are two conceptually distinct constructs, they are rooted in a common psychological construct (van Baarsen, Snijders, Smilt, & van Duijn, 2001). In addition, there was found strong positive correlations between the components emotional deprivation/social companionship and loneliness. This solidifies the convergent validity of the adaptation to the Portuguese population of the Loneliness at Work Scale, and is explained by, conceptually, being reasonable to conclude that the general concept of loneliness correlates with one specific dimension of it, namely, the work dimension. Moreover, there were moderate-to-strong positive correlations between the loneliness at work components and the satisfaction with job life/job affective well-being variables. First of all, it’s important to understand that these two work-related concepts are more focused on a global perspective individuals have about their work life then on a particular characteristics of their jobs. This correlation, that also contributes to further enhance the convergent validity of the adapted scale, might be explained because, even though emotional deprivation/social companionship and satisfaction with job life/job affective
14 well-being are dealing with different general constructs (loneliness and satisfaction), they are referring to the same life dimension, that is, work. Therefore, the variables were expected to be negatively correlated: when the quality of the relationships established at work are perceived as insufficient, the levels of loneliness in the workplace increase, something that, in turn, decreases the levels of workplace satisfaction (Erdil & Ertosun, 2011). Furthermore, the correlation between the loneliness at work components and the job satisfaction variable was also moderate-to-strong and positive. It was important to introduce the scale that measured job satisfaction because it gives a more cognitive understanding of the phenomenon (Kaplan, Warren, Barsky, & Thoresen, 2009), analyzing work life through various job facets such as salary level, work schedule, or the physical environment in which one executes his job. In conclusion, it was possible to obtain a solid convergent validity of this scale, with both loneliness and workplace satisfaction variables correlating satisfyingly with the components of loneliness at work, as hypothesized.
Regarding the objective 3, it was also confirmed that workplace satisfaction is a predictor of both emotional deprivation and partially confirmed that it is a predictor of social companionship, because of satisfaction with job life not being a significant predictor regarding this last component. This might be explained because the workplace is a social setting by itself and, while not being a guarantee of quality relationships, it provides more opportunities for social interactions (Wright et al., 2006). However, if a worker has adverse emotions about his workplace, that is, high levels of emotional deprivation, and stays for a lengthy amount of time in the same job, his feelings of loneliness are likely to increase (Ernst & Cacioppo, 1999): the dissatisfaction the individual feels about the emotional quality of his relationships at work contributes to his ever-increasing perception of loneliness at work. Concluding, it is partially confirmed the hypothesis of social companionship playing a minor role in the loneliness felt in the workplace, by comparison to emotional deprivation.
In the analysis of variances, there were found social companionship differences by education level, with individuals with higher education reporting higher levels of social companionship than the ones without higher education. Indeed, blue-collar workers, which are a group typically without higher education, characterized their jobs as lonelier (Mansfield, Koch, Henderson, Vicary, Cohn & Young, 1991), something that may stem from the fact that their repetitive tasks do not allow for as much interactions as the tasks that people with higher education usually perform. No differences of loneliness at work
15 by marital status were found, even though Victor and Yang (2012) argue that marriage can act as a protective factor of loneliness. Being so, it seems plausible that this effect would spill over to the workplace, leading to a mitigation of loneliness. Although there were found no differences in loneliness in the workplace by monthly gross income, Pinquart and Sorensen (2001) argue that the higher the income of the individual, the less he feels lonely. This can be attributed to one being able to afford to participate in more social events and activities that with less money could prove difficult for the individual to attend. In spite of not having found significant differences in loneliness at work by shift work, shift workers may often feel lonely because of their schedules that prohibits them of being present in many social and family events and, therefore, should be encouraged to grow their social networks as well as attenuate the loneliness with the companionship of fellow colleagues.
This study is not without limitations. Namely, it would have been advantageous to the determine if the scale demonstrates discriminant validity, but the correlations found with the variables used, while expressive, were not so high as to raise concerns about the different scales measuring the same construct. It would also be relevant, in future research, to investigate the relation of the loneliness at work with these job facets, in order to better understand the impact that the different job characteristics might have in the individual’s perception of loneliness. It may also be of interest to investigate how the relative weights of the two components in workplace satisfaction change if variables like organizational size or the quality of superiors’ relation with their subordinates are taken into account in a mediating role. Similarly, considering that it was not possible to test the scale’s stability - in other words, its ability to found similar results in subsequent applications, future research should explore its use in cross-sectional design research in order to assess temporal changes in loneliness in this context. However, the adapted Loneliness at Work Scale presented good reliability and validity and proved to be of easy application, proving itself as a useful tool for measuring loneliness in the workplace.
16 References
Cacioppo, J., Hawkley, L., & Berntson, G. (2003). The anatomy of loneliness. Current
Directions in Psychological Science, 12, 71-74.
Clark, A., & Oswald, A. (1996). Satisfaction and comparison income. Journal of Public
Economics, 61(3), 359-381.
DiStefano, C., & Motl, R. W. (2006). Further investigating method effects associated with negatively worded items on self-report surveys. Structural Equation Modeling,
13(3), 440-464.
Eagly, A. H., & Chaiken, S. (1993). The psychology of attitudes. California, CA: Harcourt Brace Jovanovich College Publishers.
Erdil, O. & Ertosun, O. G. (2011). The relationship between social climate and loneliness in the workplace and effects on employee well-being. Procedia Social
and Behavioral Sciences, 24, 505-525.
Ernst, J. & Cacioppo, J. (1999). Lonely hearts: Psychological perspectives on loneliness. Applied & Preventative Psychology, 8, 1-22.
Gierveld, J. d. J. (1989). Personal relationships, social support, and loneliness. Journal
of Social and Personal Relationships, 6(2), 197-221.
Gierveld, J. d. J. (1998). A review of loneliness: concept and definitions, determinants and consequences. Reviews in Clinical Gerontology, 8(1), 73-80.
17 Jurgensen, C. E. (1978). Job preferences (What makes a job good or bad?). Journal of
Applied Psychology, 63(3), 479−487.
Kaplan, S. A., Warren, C. R., Barsky, A. P., & Thoresen, C. J. (2009). A note on the relationship between affect(ivity) and differing conceptualisations of job
satisfaction: Some unexpected meta analytic findings. European Journal of Work
and Organizational Psychology, 18(1), 29–54.
Kunce, J. T., Cook, D. W., & Miller, D. E. (1975). Random variables and correlational overkill. Educational and Psychological Measurement, 35(3), 529-534.
Mansfield, P. K., Koch, P. B., Henderson, J., Vicary, J. R., Cohn, M., & Young, E. W. (1991). The job climate for women in traditionally male blue-collar occupations.
Sex Roles, 25(2), 63-79.
Naumann, E. (1993). Organizational predictors of expatriate job satisfaction. Journal of
International Business Studies, 24(1), 61-80.
Nerviano, V. J., & Gross, W. F. (1976). Loneliness and locus of control for alcoholic males: Validity against Murray need and Cattell trait dimensions. Journal of
Clinical Psychology, 32(2), 479-484.
Neto, F. (1992). Loneliness among Portuguese adolescents. Social Behavior and
Personality, 20(1), 15-21.
Neto, F. (2014). Psychometric analysis of the short-form UCLA Loneliness Scale (ULS-6) in older adults. European Journal of Ageing, 11(4), 313-319.
Neto, F., & Fonseca, A. C. M. (2018). The Satisfaction with job life scale among immigrants. Psychological Studies, 63(3), 209-218.
18 Nunnally, J. C. (1978). Psychometric theory. New York, NY: McGraw-Hill.
Perlman, D., & Peplau, L. A. (1981). Toward a social psychology of loneliness. In H. Duck & R. Gilmour (Eds.), Personal relationships in disorder (pp. 31-56). London: Academic Press.
Peterson, C., Park, N., & Seligman, M. E. (2005). Orientations to happiness and life satisfaction: The full life versus the empty life. Journal of Happiness Studies, 6(1), 25-41.
Pinquart, M., & Sorensen, S. (2001). Influences on loneliness in older adults: A meta-analysis. Basic and Applied Social Psychology, 23(4), 245-266.
Rokach, A. & Neto, F. (2005), Age, culture, and the antecedents of loneliness. Social
Behavior & Personality, 33(5), 477-494.
Rotenberg, K. J., & Kmill, J. (1992). Perception of lonely and non-lonely persons as a function of individual differences in loneliness. Journal of Social and Personal
Relationships, 9(2), 325-330.
Russell, D., Peplau, L. A., & Cutrona, C. E. (1980). The revised UCLA Loneliness Scale: Concurrent and discriminant validity evidence. Journal of personality and
social psychology, 39(3), 472-480.
Sermat, V. (1980). The anatomy of loneliness. Amsterdam: Vrije University.
Serpil, A. (2015). Loneliness as mediator between job satisfaction and intention to leave: a study on prison staff in Turkey. Arabian Journal of Business
19 Stessman, J., Ginsberg, G., Klein, M., Hammerman-Rozenberg, R., Friedman, R., &
Cohen, A. (1996). Determinants of loneliness in Jerusalem's 70-year-old population. Israel Journal of Medical Sciences, 32(8), 639-648.
Tabachnik, B. G., & Fidell, L. S. (1989). Using Multivariate statistics. New York, NY: Harper Collins.
Van Baarsen, B., Snijders, T. A., Smit, J. H., & Van Duijn, M. A. (2001). Lonely but not alone: Emotional isolation and social isolation as two distinct dimensions of loneliness in older people. Educational and Psychological Measurement, 61(1), 119-135.
Victor, C. R., & Yang, K. (2012). The prevalence of loneliness among adults: a case study of the United Kingdom. The Journal of Psychology, 146(2), 85-104.
Warr, P., Cook, J., & Wall, T. (1979). Scales for the measurement of some work attitudes and aspects of psychological well‐being. Journal of Occupational
Psychology, 52(2), 129-148.
Warr, P. (1990). The measurement of well‐being and other aspects of mental health.
Journal of Occupational Psychology, 63(3), 193-210.
Warr, P. (2007). Work, happiness, and unhappiness. London: Psychology Press.
Weiner, I. B. & Craighead, W. E. (2010). The corsini encyclopedia of psychology. New Jersey, NJ: John Wiley & Sons.
Weiss, R. S. (1973). Loneliness: The experience of emotional and social isolation. Massachussets, MA: The MIT Press.
20 Wilks, D. C., & Neto, F. (2013). Workplace well-being, gender and age: Examining the
‘double jeopardy’ effect. Social Indicators Research, 114(3), 875-890.
Wright, S. L. (2005). Loneliness in the workplace. New Zeland: University of Canterbury. Wright, S. L. (2007). The experience of loneliness in organisations. New Zeland:
University of Canterbury.
Wright, S. L., Burt, C. D., & Strongman, K. T. (2006). Loneliness in the workplace: Construct definition and scale development. New Zealand Journal of Psychology, 35, 59–68.
Youngblade, L. M., Berlin, L. J., & Belsky, J. (1999). Connections among loneliness, the ability to be alone, and peer relationships in young children. In K. J. Rotenberg & S. Hymel (Eds.), Loneliness in childhood and adolescence (pp. 135–152). New York, NY: Cambridge University Press.