Mitochondrial genomes of the
key zooplankton copepods Arctic
Calanus glacialis and North Atlantic
Calanus finmarchicus with the
longest crustacean non-coding
regions
Agata Weydmann
1,2, Aleksandra Przyłucka
1, Marek Lubośny
1, Katarzyna S. Walczyńska
2,
Ester A. Serrão
3, Gareth A. Pearson
3& Artur Burzyński
1We determined the nearly complete mitochondrial genomes of the Arctic Calanus glacialis and its North Atlantic sibling Calanus finmarchicus, which are key zooplankton components in marine ecosystems. The sequenced part of C. glacialis mitogenome is 27,342 bp long and consists of two contigs, while for C. finmarchicus it is 29,462 bp and six contigs, what makes them the longest reported copepod mitogenomes. The typical set of metazoan mitochondrial genes is present in these mitogenomes, although the non-coding regions (NCRs) are unusually long and complex. The mitogenomes of the closest species C. glacialis and C. finmarchicus, followed by the North Pacific C. sinicus, are structurally similar and differ from the much more typical of deep-water, Arctic C. hyperboreus. This evolutionary trend for the expansion of NCRs within the Calanus mitogenomes increases mitochondrial DNA density, what resulted in its similar density to the nuclear genome. Given large differences in the length and structure of C. glacialis and C. finmarchicus mitogenomes, we conclude that the species are genetically distinct and thus cannot hybridize. The molecular resources presented here: the mitogenomic and rDNA sequences, and the database of repetitive elements should facilitate the development of genetic markers suitable in pursuing evolutionary research in copepods.
Copepods of the genus Calanus are widely spread in the world ocean and are particularly important for the eco-systems of polar and sub-polar regions. In the northern hemisphere, the distributions of each species coincide with latitudinal gradients. In the northern North Atlantic Ocean there is C. finmarchicus with its distribution centres in the Labrador and Norwegian Seas. Further north there are C. glacialis, an Arctic shelf water species, and
C. hyperboreus, a deep oceanic one1,2. Most zooplankton biomass in the Arctic shelf seas is formed by the grazer C.
glacialis3–5, which, in this lipid-based food web, is a key link between low-energy microalgae and higher trophic
levels, including zooplankton, fish and planktivorous seabirds6–8. The species are usually sympatric, especially at
the limits of their distribution ranges. However, with the recently observed climatic changes, copepods are shift-ing their spatial distribution northwards, mostly due to seawater temperature rise9–11.
According to Bergmann clines, body sizes of ectotherm species within a genus, as well as of populations within a species, increase along temperature gradients towards colder areas12. Such a relationship has also been reported
for copepods of the genus Calanus, that generally live longer and have larger body sizes in higher latitudes of the Northern hemisphere2. The functional links between body and genome size in copepods, and their physiological,
1Institute of Oceanology, Polish Academy of Sciences, Sopot, 81-712, Poland. 2University of Gdansk, Institute of Oceanography, Gdynia, 81-378, Poland. 3University of Algarve, CCMAR, CIMAR, Faro, 8005-139, Portugal. Agata Weydmann and Artur Burzyński contributed equally to this work. Correspondence and requests for materials should be addressed to A.W. (email: [email protected])
Received: 12 July 2017 Accepted: 3 October 2017 Published: xx xx xxxx
morphological and ecological consequences have been studied by different authors13–15 leading to conclusions
that genome size is a key trait of organisms, although its adaptiveness is still unclear.
Calanus copepods are influenced by ongoing climate changes, especially the increasing temperatures in the
Arctic and sub-Arctic waters and sea-ice loss. Increasing numbers of C. finmarchicus are transported into the Arctic with the West Spitsbergen Current, which is the continuation of the North Atlantic Current, carrying boreal species northwards11. At the same time, due to the sea temperature rise, changes in population structure
are observed, possibly leading to earlier spawning and accelerated development, which in turn could lead to food web reorganization in the sub-Arctic regions16. Its sibling species, C. glacialis, which needs energy from the ice
algal bloom to fuel its reproduction, is also affected by increasing temperatures17 and the loss of sea ice. This may
lead to a mismatch between the primary production peaks and the reproductive cycle of this key species, with negative consequences for the higher trophic levels4. Due to the important role of both Calanus species in the
lipid-driven Arctic and sub-Arctic food webs, major functional changes in these marine ecosystems are antici-pated under climate warming.
In spite of the importance of the calanoid copepods for the ecosystems and as indicators of ongoing climatic changes, there is still a lack of consensus about the relationships among their lineages, in which high latitude spe-cies are especially under-represented. Mitochondrial DNA is useful for evolutionary studies and for reconstruct-ing the phylogenetic relationships of copepods, which is challengreconstruct-ing due to the morphological complexity of their taxonomic features18,19. Few copepods have their mitochondrial genomes published so far20, of which only one is
an Arctic calanoid, Calanus hyperboreus21. In this genus, within the superorder Gymnoplea22, only one species of
the northwest Pacific, Calanus sinicus, has its mitochondrial genome also known23. Both Calanus genomes exhibit
some unusual features, including the longest control region reported for a crustacean, a large tRNA gene cluster, and reversed GC (guanine-cytosine content) skews in most of the protein-coding genes in C. hyperboreus21, and
the concurrence of multiple non-coding regions and a reshuffled gene arrangement in C. sinicus23. The known
mitogenomes of Gymnoplea, having the length of 17,910 bp in the first one and 20,460 bp in the latter species, are also considerably longer than other known copepod mitochondrial genomes, all in the superorder Podoplea. Due to these unusual characters, the conservation of mitochondrial gene order in copepods has been questioned by some authors23,24, while others claim that copepod mitochondrial genomes retained pan-crustacean features
and conserved calanoid-specific patterns21 or adapted to harsh environments by mitogenome rearrangements24,25.
We aimed to sequence the mitochondrial genomes of the Arctic Calanus glacialis and its sibling species of the North Atlantic, Calanus finmarchicus, to study morphological and evolutionary relationships between high latitude copepods, and to obtain a database which will facilitate the development of genetic markers suitable in pursuing evolutionary processes in Calanus copepods, which in the future could be linked with climate change in the Arctic and sub-Arctic regions.
Results
Structure and composition of C. glacialis and C. finmarchicus mitogenomes.
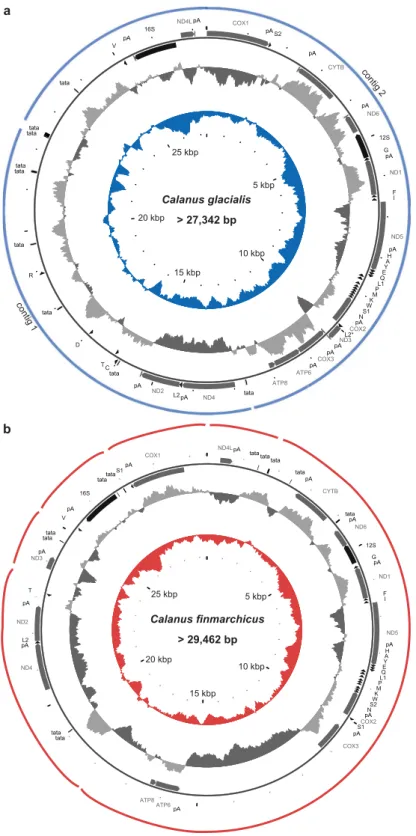
For C. glacialis, both NGS assemblers produced similar assembly. Despite a good coverage (approx. 100 fold), they were unable to retrieve the complete mitochondrial genome in one contig from the genomic data set. Instead, two contigs of 9,686 bp and 17,656 bp were generated. Based on the mapping of PE reads and the similarity of repeats at respec-tive contig ends, the two contigs were provisionally joined to form a circular entity. The resulting genetic map ofC. glacialis mitochondrial genome is presented in Fig. 1a. Numerous attempts to bridge the remaining gaps by Long Range PCR consistently failed. The sequenced part of the mitogenome is 27,342 bp long, but the complete genome could potentially be much longer.
For C. finmarchicus the assembly was even more fragmented and consisted of six relatively long contigs, with the following lengths: 1) 1,431 bp, 2) 17,682 bp, 3) 4,129 bp, 4) 1,417 bp, 5) 2,074 bp, and 6) 2,729 bp. Each of the contigs contained appreciable amount of the non-coding regions (NCRs). It was possible to scaffold the contigs only provisionally (Fig. 1b), despite PCR-based and in silico attempts. Nevertheless, the sequenced part of the mitogenome (29,462 bp) suggests that this mitogenome is even larger than that of C. glacialis.
The typical set of mitochondrial genes is present in these mitogenomes but NCRs are unusually long and complex. Surprisingly, neither genome is AT-rich, with the overall AT content of the sequenced part at 58.3%, the same in both species. Moreover, the strand asymmetry, typically associated with mitochondrial DNA, is negligi-ble: the difference in molecular weight between the two DNA strands is 0.05%, the G + T content of the “heavy” strand is 51.7% only, in C. glacialis.
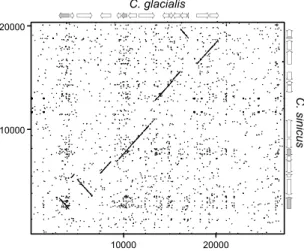
The comparison of the overall structures of the mitogenomes of C. glacialis and C. sinicus by dotplot revealed a substantial similarity in coding parts and lack of any homology outside coding regions (Fig. 2). There were also similarities in gene order, with a long stretch of genes shared between C. glacialis and C. sinicus. To formally analyse the relationship between gene orders of the four available mitogenomes of Calanus species, and calculate the rearrangement distances, CREx analysis was performed (Fig. 3). It confirmed greater rearrangement distance between C. hyperboreus and the pair of C. sinicus and C. glacialis, the latter two consistently presenting a closer relationship. The comparisons involving C. finmarchicus were limited to contig 2 and indicated one additional translocation involving nd3 gene, otherwise this mitogenome may have the same gene order as the MRCA of C.
glacialis and C. sinicus.
Non-coding regions.
There are at least three NCRs longer than 300 bp within the 17 kbp contig and only 2.5 kb of the 10 kbp contig is coding in C. glacialis. In addition, the ends of both contigs contain NCRs character-ized by complex repeats, hence their length is uncertain. Interestingly the NCRs are not particularly A + T-rich (Fig. 1). They also do not contain any orphan open reading frames of a significant length. The situation in C.fin-marchicus mitogenome is similar, only more tandem arrays of TATA repeats are present than in C. glacialis. There
Figure 1. Mitochondrial genomes organization: (a) of the Arctic copepod Calanus glacialis and (b) of the North
Atlantic Calanus finmarchicus. The span of the assembled contigs is indicated by the outer arches. All protein coding genes (CDS) are labelled by the names of the encoded proteins, two rrna genes are labelled 16 S and 12 S for large and small subunit, respectively. The trn genes are labelled by the one letter code of the respective amino acid, distinguishing the two possible anticodons by a number, wherever applicable. The supranumerary trnLTAA gene in (a) is distinguished by an asterisk. Direction of transcription is indicated by the position and direction of the arrows, with clockwise transcribed genes on the outside and anticlockwise transcribed genes on the inside of the circle representing the genome. Positions of polyadenlylation sites (pA) and microsatellite-like repeats (tata) are also indicated. The two inner circles represent local compositional bias, calculated in a 300 bp long window. The light grey parts of the first circle represent positive AT skew bias while the dark grey parts of this circle represent negative AT skews. The inner, color circle represents local GC (guanine-cytosine) content, relative to the reference 50%.
Ribosomal RNA and tRNA genes.
Surprisingly, the most A + T rich parts of the mitogenomes are the two rrn genes (Fig. 1). They are relatively short (1125 and 656 bp in both mitogenomes), but do align well with the respective genes of C. sinicus. The overall nucleotide p-distance between C. glacialis and C. sinicus 16 S genes is 20%, for 12 S gene the distance is 14%. For the pair of mitogenomes presented here these distances are 14% and 13%, respectively.The 22 expected trn genes are present in the C. glacialis mitogenome. They form a set typical for the inverte-brate mitochondrial genetic code. All four-fold degenerated codons are served by a tRNA with T at the first anti-codon (wobble) position within trn genes. The two-fold degenerated families have either T or G at this position, with the single exception of the trnM with C at the wobble position. Surprisingly, two copies of trnL2, both with TAA anticodon were found. They both should form typical, stable cloverleaf structures according to arwen, with comparable bitscores (30 and 31). One of the genes was located between nd2 and nd4, in the first contig, while
Figure 2. Dotplot comparison of the two Calanus mitogenomes: C. glacialis and C. sinicus. Forward and reverse
dotplots were overlaid to show the cases of reversed fragments. Schematic maps of both mitogenomes are on the margins, with protein coding genes (CDS) in white and rrn genes in grey. It is evident that non-coding parts of the genomes lack homology comparable with the homology of coding parts. The genes are also remarkably similar in length.
Figure 3. Parsimonious evolutionary scenario leading to the four extant gene orders. CREx analysis implies
that C. sinicus and C. glacialis gene orders can be derived from each other by as little as three reversed translocations. The gene order represented by C. hyperboreus is substantially more distant, separated by more than seven events. The ancestral gene orders proposed here fit these data well, with two events separating
C. sinicus and C. glacialis mitogenomes from their common ancestor and the further four events separating
common ancestor of all three species. Simple translocations are represented by black arrows, translocations with reversals by grey arrows. Black asterisks show the positions of major coding regions. Note that the non-sequenced part of C. sinicus and C. finmarchicus genomes (indicated by the question marks) will most likely contain the missing trn genes (C, D and R), which also fits this scenario well.
the alternative version was present between cox2 and nd3 in the second contig (L2* in Fig. 1). Since there is no way to dismiss one of them as a non-functional pseudogene, it must be tentatively assumed that there are 23 trn genes in the C. glacialis mitogenome. Twelve of the trn genes are found in one big cluster between cox2 and nd5.
The sequenced part of C. finmarchicus mitogenome does not contain all expected trn genes, the trnC, trnR, and trnD are missing. Notably, according to the analysis of gene order evolution, they are expected to be within the missing parts of the mitogenome (Fig. 3). One supranumerary trn gene was found in C. finmarchicus: the second copy of trnS1 gene, located in exactly the same space where the supranumerary trnL2 was found in C.
glacialis (Fig. 1).
Protein-coding genes.
All protein coding genes (CDS) typically expected in animal mtDNA are present in the C. glacialis and C. finmarchicus mitogenomes. Given the unusually loose overall structure of these genomes, it is surprising to note that the CDS lengths are largely unaffected, with the overall number of encoded amino acids at 3698-3701, within two amino acid difference of C. sinicus (Table 1). There are also seven new cases of incom-plete stop codons, in each of the cases the completion of the stop codon by polyadenylation of the transcript was confirmed by transcript mapping. These incomplete stop codons end cytb, nd1, and nd5 genes in both species andatp6 in C. finmarchicus.
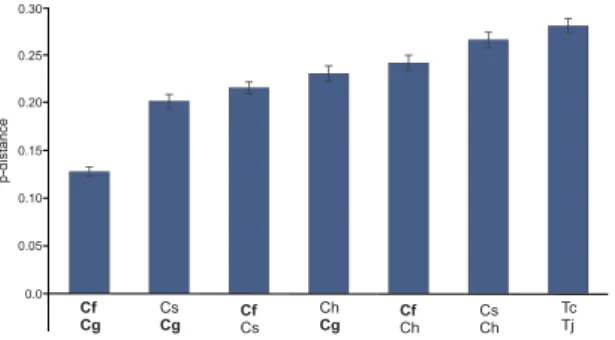
Genetic distances between the congeneric species were calculated based on concatenated CDS alignments (Fig. 4). The closest relative of C. glacialis is C. finmarchicus, followed by C. sinicus, however the overall genetic
CDS C. glacialis C. finmarchicus C. hyperboreus C. sinicus RSD
name bp aa bp aa bp aa bp aa % atp6 714 237 712 237 708 235 711 236 0.41 atp8 162 53 162 53 159 52 162 53 0.95 cox1 1557 518 1557 518 1546 515 1548 515 0.34 cox2 705 234 705 234 704 234 705 234 0.00 cox3 792 263 792 263 792 263 792 263 0.00 cytb 1133 377 1132 377 1137 378 1137 378 0.15 nd1 919 306 919 306 915 304 917 305 0.31 nd2 969 322 969 322 969 322 969 322 0.00 nd3 354 117 354 117 354 117 354 117 0.00 nd4 1302 433 1302 433 1302 433 1302 433 0.00 nd4l 336 111 336 111 336 111 336 111 0.00 nd5 1711 570 1712 570 1710 569 1723 574 0.39 nd6 474 157 483 160 474 157 480 159 0.95 All CDS 3698 3701 3690 3700 0.14
Table 1. Lengths of all mitochondrial protein coding genes (CDS) of four Calanus species (in base pairs, bp)
and the lengths of the corresponding amino acid chains (aa), with their relative standard deviation (RSD). The lengths of amino acid chains are obtained by dividing the length of nucleotide sequence by three and subtracting one (for the stop codon), except for the eleven cases of genes with incomplete stop codons (in boldface).
Figure 4. Estimates of intragenic polymorphism in Calanus and Tigriopus. Four Calanus (C. finmarchicus,
C. glacialis, C. sinicus, and C. hyperboreus labelled as Cf, Cg, Cs and Ch, respectively) and two Tigriopus (T. japonicus and T. californicus, Tj and Tc) species were compared. The dataset comprised concatenated amino
acid alignments of all mitogenome CDS. All positions with gaps and missing data were eliminated. There were a total of 3306 positions in the final dataset. The number of amino acid differences per site (p-distances) between sequences, with standard error estimates are shown. The average, uncorrected amino acid p-distance between
distance between them is still substantial. Uncorrected amino acid p-distances are larger than 12% in all cases. The distance between the two Tigriopus species, shown for comparison, is nevertheless even higher.
It is important to consider the local compositional biases in the highly rearranged and variable structure of the
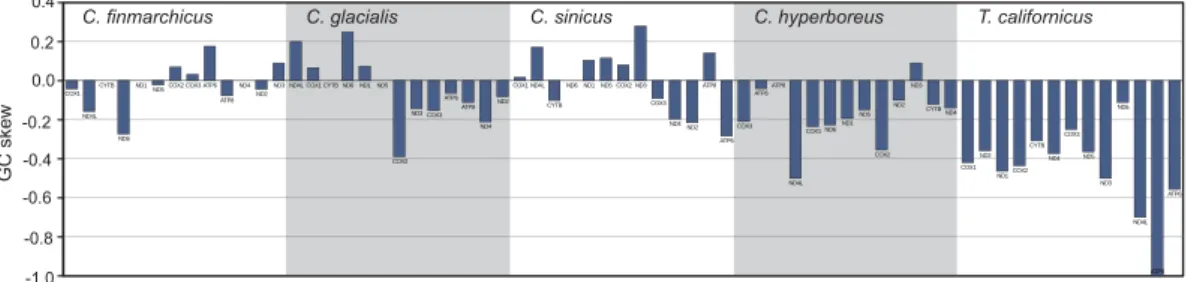
Calanus mitogenomes. Local AT skew (Fig. 1) shows excess of T over A in all CDS transcripts. However, subtle mutational pressures can only be traced by calculating skews at four-fold degenerated (selectively neutral) sites, as these should not be affected by compositional biases of encoded proteins. Particularly the GC skew at neutral sites is considered indicative of the orientation and proximity of regulatory elements. In the studied Calanus mitogenomes, the GC skew at neutral sites is highly irregular: the values are small and change both within each genome and between the congeneric genomes for the same genes (Fig. 5).
Nuclear background.
Nuclear genomes of the two Calanus species are expected to be complex and sequenc-ing them will require much more effort than a ssequenc-ingle NGS run. Nevertheless, the sequencsequenc-ing gave us the opportu-nity to check some basic properties of C. glacialis and C. finmarchicus nuclear genomes.In principle, it should be possible to estimate the size of the haploid genome from the distribution of unique k-mers26, providing the sequencing coverage is adequate. With 4.5 × 10¹⁰ bp obtained in the present study, the k-mer distribution analysis should yield a meaningful result if the sampled genome was similar to the human genome in size. The distributions of k-mer frequencies in our data did not have non-trivial maxima (data not shown), indicating large genomes, rich in repetitive sequences. An attempt has been made to assembly the most repetitive parts of the nuclear genomes. The two species are remarkably similar, but C. glacialis has more repeti-tive elements. Both the number of identified elements was higher: 4582 vs. 4204 for C. finmarchicus (at the same arbitrary assembly threshold of 45 × ), and they represented bigger fraction of the genome (30% vs 25%). The expansion of LINE elements in the genome of C. glacialis is probably responsible for this difference (Fig. 6).
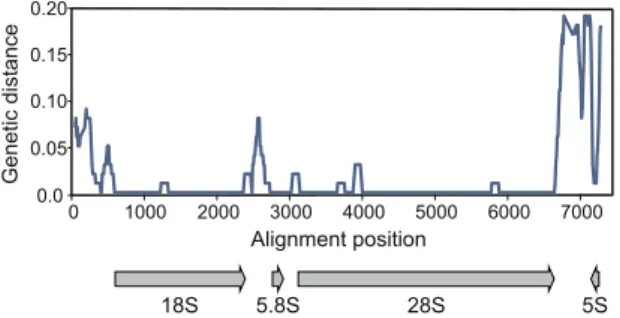
The most abundant repetitive element in both genomes is the rDNA gene cluster. The cluster apparently forms one or more arrays of tandem repeats, each containing the four rRNA genes (Fig. 7). The genetic distance between rRNA genes of the two studied Calanus species is remarkably low: there are no differences in 5.8 S, one substitu-tion in 18 S and 5 S and 34 substitusubstitu-tions in the longest 28 S gene (still, more than 99% sequence similarity). The average coverage of the consensus sequence was very high: 8600 × for C. glacialis and 5300 × for C. finmarchicus, again indicating more redundant structure of the former genome.
Discussion
The C. glacialis and C. finmarchicus mitogenomes, both longer than 27 kbp are the longest reported mitogenomes, not only within the superorder Gymnoplea: 17,910 bp in C. hyperboreus21 and >20,460 bp in C. sinicus23, but also Figure 5. Compositional bias at four-fold degenerate sites in CDS of the four Calanus species and T.
californicus. GC (guanine-cytosine) skew was calculated separately for each gene, based only on the most
neutral sites, that is four-fold degenerated positions. This index is particularly sensitive to mutational pressure associated with the relative position of the gene and the origin of replication. Native directions and relative positions of the genes were used, the charts start at the position of a major NCR in each species.
Figure 6. The classification of repetitive elements from the nuclear genome of C. glacialis (blue) and C.
finmarchicus (red). The elements represented by k-mer coverage greater than 45 were assembled by tedna,
resulting in 4582 elements from C. glacialis and 4204 elements from C. finmarchicus. These elements were then roughly classified by Teclass.
among Copepoda in general, including the species from the superorder Podoplea, which are relatively short and range from 13,440 bp in Caligus clemensi27 to 15,981 bp in Paracyclopina nana24. Such extraordinary lengths of
the C. glacialis and C. finmarchicus mitogenomes are caused by an unusual length of NCRs, a feature that was also observed in C. sinicus23. The 20,674 bp long sequence of C. glacialis mitochondrial genome, announced recently28,
is almost identical to contig 2 presented by us (>99% sequence similarity), extended at 3’ end with low complexity repeatable region of substantial length, therefore contrary to the description given by the authors, we believe that in fact this contig does not contain the complete set of mitochondrial genes (compare Fig. 1a).
The C. glacialis and C. finmarchicus mitogenomes are structurally similar to the mitochondrial genome of the North Pacific Calanus sinicus23 and differ from the much more typical mitogenome of the deep-water, Arctic
Calanus hyperboreus21. However, given the relatively large differences in sequence and structure of C. glacialis
and C. finmarchicus mitogenomes, it must be concluded that these two species are genetically distinct and have evolved independently for quite a long time. Thus, it seems unlikely that C. glacialis and C. finmarchicus can hybridize in the areas of sympatry29.
The structural similarities in copepod mitogenomes parallel the genetic distances in this case (Fig. 3 and Fig. 4), reflecting the general evolutionary trend for the expansion of NCRs within mitochondrial genomes of
Calanus species. An interesting consequence of this expansion is the unexpected property of their
mitochon-drial DNA: the AT-content of the sequenced part of the mitogenome appears to be similar to the average of the reported nuclear loci30, and lies within the range recorded for the sequenced nuclear DNA (Fig. 8), confirming
that the separation of mitochondrial and nuclear DNA by density gradient centrifugation is impossible.
The structure of mitogenome in arthropods is considered relatively stable. The gene order close to the one found in the mitogenome of Homarus americanus is usually seen as a typical, ground pattern21,27. Copepods are
exceptional arthropods because, with only a few complete mitogenomes published, they already present many deviations from the reference gene order20,24,27,31–33. However, the mitogenomes presented here are exceptional
even among copepods. There is only one other known example of a congeneric mitogenomes in Copepoda: the two Tigriopus species from the order Hapacticoidea and these mitogenomes are much more stable. Even though they substantially differ at the sequence level (Fig. 4), their structure is similar. In fact, the only difference between these two genomes is the position of trnW gene, but a closer look at the actual alignment of the mitogenomes suggests that even this small difference is only caused by inconsistent annotation and not a real, structural differ-ence. So, in the genus Tigriopus, in an evolutionary time long enough to accumulate substitutions in more than
Figure 7. Nucleotide distance at rDNA locus. Sliding window approach (300 bp long window in 10 bp steps)
was used to illustrate the conservation of nuclear rRNA genes between C. glacialis and C. finmarchicus. The locus is of similar size in both species but differs in the number of copies – there are approximately 1.6 times more copies of rDNA in genomic DNA of C. glacialis.
Figure 8. The relative distribution of GC (guanine-cytosine) content in genomic NGS reads. The two species
do not differ in GC content, the two distributions are very similar (solid line represents C. finmarchicus). Note that the mitogenome GC content (42%) lies well within this range, which apparently precludes the separation of mitochondrial DNA by density gradients in these species.
25% of mitochondrial amino acid positions, there was no change in gene order. Contrary to that, the rate of rear-rangements in the genus Calanus must be much greater, since despite the lower genetic distance (less than 20% aa p-distance, Fig. 4), there must have been at least four genomic rearrangements (Fig. 3), two involving large CDS and not just single trn genes as is usually the case34.
The expectation that the rearrangement and substitution rates are generally linked has been dismissed35, so in
theory, this effect could be the result of slower-than-average amino acid substitution rate in Calanus. However, mitogenome rearrangements have also a noticeable effect on the local compositional biases, particularly if they involve NCRs. Negative GC skew at neutral sites has been used as an argument for reversal of the origin of replica-tion in several species, including Tigriopus36,37. In the mitogenome of C. hyperboreus the GC skew at neutral sites
is also negative for all but the two shortest genes (Fig. 5). Similar conclusions have been reached when the data for all sites, not just the neutral ones, were used21. Still, the absolute skew values were smaller in C. hyperboreus
than in T. californicus, suggesting less stable mutational pressure in Calanus. This is further confirmed by GC skew at neutral sites in the three Calanus species with multiple NCRs: C. sinicus, C. finmarchicus and C. glacialis. The absolute GC skews are even smaller in these species, and the sign of the skew frequently differs between genes, even the neighbouring ones (Fig. 5). This pattern suggests independent replication from different NCRs and/or frequent change of the mutational pressure associated with mitochondrial DNA replication. Therefore, the increased rearrangement rate and not the slower substitution rate is responsible for the observed pattern of polymorphisms in Calanus.
Our inability to close all the gaps by PCR is not totally unexpected, as similar difficulties were encountered by other teams sequencing Calanus mitogenomes23. Their results can be viewed as a limitation of PCR technology
or as a proof of mitogenome fragmentation in C. sinicus23. Similar considerations apply to the presented
mitog-enomes of C. glacialis, and even more so C. finmarchicus: the assembled contigs may actually represent separate mitochondrial “chromosomes”, existing without a constant physical linkage, even if they can be mapped on a circular mitogenome. The lack of consistent compositional biases could be used as an argument supporting such hypothesis. Fragmented, linear mitochromosomes of medusozoan cnidarians often evolve gene duplications38,39
and are terminated by inverted repeats. Nearly all the contigs assembled from Calanus mitogenomes are termi-nated with palindromic repeats. Moreover, in the case of C. glacialis mitogenome we report the existence of two
trnL2 genes, one per each contig. So there are some arguments supporting atypical structure of the reported
mitogenomes, but they are not conclusive. Whatever the cause, these difficulties will not be solved without a breakthrough in sequencing technology allowing the reads to continue past difficult to amplify regions.
It has been argued that there is a relationship between body and genome size of keystone marine copepods15,40.
Larger genomes were observed in cold waters species, a feature linked to slower growth and metabolic rates at lower temperatures41,42. The DNA content of a single nucleus is very high in the two studied species: 13 pg in C.
finmarchicus and 24.2 pg in C. glacialis43. According to44 this translates to 1.27 and 2.37 × 10¹⁰ bp per genome, respectively. Clearly, our sequencing effort (at 4.5 × 10¹⁰ bp) was not enough to achieve a more precise estimate of the genome size. However, if either of the two genomes was in fact highly polyploid, the achieved coverage could have been adequate to estimate the size of the haploid equivalent. This was not the case, hence no direct support for polyploidization. According to45 the two species differ in the concentration of rDNA in their genomes – the
species with larger genome has also the higher concentration of rDNA, by approximately 17%. This suggests that the existing relationship between body and genome sizes in these species cannot be explained by simple polyploidization. Our data suggest even a greater disproportion in the concentration of rDNA between the two genomes (60% more rDNA in C. glacialis) and the expansion of certain classes of repeatable elements in this species.
In conclusion, large differences in the length and structure of C. glacialis and C. finmarchicus mitochondrial genomes indicate that the species are genetically distinct, so it is unlikely that they can hybridize. The molecular and evolutionary processes leading to the rapid structural evolution of both nuclear and mitochondrial genomes of these zooplankton species, key for the polar and sub-polar marine ecosystems, remain to be explained. We believe that the molecular resources presented here: the mitogenomic and rDNA sequences of the Arctic C.
gla-cialis and its North Atlantic sibling C. finmarchicus, as well as the database of repetitive elements should facilitate
the development of genetic markers suitable in pursuing this subject.
Methods
Sampling, DNA extraction and sequencing.
Calanus glacialis was collected from the Hornsund fjord(station 77°00.54′N 16°28.3′E, western Svalbard Archipelago) in August 2012 (250 individuals) and 2013 (150 individuals) and C. finmarchicus from the Norwegian Sea (73°30.06′N 13°04.1′E) in June 2013 (700 individuals), during the routine scientific cruises onboard r/v Oceania. To facilitate species identification and handling, mainly the fifth copepodites were hand-picked and kept in 95% ethanol until use.
The strategy to sequence mitogenomes of the two species assumed that it will be possible to start with the sequences of mitochondrial transcripts, then design PCR primers and close the gaps by direct sequencing of PCR products46,47. To identify mitotranscripts we used RNA-Seq data of - SRA project accession number SRP053198
for C. glacialis30 and the data of SRA project accession number SRP035889 for C. finmarchicus48. Transcript
assembly and identification followed the established pipeline49 and led to the identification of all CDS and rRNA
mitotranscripts. Several PCR primers were designed and most gaps between the transcriptomic contigs were closed, as planned. In this round, we worked with 250 individuals of C. glacialis and 450 of C. finmarchicus from which we extracted DNA using a modified CTAB protocol50. However, technical difficulties associated with
work-ing with limited amount of startwork-ing material and frustratwork-ing failures in several seemwork-ingly well-designed PCRs pre-cluded the realization of the original strategy. Moreover, since the overall genetic polymorphism in mitochondrial DNA of C. glacialis turned out to be very low51 we decided to continue the work with a heterogeneous sample
of high quality DNA. Consequently, an attempt has been made to isolate pure mitochondrial DNA by density gradient centrifugation.
The procedure described by Lang and Burger52 was applied, isopyknotic caesium chloride gradient
centrif-ugation was run for 16 h in an ultracentrifuge Beckman Coulter Optima L-90K with a vertical rotor. However, under long-wavelength UV we observed only a single DNA band, instead of expected separate mitochondrial and genomic DNA bands. Therefore, the procedure was repeated, starting with additional 150 individuals of C.
glacialis and 250 of C. finmarchicus, with extended centrifugation time to 24 h. Again, only a single DNA band
was obtained.
This highly purified DNA was used in NGS, in hope that the concentration of mitochondrial DNA would be high enough to allow a mitogenome assembly. To maximize our chances, one of the highest-throughput technol-ogies available was used, the Illumina HiSeq X-Ten. Because of the high concentration and purity of DNA, the sequencing library was prepared using PCR-Free kit (Macrogen). The library has average insert size of 440 bp. The resulting set of approx. 3 × 10⁸, 150 bp long, paired end (PE) sequence reads, was used in all subsequent analyses.
Gene identification and genome analysis.
The preliminary identification of mitochondrial transcripts in RNA-Seq datasets30 was performed using estwise algorithm implemented in wise2 software53, using hmmprofiles of all mitochondrial protein coding sequences (CDS). Identified transcripts were then used as baits in MITObim54 and NOVOPlasty55 assemblers to retrieve the mitogenomes from the sets of NGS sequencing
reads.
Gene annotations have been done semi-automatically. De novo prediction of all protein-coding genes was attempted using a set of algorithms implemented in CRITICA56, GLIMMER357 and wise2. For prediction of
RNA genes, ARWEN was used58. The available reasonable complete mitogenomes of the copepods from the
same genus, C. hyperboreus21 accession number: JX678968, C. sinicus23 accession number: GU355641, were
used to verify and fine-tune the annotations. The transcripts were mapped back onto the mitogenome contigs in CLC Genomics Workbench (version 9.5.4, QIAGENE) to verify consistency of gene annotations. Amino acid sequences for protein-coding genes were obtained using the invertebrate mitochondrial genetic code (NCBI translation table 5).
The obtained raw sequence reads are deposited in SRA database under the following accession numbers: SRR6063609 (C. glacialis) and SRR6065686 (C. finmarchicus), the assemblies are accessible through BioProject accessions: PRJNA411905 (C. glacialis) and PRJNA411907 (C. finmarchicus), the individual rDNA contigs are deposited in GenBank under accession numbers MF993123 and MF993124, mitochondrial contigs under MG001883 - MG001890.
There are several complete copepod mitogenomes in GenBank available for comparative analysis. However, they have a different organization and are also substantially distant from the mitogenome reported here, making meaningful comparison problematic. Therefore, the two congeneric sequences mentioned earlier were selected for a comparative analysis. The mitogenomic sequences of two harpacticoid copepod species from the genus
Tigriopus were also used in some comparative analyses: Tigriopus californicus DQ91737459 and Tigriopus sp.
AY95933827. All comparative analyses were performed following nucleotide alignment in MEGA760, all
nucleo-tide alignments were adjusted to correspond to amino acid alignments wherever possible, sites with alignment gaps were eliminated and bootstrap procedure with 1000 replicates was used to estimate standard errors.
For sequence manipulation such as extraction of genes and dotplot comparisons, EMBOSS suite was used61.
Analysis of gene order data was performed using several heuristics implemented in CREx web server62. Analysis
of k-mer frequency distributions were done in Jellyfish26 and the assembly of repeatable DNA was done in Tedna63,
the provisional classification of the assembled elements was done by TEclass64. All mapping and manipulation of
genomic reads were done in CLC Genomics Workbench.
References
1. Fleminger, A. & Hulsemann, K. Geographical range and taxonomic divergence in North Atlantic Calanus (C. helgolandicus, C.
finmarchicus and C. glacialis). Mar. Biol. 40, 233–248, https://doi.org/10.1007/BF00390879 (1977).
2. Conover, R. J. Comparative life histories in the genera Calanus and Neocalanus in high latitudes of the northern hemisphere.
Hydrobiol. 167/168, 127–142, https://doi.org/10.1007/BF00026299 (1988).
3. Tande, K. S. Calanus in North Norwegian fjords and in the Barents Sea. Polar Res. 10, 389–408, https://doi.org/10.3402/polar. v10i2.6754 (1991).
4. Søreide, J. E., Leu, E., Berge, J., Graeve, M. & Falk-Petersen, S. Timing of blooms, algal food quality and Calanus glacialis reproduction and growth in a changing Arctic. Glob. Change Biol. 16, 3154–3163, https://doi.org/10.1111/j.1365-2486.2010.02175.x
(2010).
5. Weydmann, A. et al. Ice-related seasonality in zooplankton community composition in a high Arctic fjord. J. Plankton Res. 35, 831–842, https://doi.org/10.1093/plankt/fbt031 (2013).
6. Węsławski, J. M., Koszteyn, J., Kwasniewski, S., Stempniewicz, L. & Malinga, M. Summer food resources of the little auk, Alle alle (L.) in the European Arctic seas. Polish Polar Res. 20, 387–403 (1999).
7. Karnovsky, N. J., Węsławski, J. M., Kwasniewski, S., Walkusz, W. & Beszczynska-Moeller, A. Foraging behavior of little auks in heterogeneous environment. Mar. Ecol. Prog. Ser. 253, 289–303, https://doi.org/10.3354/meps253289 (2003).
8. Falk-Petersen, S., Timofeev, S., Pavlov, V. & Sargent, J. R. Climate variability and possible effects on Arctic food chains: the role of
Calanus in Arctic-Alpine ecosystems and people in a changing environment (ed. Ørbæk, J. B. et al.). 147–166 (Springer, 2007).
9. Reygondeau, G. & Beaugrand, G. Future climate-driven shifts in distribution of Calanus finmarchicus. Glob. Change Biol. 17, 756–766, https://doi.org/10.1111/j.1365-2486.2010.02310.x (2011).
10. Chust, G. et al. Are Calanus spp. shifting poleward in the North Atlantic? A habitat modelling approach. ICES J. Mar. Sci. 71, 241–253, https://doi.org/10.1093/icesjms/fst147 (2014).
11. Weydmann, A. et al. Shift towards the dominance of boreal species in the Arctic: inter-annual and spatial zooplankton variability in the West Spitsbergen Current. Mar. Ecol. Prog. Ser. 501, 41–52, https://doi.org/10.3354/meps10694 (2014).
12. Atkinson, D. Temperature and organism size, a biological law for ectotherms? Adv. Ecol. Res. 25, 1–58, https://doi.org/10.1016/ S0065-2504(08)60212-3 (1994).
13. Gregory, T. R., Hebert, P. D. N. & Kolasa, J. Evolutionary implications of the relationship between genome size and body size in flatworms and copepods. Heredity 84, 201–208, https://doi.org/10.1046/j.1365-2540.2000.00661.x (2000).
14. Hessen, D. O. & Persson, J. Genome size as a determinant of growth and life-history traits in crustaceans. Biol. J. Linn. Soc. 98, 393–399, https://doi.org/10.1111/j.1095-8312.2009.01285.x (2009).
15. Leinaas, H. P., Jalal, M., Gabrielsen, T. M. & Hessen, D. O. Inter- and intraspecific variation in body- and genome size in calanoid copepods from temperate and arctic waters. Ecol. Evol. 6, 5585–5595, https://doi.org/10.1002/ece3.2302 (2016).
16. Weydmann, A., Walczowski, W., Carstensen, J. & Kwaśniewski, S. Warming of the Subarctic waters accelerates development of a key marine zooplankton Calanus finmarchicus. Global Change Biol. doi:https://doi.org/10.1111/gcb.13864 (2017).
17. Carstensen, J., Weydmann, A., Olszewska, A. & Kwaśniewski, S. Effects of environmental conditions on the biomass of Calanus spp. in the Nordic Seas. J. Plankton Res. 34, 951–966, https://doi.org/10.1093/plankt/fbs059 (2012).
18. Bucklin, A., Frost, B. W. & Kocher, T. D. DNA sequence variation of the mitochondrial 16S rRNA in Calanus (Copepoda; Calanoida): intraspecific and interspecific patterns. Mol. Mar. Biol. Biotechnol. 1, 397–407 (1992).
19. Blanco-Bercial, L., Bradford-Grieve, J. & Bucklin, A. Molecular phylogeny of the Calanoida (Crustacea: Copepoda). Mol. Phylogenet.
Evol. 59, 103–113, https://doi.org/10.1016/j.ympev.2011.01.008 (2011).
20. Easton, E. E., Darrow, E. M., Spears, T. & Thistle, D. The mitochondrial genomes of Amphiascoides atopus and Schizopera knabeni (Harpacticoida: Miraciidae) reveal similarities between the copepod orders Harpacticoida and Poecilostomatoida. Gene 538, 123–137, https://doi.org/10.1016/j.gene.2013 (2014).
21. Kim, S., Lim, B. J., Min, G. S. & Choi, H. G. The complete mitochondrial genome of Arctic Calanus hyperboreus (Copepoda, Calanoida) reveals characteristic patterns in calanoid mitochondrial genome. Gene 520, 64–72, https://doi.org/10.1016/j. gene.2012.09.059 (2013).
22. Huys, R. & Boxshall, G. A. Copepod Evolution. 468 pp. (RaySociety, 1991).
23. Minxiao, W., Song, S., Chaolun, L. & Xin, S. Distinctive mitochondrial genome of Calanoid copepod Calanus sinicus with multiple large non-coding regions and reshuffled gene order: useful molecular markers for phylogenetic and population studies. BMC
Genomics 12, 73, https://doi.org/10.1186/1471-2164-12-73 (2011).
24. Ki, J.-S., Park, H. G. & Lee, J.-S. The complete mitochondrial genome of the cyclopoid copepod Paracyclopina nana: a highly divergent genome with novel gene order and atypical gene numbers. Gene 435, 13–22, https://doi.org/10.1016/j.gene.2009.01.005
(2009).
25. Cameron, S. L., Johnson, K. P. & Whiting, M. F. The mitochondrial genome of the screamer louse Bothriometopus (phthiraptera: ischnocera): effects of extensive gene rearrangements on the evolution of the genome. J. Mol. Evol. 65, 589–604, https://doi. org/10.1007/s00239-007-9042-8 (2007).
26. Marçais, G. & Kingsford, C. A fast, lock-free approach for efficient parallel counting of occurrences of k-mers. Bioinformatics 27, 764–770, https://doi.org/10.1093/bioinformatics/btr011 (2011).
27. Jung, S.-O. et al. The complete mitochondrial genome of the intertidal copepod Tigriopus sp. (Copepoda, Harpactidae) from Korea and phylogenetic considerations. J. Exp. Mar. Biol. Ecol. 333, 251–262, https://doi.org/10.1016/j.jembe.2005.12.047 (2006). 28. Choquet, M., Alves Monteiro, H. J., Bengtsson-Palme, J. & Hoarau, G. The complete mitochondrial genome of the copepod Calanus
glacialis. Mitochondrial DNA B Resour. 2, 506–507, https://doi.org/10.1080/23802359.2017.1361357 (2017).
29. Parent, G. J., Plourde, S. & Turgeon, J. Natural hybridization between Calanus finmarchicus and C glacialis (Copepoda) in the Arctic and Northwest Atlantic. Limnol. Oceanogr. 57, 1057–1066, https://doi.org/10.4319/lo.2012.57.4.1057 (2012).
30. Ramos, A. A. et al. A transcriptome resource for the copepod Calanus glacialis across a range of culture temperatures. Mar. Genomics
23, 27–29, https://doi.org/10.1016/j.margen.2015.03.014 (2015).
31. Yasuike, M. et al. Genomic resources for sea lice: analysis of ESTs and mitochondrial genomes. Mar. Biotechnol. 14, 155–166, https:// doi.org/10.1007/s10126-011-9398-z (2012).
32. Feng, H. et al. Complete mitochondrial genome of Sinergasilus polycolpus (Copepoda:Poecilostomatoida). Mitochondrial DNA Part
A 27, 2960–2962, https://doi.org/10.3109/19401736.2015.1060460 (2016).
33. Su, Y.-B., Wang, L.-X., Kong, S.-C., Chen, L. & Fang, R. Complete mitochondrial genome of Lernaea cyprinacea (Copepoda: Cyclopoida). Mitochondrial DNA Part A 27, 1503–1504, https://doi.org/10.3109/19401736.2014.953112 (2016).
34. Bernt, M., Braband, A., Schierwater, B. & Stadler, P. F. Genetic aspects of mitochondrial genome evolution. Mol. Phylogenet. Evol. 69, 328–338, https://doi.org/10.1016/j.ympev.2012.10.020 (2013).
35. Jia, W. & Higgs, P. G. Codon Usage in Mitochondrial Genomes: Distinguishing Context-Dependent Mutation from Translational Selection. Mol. Biol. Evol. 25, 339–351, https://doi.org/10.1093/molbev/msm259 (2008).
36. Hassanin, A., Léger, N. & Deutsch, J. Evidence for Multiple Reversals of Asymmetric Mutational Constraints during the Evolution of the Mitochondrial Genome of Metazoa, and Consequences for Phylogenetic Inferences. Syst. Biol. 54, 277–298, https://doi. org/10.1080/10635150590947843 (2005).
37. Hassanin, A. Phylogeny of Arthropoda inferred from mitochondrial sequences: Strategies for limiting the misleading effects of multiple changes in pattern and rates of substitution. Mol. Phylogenet. Evol. 38, 100–116, https://doi.org/10.1016/j. ympev.2005.09.012 (2006).
38. Smith, D. R. et al. First Complete Mitochondrial Genome Sequence from a Box Jellyfish Reveals a Highly Fragmented Linear Architecture and Insights into TelomereEvolution. Genome Biol. Evol. 4, 52–58, https://doi.org/10.1093/gbe/evr127 (2012). 39. Kayal, E. et al. Evolution of Linear Mitochondrial Genomes in Medusozoan Cnidarians. Genome Biol. Evol. 4, 1–12, https://doi.
org/10.1093/gbe/evr123 (2012).
40. McLaren, I. A., Sevigny, J. M. & Corkett, C. J. Body sizes, development rates, and genome sizes among Calanus species. Hydrobiol.
167/168, 275–284, https://doi.org/10.1007/BF00026315 (1988).
41. Kozłowski, J., Konarzewski, M. & Gawelczyk, A. Cell size as a link between noncoding DNA and metabolic rate scaling. Proc. Natl
Acad. Sci. USA 100, 14080, https://doi.org/10.1073/pnas.2334605100 (2003). 42. Gregory, T. R. The evolution of the genome. (Elsevier Academic Press, 2005).
43. White, M. M. & McLaren, I. A. Copepod development rates in relation to genome size and 18S rDNA copy number. Genome 43, 750–755, https://doi.org/10.1139/g00-048 (2000).
44. Doležel, J., Bartoš, J., Voglmayr, H. & Greilhuber, J. Letter to the editor. Cytometry A 51A, 127–128 (2003).
45. Wyngaard, G. A., McLaren, I. A., White, M. M. & Sévigny, J.-M. Unusually high numbers of ribosomal RNA genes in copepods (Arthropoda: Crustacea) and their relationship to genome size. Genome 38, 97–104 (1995).
46. Smith, D. R. RNA-Seq data: a goldmine for organelle research. Brief. Funct. Genomics 12, 454–456, https://doi.org/10.1093/bfgp/ els066 (2013).
47. Soroka, M. et al. Next-generation sequencing of Dreissena polymorpha transcriptome sheds light on its mitochondrialDNA.
Hydrobiol. doi:https://doi.org/10.1007/s10750-017-3088 (2017).
48. Lenz, P. H. et al. De Novo Assembly of a Transcriptome for Calanus finmarchicus (Crustacea, Copepoda) – The Dominant Zooplankter of the North Atlantic Ocean. PLoS ONE 9, e88589, https://doi.org/10.1371/journal.pone.0088589 (2014).
49. Lubośny, M. et al. Next generation sequencing of gonadal transcriptome suggests standard maternal inheritance of mitochondrial DNA in Eurhomalea rufa (Veneridae). Mar. Genomics 31, 21–23, https://doi.org/10.1016/j.margen.2016.11.002 (2017).
50. Hoarau, G., Rijnsdorp, A. D., Van der Veer, H. W., Stam, W. T. & Olsen, J. L. Population structure of plaice (Pleuronectes platessa L.) in northern Europe: microsatellites revealed large-scale spatial and temporal homogeneity. Mol. Ecol. 11, 1165–1176, https://doi. org/10.1046/j.1365-294X.2002.01515.x (2002).
51. Weydmann, A. et al. Postglacial expansion of the Arctic keystone copepod Calanus glacialis. Mar. Biodiv. doi:10.1007/s12526-017-0774-4 (2017).
52. Lang, B. F. & Burger, G. Purification of mitochondrial and plastid DNA. Nat. Protoc. 2, 652–660, https://doi.org/10.1038/ nprot.2007.58 (2007).
53. Birney, E., Clamp, M. & Durbin, R. GeneWise and Genomewise. Genome Res. 14, 988–995, https://doi.org/10.1101/gr.1865504
(2004).
54. Hahn, C., Bachmann, L. & Chevreux, B. Reconstructing mitochondrial genomes directly from genomic next-generation sequencing reads—a baiting and iterative mapping approach. Nucleic Acids Res. 41, e129–e129, https://doi.org/10.1093/nar/gkt371 (2013). 55. Dierckxsens, N., Mardulyn, P. & Smits, G. NOVOPlasty: de novo assembly of organelle genomes from whole genome data. Nucleic
Acids Res. 45, e18–e18, https://doi.org/10.1093/nar/gkw955 (2017).
56. Badger, J. H. & Olsen, G. J. CRITICA: coding region identification tool invoking comparative analysis. Mol. Biol. Evol. 16, 512–524,
https://doi.org/10.1093/oxfordjournals.molbev.a026133 (1999).
57. Delcher, A. L., Harmon, D., Kasif, S., White, O. & Salzberg, S. L. Improved microbial gene identification with GLIMMER. Nucleic
Acids Res. 27, 4636–4641 (1999).
58. Laslett, D. & Canbäck, B. ARWEN: a program to detect tRNA genes in metazoan mitochondrial nucleotide sequences. Bioinformatics
24, 172–175, https://doi.org/10.1093/bioinformatics/btm573 (2008).
59. Burton, R. S., Byrne, R. J. & Rawson, P. D. Three divergent mitochondrial genomes from California populations of the copepod
Tigriopus californicus. Gene 403, 53–59, https://doi.org/10.1016/j.gene.2007.07.026 (2007).
60. Kumar, S., Stecher, G. & Tamura, K. MEGA7: Molecular Evolutionary Genetics Analysis Version 7.0 for Bigger Datasets. Mol. Biol.
Evol. 33, 1870–1874, https://doi.org/10.1093/molbev/msw054 (2016).
61. Rice, P., Longden, I. & Bleasby, A. EMBOSS: the European Molecular Biology Open Software Suite. Trends Genet. 16, 276–277,
https://doi.org/10.1016/S0168-9525(00)02024-2 (2000).
62. Bernt, M. et al. CREx: inferring genomic rearrangements based on common intervals. Bioinformatics 23, 2957–2958, https://doi. org/10.1093/bioinformatics/btm468 (2007).
63. Zytnicki, M., Akhunov, E. & Quesneville, H. Tedna: a transposable element de novo assembler. Bioinformatics 30, 2656–2658,
https://doi.org/10.1093/bioinformatics/btu365 (2014).
64. Abrusan, G., Grundmann, N., DeMester, L. & Makalowski, W. TEclass–a tool for automated classification of unknown eukaryotic transposable elements. Bioinformatics 25, 1329–1330, https://doi.org/10.1093/bioinformatics/btp084 (2009).
Acknowledgements
This research project was supported by the Polish Ministry of Science and Higher Education [Iuventus Plus grant no. IP2014 050573]; and FCT-CCMAR Portugal [Multi/04326/2013]. We thank prof. Igor Konieczny and dr Katarzyna Węgrzyn from the Laboratory of Molecular Biology at the Intercollegiate Faculty of Biotechnology UG&MUG for the possibility to use the ultracentrifuge. All computationally intense tasks were supported by PL-GRID infrastructure.
Author Contributions
A.W., A.B., E.A.S. and G.A.P. conceived the experiment. A.W. collected samples and identified species. A.W., A.P., M.L. and K.S.W. conducted the lab work. A.B. and A.W. analyzed the results and wrote the manuscript. All authors reviewed the manuscript.
Additional Information
Competing Interests: The authors declare that they have no competing interests.
Publisher's note: Springer Nature remains neutral with regard to jurisdictional claims in published maps and
institutional affiliations.
Open Access This article is licensed under a Creative Commons Attribution 4.0 International
License, which permits use, sharing, adaptation, distribution and reproduction in any medium or format, as long as you give appropriate credit to the original author(s) and the source, provide a link to the Cre-ative Commons license, and indicate if changes were made. The images or other third party material in this article are included in the article’s Creative Commons license, unless indicated otherwise in a credit line to the material. If material is not included in the article’s Creative Commons license and your intended use is not per-mitted by statutory regulation or exceeds the perper-mitted use, you will need to obtain permission directly from the copyright holder. To view a copy of this license, visit http://creativecommons.org/licenses/by/4.0/.