2
nd
Symposium on Languages,
Applications and Technologies
SLATE’13, June 20-21, 2013, Porto, Portugal
Edited by
José Paulo Leal
Ricardo Rocha
Alberto Simões
Editors
José Paulo Leal Ricardo Rocha Alberto Simões
CRACS & INESC TEC CRACS & INESC TEC CCTC & CEHUM
Faculdade de Ciências Faculdade de Ciências Instituto de Letras e Ciências Humanas Universidade do Porto Universidade do Porto Universidade do Minho
[email protected] [email protected] [email protected]
ACM Classification 1998
D.3 Programming Languages; D.2.12 Interoperability; I.2.7 Natural Language Processing;
ISBN 978-3-939897-52-1
Published online and open access by
Schloss Dagstuhl – Leibniz-Zentrum für Informatik GmbH, Dagstuhl Publishing, Saarbrücken/Wadern, Germany. Online available at http://www.dagstuhl.de/dagpub/978-3-939897-52-1.
Publication date
June, 2013
Bibliographic information published by the Deutsche Nationalbibliothek
The Deutsche Nationalbibliothek lists this publication in the Deutsche Nationalbibliografie; detailed bibliographic data are available in the Internet at http://dnb.d-nb.de.
License
This work is licensed under a Creative Commons Attribution 3.0 Unported license (CC-BY 3.0):
http://creativecommons.org/licenses/by/3.0/legalcode.
In brief, this license authorizes each and everybody to share (to copy, distribute and transmit) the work under the following conditions, without impairing or restricting the authors’ moral rights:
Attribution: The work must be attributed to its authors.
The copyright is retained by the corresponding authors.
Digital Object Identifier: OASIcs.SLATE.2013
iii
OASIcs – OpenAccess Series in Informatics
OASIcs aims at a suitable publication venue to publish peer-reviewed collections of papers emerging from a scientific event. OASIcs volumes are published according to the principle of Open Access, i.e., they are available online and free of charge.
Editorial Board
Daniel Cremers (TU München, Germany)
Barbara Hammer (Universität Bielefeld, Germany)
Marc Langheinrich (Università della Svizzera Italiana – Lugano, Switzerland)
Dorothea Wagner (Editor-in-Chief, Karlsruher Institut für Technologie, Germany)
ISSN 2190-6807
www.dagstuhl.de/oasics
Contents
Preface
José Paulo Leal, Ricardo Rocha,and Alberto Simões . . . i
Keynotes
Software Languages: The Lingusitic Continuum
Jean-Marie Favre . . . 3
Picat: A Scalable Logic-based Language and System
Neng-Fa Zhou . . . 5
Software Development Tools
Or-Parallel Prolog Execution on Clusters of Multicores
João Santos and Ricardo Rocha . . . 9
NESSy: a New Evaluator for Software Development Tools
Enrique Miranda, Mario Berón, German Montejano, Maria João Varanda Pereira, and Pedro Rangel Henriques . . . 21
Supporting Separate Compilation in a Defunctionalizing Compiler
Georgios Fourtounis and Nikolaos S. Papaspyrou . . . 39
Towards Automated Program Abstraction and Language Enrichment
Sergej Chodarev, Emília Pietriková, and Ján Kollár . . . 51
XML and Applications
Publishing Linked Data with DaPress
Teresa Costa and José Paulo Leal . . . 67
Seqins - A Sequencing Tool for Educational Resources.
Ricardo Queirós, José Paulo Leal, and José Campos . . . 83
XML to Annotations Mapping Patterns
Milan Nosáľ and Jaroslav Porubän . . . 97
Retreading Dictionaries for the 21st Century
Xavier Gómez Guinovart and Alberto Simões . . . 115
Learning Environment Languages
A Flexible Dynamic System for Automatic Grading of Programming Exercises Daniela Fonte, Daniela da Cruz, Alda Lopes Gançarski,
and Pedro Rangel Henriques . . . 129
CodeSkelGen - A Program Skeleton Generator
Ricardo Queirós . . . 145
2nd
Symposium on Languages, Applications and Technologies (SLATE’13). Editors: J. P. Leal, R. Rocha, A. Simões
OpenAccess Series in Informatics
vi Contents
Choosing Grammars to Support Language Processing Courses Maria João Varanda Pereira, Nuno Oliveira, Daniela da Cruz,
and Pedro Rangel Henriques . . . 155
Domain Specific Languages
Role of Patterns in Automated Task-Driven Grammar Refactoring
Ján Kollár and Ivan Halupka . . . 171
Defining Domain Language of Graphical User Interfaces
Michaela Bačíková, Jaroslav Porubän, and Dominik Lakatoš . . . 187
ABC with a UNIX Flavor
Bruno M. Azevedo and José João Almeida . . . 203
Specifying Adaptations through a DSL with an Application to Mobile Robot Navigation André C. Santos, João M. P. Cardoso, Pedro C. Diniz, and Diogo R. Ferreira . . . 219
Natural Language Processing
Dictionary Alignment by Rewrite-based Entry Translation
Alberto Simões and Xavier Gómez Guinovart . . . 237
Combining Language Independent Part-of-Speech Tagging Tools
György Orosz, László János Laki, Attila Novák, and Borbála Siklósi . . . 249
Comparing Different Machine Learning Approaches for Disfluency Structure Detection in a Corpus of University Lectures
Henrique Medeiros, Fernando Batista, Helena Moniz, Isabel Trancoso,
and Luis Nunes . . . 259
Syntactic REAP.PT: Exercises on Clitic Pronouning
Committees
Program Chairs
José Paulo Leal
Universidade do Porto, Portugal
Ricardo Rocha
Universidade do Porto, Portugal
Alberto Simões
Universidade do Minho, Portugal
Publication Chair
Alberto Simões
Universidade do Minho, Portugal
Program Committee
Ademar Aguiar
Universidade do Porto, Portugal
Alberto Proença
Universidade do Minho, Portugal
Alberto Simões
Universidade do Minho, Portugal
Alda Lopes Gançarski
Institut Mines-Télécom/Télécom SudParis, France
Alexander Paar
TWT GmbH Science and Innovation, Germany
António Menezes Leitão
Universidade Técnica de Lisboa, Portugal
António Teixeira
Universidade de Aveiro, Portugal
Bastian Cramer
Universitãt Paderborn, Germany
Boštjan Slivnik
Univerza v Ljubljani, Slovenia
Brett Drury
Universidade do Porto, Portugal
Casiano Rodriguez-Leon
Universidad de La Laguna, Spain
Claude Marché
Inria & Université Paris-Sud, France
Cristina Ribeiro
Universidade do Porto & INESC TEC, Portugal
Daniela da Cruz
Universidade do Minho, Portugal
David Insa
Universitat Politècnica de València, Spain
Fernando Batista
ISCTE-IUL & INESC-ID, Portugal
Gabriel David
Universidade do Porto & INESC TEC, Portugal
Giovani Librelotto
Universidade Federal Santa Maria, Brazil
Hugo Gonçalo Oliveira
Universidade de Coimbra, Portugal
Ivan Lukovic
University of Novi Sad, Serbia
Jean-Cristophe Filliâtre
CNRS & Université Paris Sud, France
Jean-Marie Favre
Université Joseph Fourier, Grenoble, France
João Correia Lopes
Universidade do Porto & INESC TEC, Portugal
João Lourenço
Universidade Nova de Lisboa, Portugal
João Paiva Cardoso
Universidade do Porto, Portugal
Jörg Tiedemann
Uppsala University, Sweeden
Jorge Baptista
Universidade do Algarve, Portugal
José Carlos Ramalho
Universidade do Minho, Portugal
2nd
Symposium on Languages, Applications and Technologies (SLATE’13). Editors: J. P. Leal, R. Rocha, A. Simões
OpenAccess Series in Informatics
xiv Committees
José João Almeida
Universidade do Minho, Portugal
José Paulo Leal
Universidade do Porto, Portugal
Josep Silva
Universitat Politècnica de València, Spain
Lluís Padró
Universitat Politècnica de Catalunya, Spain
Luis Ferreira
Instituto Politécnico do Cávado e Ave, Portugal
Marcos Garcia
Universidade de Santiago de Compostela, Spain
María Inés Torres Barañano Universidad del País Vasco, Spain
Maria João Varanda Pereira
Instituto Politécnico de Bragança, Portugal
Mario Berón
Universidad Nacional de San Luis, Argentina
Marjan Mernik
Univerza v Mariboru, Slovenia
Matej Crepinsek
Univerza v Mariboru, Slovenia
Miguel Ferreira
Universidade do Minho, Portugal
Mikel Forcada
Universitat d’Alacant, Spain
Mirjana Ivanovic
University of Novi Sad, Serbia
Nuno Ramos Carvalho
Universidade do Minho, Portugal
Nuno Oliveira
Universidade do Minho, Portugal
Pablo Gamallo
Universidade de Santiago de Compostela, Spain
Pedro Rangel Henriques
Universidade do Minho, Portugal
Pedro Vasconcelos
Universidade do Porto, Portugal Ricardo Dias
Universidade Nova de Lisboa, Portugal Ricardo Queirós
Instituto Politécnico do Porto, Portugal
Ricardo Ribeiro
ISCTE-IUL & INESC-ID, Portugal
Ricardo Rocha
Universidade do Porto, Portugal Salvador Abreu
Universidade de Évora, Portugal Simão Melo de Sousa
Universidade da Beira Interior, Portugal Tomaz Kosar
Univerza v Mariboru, Slovenia
Xavier Gómez Guinovart Universidade de Vigo, Spain
Organization Committee
José Paulo Leal
Universidade do Porto, Portugal
Ricardo Rocha
Universidade do Porto, Portugal
Alberto Simões
Universidade do Minho, Portugal Ricardo Queirós
Instituto Politécnico do Porto, Portugal Miguel Areias
Universidade do Porto, Portugal João Santos
Universidade do Porto, Portugal Nuno Ramos Carvalho
NESSy: a New Evaluator for Software
Development Tools
∗
Enrique Miranda
1, Mario Berón
1, German Montejano
1, Maria João
Varanda Pereira
2, and Pedro Rangel Henriques
31 Department of Informatics, Universidad Nacional de San Luis Ejército de los Andes 950, Argentina
{eamiranda,mberon,gmonte}@unsl.edu.ar
2 Department of Informatics, Instituto Politécnico de Bragança Quinta de St. Apolónia, Bragança, Portugal
3 Department of Informatics, Universidade do Minho Campus de Gualtar, Braga, Portugal
Abstract
Select the best tool for developing a system is a complex process. There must be considered several aspects corresponding to the domain where the system is going to run. Generally, the domain characteristics only are comprehended by experts. They know very well which are the main characteristics, how they can be combined and which should not be considered. This knowledge is fundamental to select the most appropriate tool for implementing a system that solves problems or automates processes in a specific domain. For this reason, it is difficult to get a tool that allows to establish a ranking of development tools for a particular case. In this paper, NESSy, a system to evaluate software development tools, is presented. This tool implements a multi-criteria evaluation method named LSP (Logic Scoring of Preference). Furthermore, it presents a user-friendly environment for carrying out the evaluation process. LSP uses a set of structures aimed at describing software development tools with the goal of select the best one for a specific problem. The features previously mentioned make NESSy a relevant application to help the software engineer to select the best tool for solving specific problems related to particular domains.
1998 ACM Subject Classification D.2.7. Distribution, Maintenance, and Enhancement
Keywords and phrases Evaluation Method, Elementary Criteria, Aggregation Structure, LSP.
Digital Object Identifier 10.4230/OASIcs.SLATE.2013.21
1
Introduction
During the software development process, the engineer faces several problems. In this context, a common challenge is to select the most appropriate tool to develop software [23, 25, 24, 26]. This problem is not trivial, because the selection is highly dependent on the context and on the application domain [27, 28]. For example, an Integrated Development Environment (IDE) helps the engineer to develop systems when the computer used is powerful.
∗ This work was partially supported by Universidade do Minho and Universidad Nacional de San Luis.
© Enrique Miranda, Mario Berón, German Montejano, Maria João V. Pereira and Pedro R. Henriques; licensed under Creative Commons License BY
2nd
Symposium on Languages, Applications and Technologies (SLATE’13). Editors: J. P. Leal, R. Rocha, A. Simões; pp. 21–37
OpenAccess Series in Informatics
22 NESSy: a New Evaluator for Software Development Tools
However, it is not true when this last requirement is not met. It is possible to find thousand of examples like the previous one. Unfortunately, the process used by the engineers to select the tools is ad-hoc. This process is based on the engineer’s experience and the problem complexity. Both aspects are relevant, nevertheless many other features have to be taken into consideration. In this context, we realized that there is a lack of tools that implement a flexible and configurable evaluation method.
NESSy aims at solving the problem mentioned in the precedent paragraph by implementing LSP (Logic Scoring of Preferences), a multi-criteria evaluation method. In order to simplify the method application, NESSy implements and defines a visual domain specific language. This language is based on graphs and it has several operations to do insert, delete and modify the specification components (nodes and arcs and their corresponding attributes).
To evaluate a development tool using LSP, the following items must be defined: a list of attributes, an aggregation structure and a set of elementary criteria functions [10, 11]. The first component describes all the characteristics that the product must have to simplify the implementation of the problem solution. The second is defined using logical operators and functions that combine the criteria specified. The third maps an attribute value into an elementary preference, i.e. a value into the range [0,100]. This value represents the attribute satisfaction level. Once defined the characteristics, the aggregation structure, and the functions of elementary criterion, an evaluation process is applied to obtain a number that represents a global preference. This preference indicates the satisfaction level of the engineer regarding the Software Development Tool under evaluation. When many tools are evaluated using LSP, it is possible to establish a ranking by sorting the global preference. NESSy implements LSP providing a practical, functional and complete graphical interface This peculiarity makes the selection process easier.
The article is organized as follow. Section 2 explains the Logic Scoring of Preference method. Section 3 describes all the NESSy characteristics, i.e: architecture, environment, the evaluation process, functionalities of its graphical interfaces, etc. Section 4 presents a case study to validate the approach. This case study is concerned with the selection of the best graphical library to build software views using software visualization techniques [29]. Finally, section 5 summarizes the proposal and concludes this article with trends for future work.
2
Logic Scoring Preference
Logic Scoring of Preference (LSP) is a multicriteria evaluation method based in the definition of: a criteria tree, elementary criteria functions and an aggregation structure. LSP is useful to analyze, compare and select, the best alternative from a set of objects being graded and ranked (in our case we are interested in software development tools). In the following subsections, all the LSP components will be explained.
2.1
Criteria Tree
E. Miranda, M. Berón, G. Montejano, M.J.V. Pereira and P.R. Henriques 23
2.2
Elementary Criteria
LSP requires the normalization of the measurable attributes. This normalization is necessary because: i) in several decision contexts the measurement units are different; ii) the values of different attributes may be incomparable.
The LSP attribute normalization is accomplished through the definition of Elementary Criterion Functions. An elementary criterion function maps a value taken by the performance variable in other contained in the interval [0,1] or [0,100]. This value represents the satisfaction level of the performance variable under observation. So, 0 represents a situation where the performance variable does not satisfy the requirements at all, and 1 (or 100) means that the requirement is totally satisfied. The elementary criteria can be classified as: Absoluteor
Relative.
An Absolute elementary criterion is used to determine the absolute preference of some attribute. A Relative elementary criterion is employed to establish the relative indicators of the tools under comparison.
Relative elementary criteria are not frequently used for this kind of evaluation. So NESSy only supports the Absolute type of elementary criteria and the Relative one will no more be discussed in this context.
Absolute elementary criteria can belong to different types, as defined below. Continuous Variable
Multivariable: The performance variable is computed by a function. This function receives parameters as its input and returns the value corresponding to the attribute under evaluation. For example, the attributeSupported Paradigms can be evaluated by formula 1.
SupportedP aradigms= 100× P aradigmsLG
P aradigmsM ax (1)
In this case, both theParadigmsLG andParadigmsMax are the parameters and the value stored in the variableSupportedP aradigmsis the attribute value.
Direct: The performance variable has a value that is directly inserted by the evaluator. Discrete Variable
Multilevel: The performance variable can take one value from a set of discrete values. These values are established by the evaluator in the stage ofelementary preference definition; they correspond to different preference levels. The engineer in theevaluation
stage must choose a value from that set.
2.3
Aggregation Structure
The elemental preferences, that result from the application of the elementary criteria to the measurable attributes, must be aggregated in order to obtain the global preference. This global preference represents the satisfaction of all the requirements, by the tool under evaluation.
In order to reach the global preference, some aggregation preference functions are used. These functions receive a set of elementary preferences and their corresponding weights as input. The weights represents the relative importance for each preference. The functions return aggregated preferences as their output. All the outputs are aggregated in the next level of the structure. This process is repeated until the global preference is reached. The aggregation function proposed by LSP is presented in formula 2.
24 NESSy: a New Evaluator for Software Development Tools
E= (w1er1+w2er2+....+wkerk) 1
r (2)
where:
−∞ ≤r≤+∞
0≤wi≤1 andi= 1..k w1+...+wk= 1
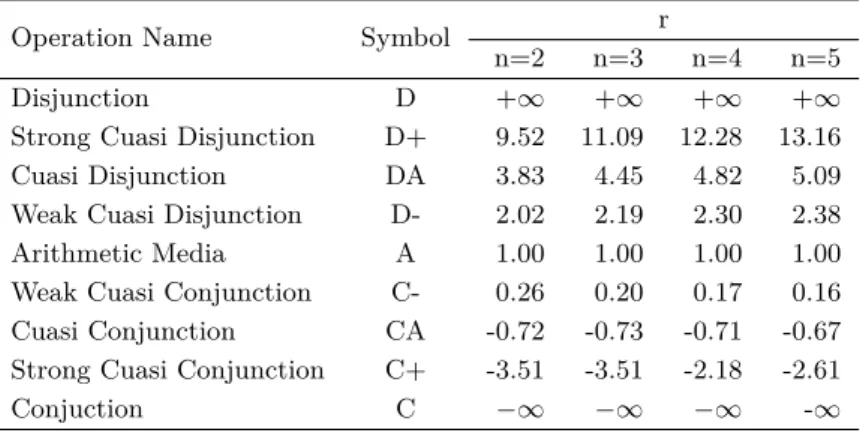
E is a general instantiation scheme which produces a continuous spectrum of aggregation functions, depending on the value ofr. Table 1 shows the most relevant values forr, taking into account the number,n, of function input values. For example, if the operator under consideration is D- and it receives three input values, then the value ofr in the precedent formula is 2.19. To be clearer, r represents the conjunction-disjunction degree of each operator. We say that r generates several functions known as Conjunctive Disjunctive Generalized functions (CDG). These functions are the operators used to aggregate the elementary preferences. The formula employed to compute the values in table 1 is explained in [11].
2.4
The Evaluation Process
The evaluation process is carried out defining the values of all performance variables for each tool under evaluation. In this way, for each system, a global preference will be computed and this value is used to elaborate the ranking. Figure 1 shows a representation of the LSP Evaluation Method.
The global preference is obtained from the computation (represented in figure 1 by L(E1..En))
of all the elementary preferences.
And these elementary preferences are the result of applying the elementary criteria to the performance variables. Finally, the elementary criteria can be computed because the engineer provides the required values.
2.5
Related Work
Multiple Criteria Decision Methods (MCDMs) are used to evaluate and make decisions regarding some problems that admit a finite number of solutions [23]. Nowadays there
Table 1Values of r corresponding to each CDG.
Operation Name Symbol r
E. Miranda, M. Berón, G. Montejano, M.J.V. Pereira and P.R. Henriques 25
Figure 1LSP Method Representation.
are a considerable number of MCDMs that are used in decision making in various topics. However, it was difficult to find, in the literature, systems that implement this kind of methods. The MCDMs most recently used and implemented are ELECTRE (ELimination Et Choix Traduisant la REalité) and PROMETHEE (Preference Ranking Organization METHod for Enrichment Evaluations). Both methods use a similar approach than LSP. ELECTRE was proposed by Bernard Roy in 1971 [24]. The tools that implement different versions of ELECTRE [19, 1, 20], generally have some drawbacks, for example: they employ traditional interaction strategies, they do not define a Domain Specific Language (DSL) to be used during the evaluation process (even when it would be very functional), they use complex fuzzy logic that user must deal with, etc. PROMETHEE was developed by Brans and further extended by Vincke and Brans [9]. PROMETHEE is quite simple in conception and application compared with the other MCDMs. Therefore, it is widely used in research and practical contexts. Two of the most used implementations of PROMETHEE are Decision LAB and PROCALC [8]. Nevertheless, both have similar drawbacks comparing to ELECTRE implementations. Other MCDM implementations such as AHP [27], MAUT [17], etc., were studied. However we could not find those implementations available for a deeper comparative analysis. In the case of LSP (Logic Scoring of Preference), there are some tools based on this method, as the one presented in this article. However, these tools have the following drawbacks: i) they frequently are developed for specific cases (e.g. LSPmed [13], webQEM [21]); ii) they do not provide a DSL (even when this kind of language might be clearly useful); iii) some present a poor user interface (e.g ISEE [12]); iv) they do not offer complete documentation; v) most of them are not available to be used or analyzed.
NESSy tries to tackle the problems before mentioned by providing a user-friendly interface, a visual DSL, a simple evaluation process, among other features.
3
NESSy
In this section, NESSy characteristics are described. In first place, and with the goal of providing an overview of NESSy components, the architecture will be explained. Then the interface where the engineer carries out the evaluation process will be presented. Finally, the evaluation process will be in detail explained.
3.1
Architecture
Figure 2 shows NESSy architecture. NESSy is composed of four components: Criteria Tree Constructor (CTC),Aggregation Structure Constructor (ASC),Elementary Criteria Specifier
(ECS) andEvaluator.
26 NESSy: a New Evaluator for Software Development Tools
Figure 2NESSy Architecture.
CTC receives as its input Criteria Information (CI) and produces as its output the
Criteria Tree(CT). CTC allows to define criteria for characterizing the tools to be evaluated. Clearly, this component has functionalities like: Add Criterion, Delete Criterion, Modify Criterion, etc. In this context CI represents the expert’s knowledge. It is important because the evaluation process depends on the CT. If CT is not well built the results obtained will not be correct. The CT structure reflects the successive decomposition of the characteristics into sub-characteristics and so on until obtaining the measurable attributes.
ASC adds the logic needed to carry out the evaluation process.
It is important to mention that the aggregation structure is built bottom-up from the leaves (attributes) until the last operator is obtained. This particular operator produces the tool global preference. This component has functionalities such as: Add Logical Operator,
Delete Logical Operator,Add Weight, etc.
ECS receives as its input the CT. Like ASC, this component takes into consideration the leaves of the CT, i.e. the measurable attributes. For each attribute, this component selects its type and, according to the type, to define its evaluation function.
Finally, theEvaluator receives as its input both the AS and the refined ECs. Then the Evaluator traverses the AS and, using the information provided by the engineer, produces a ranking of the tools under evaluation.
3.2
Interface
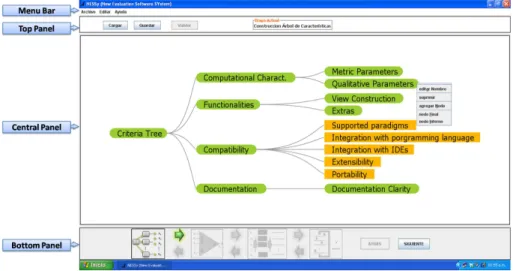
NESSy interface is composed of four components: Menu,Top Panel(TP),Central Panel (CP) andBottom Panel (BP) (see figure 3). Menu exhibits a classical set of project management operations. The operations available are: Load,Save,New Project,Exit andHelp.
TP contains the buttonsLoad,Save,Validate and the fieldCurrent Stage. The buttons have the same functionality that the options provided in the Menu component. Current stage field indicates the process stage undergoing, i.e. the one carried out in the CP.
CP displays all the components needed to carry out the evaluation process. This process has four stages which are explained in the next subsection. The elements shown in CP depend on the process stage. In the first two stages, the elements exhibited are concerned with the construction of structures needed by the evaluation process. In the other stages, the elements exhibited are related with the presentation of intermediate and final results.
E. Miranda, M. Berón, G. Montejano, M.J.V. Pereira and P.R. Henriques 27
Figure 3NESSy Environment Screenshot.
3.3
The Process
The evaluation process provided by NESSy has four stages (the same specified in LSP section), they are: CT Constructor, AS Constructor,EC Specifier andEvaluator. The following subsections explain in detail each stage.
3.3.1
CT Constructor
In this stage, the main characteristics used to compare the tools to be evaluated will be defined. This set of characteristics is represented using a tree. The leaves of this tree are measurable attributes. It is important to notice that the evaluation process only use the tree leaves. Nevertheless, the progressive elaboration of the tree from its root until its leaves has the advantages mentioned below:
1. Makes easier the Criteria Definition: The creation of internal nodes allows to apply a top-down decomposition process. In this process, the engineer defines high level characteristics and decomposes them in sub-characteristics until obtain the attributes.
2. Improves the Visualization: At the end of the definition process, it is possible to observe a tree structure that shows all the criteria defined. This global view permits to do some reasoning and this particularity helps to improve the structure.
Each time that a new project is created, NESSy shows, in its central panel, the tree root. The nodes are created pressing the mouse right button and selecting the optionAdd Node
from the pop-up menu. In order to improve the visualization, the tree nodes are distinguished using different shapes and colors. TheInternal Nodes(characteristics, sub-characteristics, etc.) have elliptic shape and their background is green. The leaves (attributes) have square shape and their background is yellow. The nodes can be edited just pressing the mouse right button. The following operations are then available:
1. Edit Name: It allows to modify the node name.
2. Delete Node: It is employed to delete a node. This operation is implemented as a cascade deletion, i.e. all the sub-tree corresponding to the node will be deleted.
3. Add Node: This operation is used to add a new node in the tree. The new node is tagged as New Nodeand it is setted as Internal Node.
28 NESSy: a New Evaluator for Software Development Tools
4. Final Node: It is utilized when the engineer wants to change the node type toFinal Node, i.e. an attribute.
5. Internal Node: It is utilized when the engineer wants to change the node type toInternal Node, i.e. a characteristic or sub-characteristic.
A larger number of nodes increases the complexity of visualizing and organizing the tree structure. For this reason, NESSy provides visualization functionalities such as:
1. Zoom in and Zoom out: It is possible to zoom in or zoom out all the structure. Zoom in is carried out holding pressed the mouse right button and moving it down. To do a zoom out the same tasks must be done except that the mouse must be moved up.
2. Drag and Drop: It is employed to move all the structure and to focus on the structure sector under analysis. This functionality is achieved by pressing the mouse left button and moving it to the position wished.
3. Zoom to fit: It is used when the structure is out of focus. NESSy provides the operation
Zoom to fitto achieve that. This operation puts the structure on the center of the central panel and executes the operations necessary for its total visualizaton. To accomplish a zoom to fit the central mouse button must be pressed.
Along this stage, NESSy guarantees that:
1. It is not possible to delete the root node.
2. The root can not be a final node.
3. The final nodes have different names.
4. The Criteria Tree has at least two final nodes (attributes).
5. An internal node cannot be converted into a final node if it is the root of a sub-tree. Figure 3 shows a fragment of the Criteria Tree used to compare graphical libraries. Notice that among the four characteristics presented at the first level of the CT, onlyCompatibility
is decomposed into its elementary components, the attributes (tree leaves).
3.3.2
AS Constructor
In this stage, the attributes defined in the previous one (the CT leaves) are shown. They are placed in the central panel following the order established in the CT.
The objective of this stage is to build a DAG (Directed Acyclic Graph), such that the initial nodes (the DAG source nodes) are the attributes; these nodes are then aggregated until obtaining just one node (the DAG sink node). The resulting value of this node represents
Global Preference. Each node, except those that represent attributes, must be associated to a LSP operator. Furthermore, the arcs must be labeled with a number. This number represents a weight. The elements of the DAG are differentiated through their shape and color. In this case, we use a square shape with yellow color for the attributes. The operators, i.e the internal nodes, have elliptic shape with gray color. The arcs are represented by arrows with gray lines and yellow heads.
The aggregation structure is built using four pop up menus.
The first,Add Node, is employed to add an LSP operator node. When the left button is pressed on the menu another pop up menu appears. It presents the following options: i) Select Operator, this option permits to assign the corresponding logical operator to the node. ii) Delete, it is utilized to delete the current node.
E. Miranda, M. Berón, G. Montejano, M.J.V. Pereira and P.R. Henriques 29
Applying the operations described above, it is possible to build any graph. However, LSP method does not work with any graph, some conditions must be fulfilled. They are listed below:
1. The graph must be a DAG.
2. The attributes have not input degree.
3. All the operator nodes must be defined as LSP operators.
4. All the arcs must have a weight p, 1≤p≤100, assigned.
5. The aggregation structure can not contain parallel arcs.
6. The input degree of the operator nodes ranges between two and five.
7. The sum of the weights of the input arcs of an operator node must be equal to 100.
8. There are only one sink node.
9. TheLeft Ideal1of the sink node is composed by all the structure nodes.
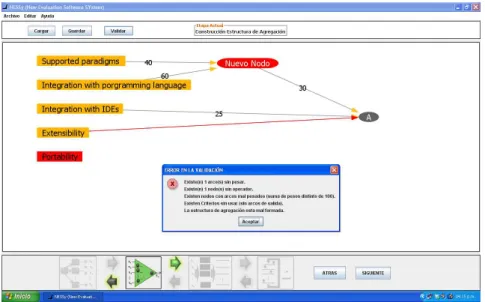
Before proceeding to the next stage the aggregation structure must be validated. In other words, NESSy must verify that the Aggregation Structure built complies with all the conditions listed above. NESSy carries out this task when the buttonValidate is pressed. If the aggregation structure is not correct, NESSy shows the errors found. Figure 4 illustrates the precedent situation, using an example based in the evaluation of graphical libraries. The errors detected in this example are:
1. There is one arc without weight – the arc with red color has no weight.
2. There is one node without operator – the node with labelNew Node has no LSP operator assigned.
3. There are nodes with wrongly pounded arcs – the weight is not correct (the sum is not equal to 100), as happens with node labeled a(one input arc has no weight assigned).
4. There is one criterion without use – Portabilityis an isolated node.
5. The aggregation structure is incorrectly formed – There is one node isolated: Portability.
1 Let G=(P,E) a graph where P is a node set and E is a relation defined on P,E⊆P×P, and let x be a nodex∈P then LeftIdeal(x)={y∈P/ρ(y, x)} whereρ(y, x) denotes a path from y to x.
Figure 4Error detection in the definition of an Aggregation Structure.
30 NESSy: a New Evaluator for Software Development Tools
Figure 5Interface corresponding to the Third Stage.
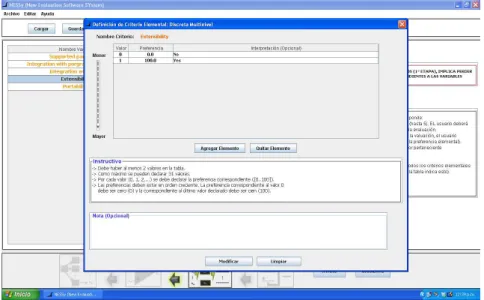
3.3.3
EC Specifier
At this stage, the type of each elementary criterion (EC) and the formula to evaluate it are specified. NESSy interface to support this stage is shown in figure 5.
Observing this figure, it is possible to identify the elementary criteria displayed on the left side, and two text areas on the right side. The first contains an advice to inform the user that going back to stage one, all work done will be lost. The second displays some tips regarding the criteria specification.
To specify the ECs, the left side of the screen, shown in figure 5, has three columns: i) Variable Name contains the criteria names, ii) Type allows to select the type of each criterion, iii)Modifyis a button that allows to add information concerned with the criterion. A forth column is included,Defined (yes/no), to indicate whether the criterion has been defined, or not.
In order to specify the function for each elementary criterion, the engineer must follow the steps described below.
1. Select the criterion type.
2. Press the buttonModify to open the corresponding pop-up panel.
3. Complete the information required filling the form in that panel.
E. Miranda, M. Berón, G. Montejano, M.J.V. Pereira and P.R. Henriques 31
Figure 6Pop up Panel to specify Criteria of type Continuous Variable (Multivariable).
3.3.4
Evaluator
In this phase, the engineer must:
1. Define the tools to evaluate.
2. Provide, for each tool the information required by the elementary criteria in order to proceed the evaluation.
The evaluation phase also has its pop up panel. In this panel, it is possible to find a table and two buttons (Add Element andDelete Element). The table allows to visualize the software system to be submitted to the evaluation process. It has four columns, they are: i) Name: It is the name of the tool; ii) Input Values: Each cell in this column has a button. When this button is pressed a pop up panel appears. The format of this panel depend on the type of elementary criterion. If it is a Continuous Variable the engineer must fill the
Figure 7Pop up Panel to specify Criteria of type Discrete Variable (Multilevel).
32 NESSy: a New Evaluator for Software Development Tools
Figure 8Panel to Evaluate a Continuous Variable Criterion.
data required by the panel shown in figure 8. If it isConstant Value the engineer just needs to provide the preference level. Finally, if it isDiscrete Multi-Level, all the values defined in the previous steps are shown again. The engineer must select the preference level wished.
The next step is to proceed with the global evaluation. This process uses the Aggregation Structure combining both the criteria and the LSP operators. The Aggregation Structure is traversed and the value for each criterion is computed, following the LSP semantics. At the end of the process, the global preference is computed.
The process described above is applied to all the tools under analysis and the ranking is established taking into consideration the global preference of each tool.
4
Case Study: Visualization Libraries
Software Visualization (SV) is a discipline of Software Engineering aimed at creating and displaying useful static or dynamic views of software [2, 3, 18]. A view is a graphical representation that helps to understand some software aspects.
In order to build a view, many artifacts must be defined. An artefact is a concept used to refer an object belonging to a particular visualization.
Building views and their associated artefacts can be a complex task. For example, to build a graph-based view by implementing the graph from the scratch is a hard task and it consumes much time and efforts. The engineer must consider: the internal representation, the complexity of the operations and different strategies to visualize graphs.
When a complete and tested graph library is used much time is saved and many program-ming errors are avoided.
The following sections describes how NESSy was used to select the most appropriate tool to rig up software visualizations [4, 5].
4.1
Criteria Tree
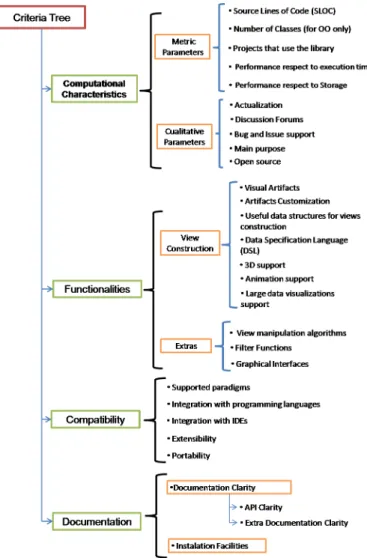
The Criteria Tree shown in figure 9 has been built after a deep research in the context of Software Visualization. As it possible to observe, the tree has four main characteristics:
Computational,Functional, CompatibilityandDocumentation.
E. Miranda, M. Berón, G. Montejano, M.J.V. Pereira and P.R. Henriques 33
The Functional characteristic contains properties that a visualization library must have. For example, a visualization library must have a large number of visual artifacts, because in the other way it will not be useful.
The Compatibility characteristic describes the possibility of using the library with various paradigms and in different platforms.
Finally, the Documentation characteristic includes a relevant software aspect: the existence of well-formed and organized texts describing the software package. Many times, the engineers reject using a powerful library because it is complex to understand how it works. It is due to the absence of a good and clear documentation.
To finish this section, it is relevant to remark that, the actual tree has more criteria (see [14] for more details) than those here considered. However, many of them need to be
disaggregated in order to be used by NESSy (for more details read [14]).
4.2
Aggregation Structure
The aggregation structure was built taken into account: i) The user’s experience using graphical libraries; ii) Experts recomendations; iii) The state of the art of graphic libraries in
Figure 9Criteria Tree.
34 NESSy: a New Evaluator for Software Development Tools
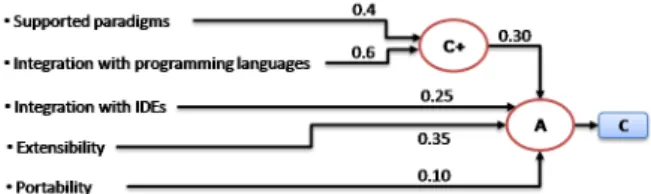
Figure 10Aggregation Structure corresponding to High Level CharacteristicCompatibility.
Table 2P aradigmsGL andP aradigmsM axdescription.
Name Min. Max. Note
P aradigmsGL 0 100 Paradigms supported by the graphic library
P aradigmsM ax 0 100 Maximun number of paradigms supported by a graphic libray
the context of Software Visualization, as exposed by Miranda in [14].
Figure 10 shows the aggregation structure corresponding to the high level characteristic
Compatibility. The Compatibility’s partial preference is computed by using two operators. The first, C+, a quasi-conjunctive function, aggregatesSupported Paradigmsand Integra-tion with Programming Languages. This operator is employed when the input requirements are mandatory. Thus if one of the input values is zero, the operation result will be zero. The second operation A (the arithmetic average) is a neutral function (neither conjunctive nor disjunctive). It aggregates the first result with the three criteriaIntegration with IDEs,
Extensibility andPortability. The reader willing to know the full aggregation structure can read [14].
4.3
Elementary Criteria Functions
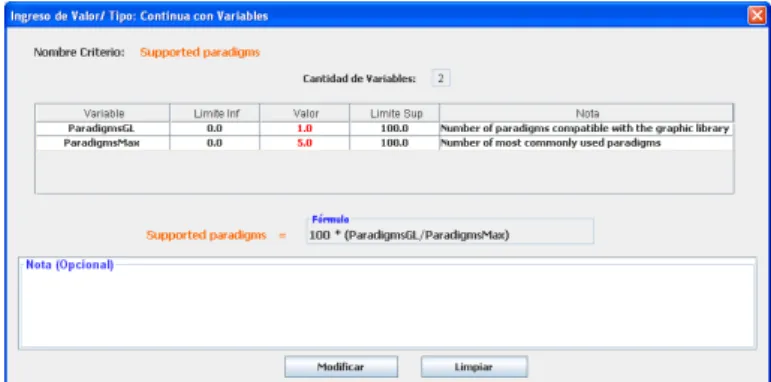
The approach to specify the Elementary Criteria Functions was described in section 3.3.3. To illustrate how this task is carried out, a simple example is presented: the specification of the elementary criterionSupported Paradigms. This criterion is of type Multivariable (a Continuous Variable) and depends on two parametersP aradigmsGLandP aradigmsM ax
that are described in table 2. The value ofSupported Paradigms is determined by formula 1. Using NESSy to accomplish this task, it is necessary to start specifying the criterion type in the form shown in figure 5. After this action, a new pop-up panel will spring out. Then the description of the two parameters and the evaluation formula, presented above, shall be filled in the form associated to that pop-up panel, as can be seen in figure 6.
4.4
Evaluation
In order to show NESSy usefulness, three graphical libraries were evaluated: Graphviz, JUNG and Prefuse. Graphviz is open source graph visualization software [15]. This library has been used in several scientific projects. Jung provides a common and extensible language for the modeling, analysis and visualization of data that can be represented as a graph or network [16]. Prefuse is a software tool for creating rich interactive data visualization [22].
E. Miranda, M. Berón, G. Montejano, M.J.V. Pereira and P.R. Henriques 35
Table 3Final Scores obtained by NESSy.
High-Level Characteristics Graphviz JUNG Prefuse Computational Characteristics 69.0892 51.8395 47.4708
Functionalities 64.5728 63.2473 76.5484
Compatibility 88.1042 75.2208 75.2208
Documentation 74.7158 88.6803 85.2318
Final Scores 71.7626 66.1774 67.9197
TheGlobal Preferencesobtained for each library are shown in table 3. In the same table it is possible to see the decomposition of the Global Preference of each tools into its components (the high level characteristic preferences). Graphiz was ranked in the first position (achieve the maximal punctuation for the Global Preference) due to values got for the characteristics
Computational andCompatibility.
5
Conclusion and Future Work
In the context of a bilateral cooperation project devoted to the research of Program Com-prehension and Language-based Tools, we decided to adopt Logic Scoring of Preference (LSP)—a multi-criteria Evaluation Method adaptable to several domains, that was being applied by the Argentinean team for a long time in different areas—as a method to compare or select software systems (as discussed for instance in [7] or [6]).
This decision has created the need for a tool that could help in the application of LSP, leading to the development of NESSy,a new evaluator for software development tools, that was presented in this paper. In order to correctly follow the LSP approach, NESSy has four stages.
The first stage allows the engineer to define the criteria tree. The second is concerned with the definition of an aggregation structure. The third phase allows to define the elementary criteria types and the respective evaluation functions. Finally, the fourth stage uses the aggregation structure and the elementary criteria to produce a global preference. This preference represents the engineer satisfaction level regarding the tool evaluated.
NESSy provides an easy-to-use interface to support the user work along all these four steps. As a proof of concept, NESSy was used to rank three powerful graphic libraries:
Graphviz,JUNG andPrefuse. The main goal was to establish which of them provide more functionalities to build graph-based software views. The results obtained indicate that Graphviz is better (more helpful) than Jung and Prefuse. It is because Graphviz got the best scores concerning the Computational Characteristics and Compatibility. These characteristics were considered more important by the Aggregation Structure designers.
From the experience gained using NESSy in laboratory contexts, we can say: NESSy is user-friendly, has an attractive and easy to learn visual DSL which is employed to specify the aggregation structure, NESSy uses few computational resources and the time consumed to produce the result is acceptable. Theevaluation task is a difficult process, either using NESSy tool or adopting the traditional manual approach. However, the advantage of using NESSy is that a considerable amount of work (e.g Criteria Tree, Agregation Structure and Elementary Criteria) is already done for future evaluations.
The future work is oriented in four directions. The first is concerned with improving NESSy adding the following characteristics: i) New types of elementary criteria, and ii) More support for project management.
36 NESSy: a New Evaluator for Software Development Tools
The second is related with the elaboration of strategies to automatize the evaluation process. Currently, all the necessary data is provided manually. However, some elementary criteria can be automatically computed. An example of this assertion is the metric SLOC (Source Lines of Code). For this reason, we intend to study the possibility of using plug-ins
in order to automatize the evaluation of some attributes.
The third is related with the improvement of the Criteria Tree for the Software Visualiza-tion Domain. As was menVisualiza-tioned along this paper, the CT is wider than the presented in section 4.1. Many criteria were not included because they need to be disaggregated. This problem motivates further research for producing a more complete CT.
Finally, we also plan to explore the application of NESSy to other areas such as: Reverse Engineering, Program Comprehension and Re-Engineering. The goal is to define the Criteria Tree, Aggregation Structure and Elementary Criteria for specific problems in these areas. For example, if a Program Comprehension tool is needed in a specific context, the components previously mentioned, can help to select the best option for this particular situation. Obviously, NESSy is fundamental to carry out this task properly.
References
1 Aicha Aguezzoul, B. Rabenasolo, and A.-M. Jolly-Desodt. Multicriteria decision aid tool for third-party logistics providers’ selection. InService Systems and Service Management, 2006 International Conference on, volume 2, pages 912–916, 2006.
2 T. Ball and SG Eick. Software visualization in the large. Computer, 29(4):33–43, 1996.
3 Michael Balzer, Andreas Noack, Oliver Deussen, and Claus Lewerentz. Software Land-scapes: Visualizing the Structure of Large Software Systems, 2004.
4 S. Bassil and R. Keller. A Qualitative and Quantitative Evaluation of Software Visualization Tools. Proc. of the IEEE Symposium on Information Visualization, pages 69–75, 2001.
5 M. Beron, P. Henriques, and R. Uzal. Program Inspection to interconnect Behavioral and Operational Views for Program Comprehension. Ph.D Thesis Dissertation at University of Minho. Braga. Portugal, 2010.
6 M. M. Beron, D. Cruz, M. J. Varanda Pereira, P. R. Henriques, and R. Uzal. Evaluation criteria of software visualization system used for program comprehension. 3a Conferencia Nacional em Interacção Pessoa-Máquina, 03:285, 2008.
7 Mario Marcelo Berón. Program Inspection to interconnect the Behavioral and Operational Views for Program Comprehension. PhD thesis, National University of San Luis & Univer-sity of Minho, Nov 2009.
8 Jean-Pierre Brans and Bertrand Mareschal. Promethee methods. In Multiple criteria decision analysis: state of the art surveys, pages 163–186. Springer, 2005.
9 J.P. Brans, Ph. Vincke, and B. Mareschal. How to select and how to rank projects: The promethee method. European Journal of Operational Research, 24(2):228 – 238, 1986. <ce:title>Mathematical Programming Multiple Criteria Decision Making</ce:title>.
10 J.J. Dujmovic. A Method for Evaluation and Selection of Complex Hardware and Soft-ware Systems. The 22nd Int’l Conference for the Resource Management and Performance Evaluation of Enterprise CS. CMG 96 Proceedings, 1:368–378, 1996.
11 J.J. Dujmovic, R. Elnicki, University of Florida, and United States. National Bureau of Standards.A DMS Cost/benefit Decision Model: Mathematical Models for Data Manage-ment System Evaluation, Comparison and Selection (part 1 of Second Deliverable). National Bureau of Standards, 1981.
E. Miranda, M. Berón, G. Montejano, M.J.V. Pereira and P.R. Henriques 37
13 Jozo J Dujmović, Jeffrey W Ralph, and Leslie J Dorfman. Evaluation of disease severity and patient disability using the lsp method. InProceedings of the 12th Information Processing and Management of Uncertainty international conference (IPMU 2008), pages 1398–1405.
14 Miranda Enrique. Evaluación de funcionalidades de visualización de software provistas por librerías gráficas. licentiate thesis. 2013.
15 GraphViz-Team. http://www.graphviz.org/, 2011.
16 JUNG-Team. http://jung.sourceforge.net/, 2011.
17 Ralph L. Keeney and Howard Raiffa. Decisions with Multiple Objectives: Preferences and Value Tradeoffs. Cambridge University Press, 1993.
18 K. Mens, T. Mens, and M. Wermelinger. Supporting software evolution with intentional software views. Proceedings of the International Workshop on Principles of Software Evol-ution, pages 138–142, 2002.
19 Gholam Ali Montazer, Hamed Qahri Saremi, and Maryam Ramezani. Design a new mixed expert decision aiding system using fuzzy electre iii method for vendor selection. Expert Syst. Appl., 36(8):10837–10847, October 2009.
20 V. Mousseau, R. Slowinski, and P. Zielniewicz. A user-oriented implementation of the electre-tri method integrating preference elicitation support. Comput. Oper. Res., 27(7-8):757–777, June 2000.
21 L. Olsina and G. Rossi. Measuring Web Application Quality with WebQEM. IEEE Multi-Media, 2002, 09(4):20–29, 2002.
22 Prefuse-Team. http://prefuse.org/, 2011.
23 Carlos Romero. Teoría de la Decisión Multicriterio: Conceptos, técnicas y aplicaciones. Alianza Editorial: Madrid., 1993.
24 B. Roy. Problems and methods with multiple objective functions. Mathematical Program-ming, 1:239–266, 1971.
25 Bernard Roy. The outranking approach and the foundations of electre methods. Theory and Decision, 31:49–73, 1991.
26 M.J.; Ríos-Insua S Ríos, S.; Ríos-Insua. Procesos de Decisión Multicriterio. 1989.
27 T. Saaty. How to make a decision: The analytic hierarchy process. European Journal of Operational Research, 48(1):9–26, September 1990.
28 Herbert Alexander Simon. The New Science of Management Decision. Prentice Hall PTR, Upper Saddle River, NJ, USA, 1977.
29 S. Tilley and S. Huang. On selecting software visualization tools for program understanding in an industrial context. iwpc, 00:285, 2002.