This is the authors’ version accepted for publication (post-print version). Please use the citation:
Cândido, Carlos J.F. and Santos, Sérgio P. (2019) Implementation obstacles and strategy implementation failure, Baltic Journal of Management, Vol. 14, No. 1, 39-57.
PUBLISHED VERSION HERE: https://www.emeraldinsight.com/doi/abs/10.1108/BJM-11-2017-0350
This article is © Emerald Group Publishing and permission has been granted for this version to appear here (https://sapientia.ualg.pt/). Emerald does not grant permission for this article to be further copied/distributed or hosted elsewhere without the express permission from Emerald Publishing Limited.
Implementation obstacles and strategy implementation failure
Abstract
Purpose – The paper addresses the following question: How do strategy implementation obstacles relate to each other and affect strategy implementation?
Method – The research methodology is qualitative and based on an extensive review of the literature and on an in-depth case study analysis.
Findings – This paper draws two main conclusions. The first is that the many obstacles that impact the strategy implementation process can interact and be strongly interrelated in dynamic and complex manners. The second is that obstacles can lead to and reinforce other obstacles, eventually forming long chains of blockages.
Originality – Strategy implementation remains a difficult task with improbable success. This paper provides a contribution to an explanation on why so many strategy implementation efforts fail. It is one of the very few papers addressing the issue of the relationships between strategy implementation obstacles.
Keywords: strategy implementation, organizational change, obstacles, relationships, causality, failure, case study
1. Introduction
One of the major unresolved management problems is the great percentage of strategy implementation efforts that fail, with most authors estimating a rate of failure between 30 and 70 percent (Cândido and Santos, 2011, 2015). Although remarkable progress has been made in the strategic management field, this problem persists, indicating that it is imperative to look more closely at the reasons behind failure.
Research in this area has turned, in recent years, to investigating the effect of internal organizational variables on strategy implementation. In particular, researchers have
investigated how an organization’s characteristics affect the process and outcomes of strategy implementation. This important line of research has been followed by several authors, for instance, Hickson et al. (2003), Miller et al. (2004), Stadler and Hinterhuber (2005), Sirkin et al. (2005), Kaplan and Norton (2006), Zernand-Vilson and Elenurm (2010), Alas et al. (2012). However, there is a complementary perspective that might also be adopted and which has largely been neglected. This perspective is concerned with how organizations
characteristics, and in particular, implementation obstacles, relate to each other and affect the strategy implementation process. When this perspective is taken, it is imperative for the researcher to try to find answers to the following questions: Do implementation obstacles simply accumulate during strategy implementation or do they relate to each other in more damaging ways? If they do relate, can the relationship be characterized as a cause and effect relationship?
The study of these questions is highly relevant as the possible occurrence of interaction or causality between obstacles, are relatively new issues and only a minority of researchers in the field have explicitly considered the possibility of relationships between obstacles (e.g. Beer and Eisenstat, 2000). Therefore, by providing an answer to the research questions above and presenting evidence of the relationships between obstacles, this paper makes an important
contribution to knowledge as it offers a new and complementary explanation regarding the reasons behind strategy implementation failure and offers several opportunities for further research.
In order to increase the understanding of the reasons why strategy implementation fails, this paper carries out an extensive review of the literature on strategy implementation and provides an in-depth case study analysis of a non-profit organization – a Faculty of Economics in Portugal.
In pursuit of these objectives, the remainder of this paper is organized into several sections. It starts by identifying the most important strategy implementation obstacles documented in the literature and then discusses each of the research questions. This
discussion culminates in the presentation of a framework to explain strategy implementation failure. The paper then addresses the research methodology adopted and presents the
empirical part that explains the strategy process followed by the Faculty of Economics at one of Portugal’s newer universities. Reasons for failure are described in some detail, and in the chronological order in which they occurred, to uncover the causality relationships. A
discussion of the case study ensues and evidence is presented that supports the answers to the research questions. The paper concludes by deriving implications for the literature and practice on strategy implementation.
2. Obstacles to strategy implementation
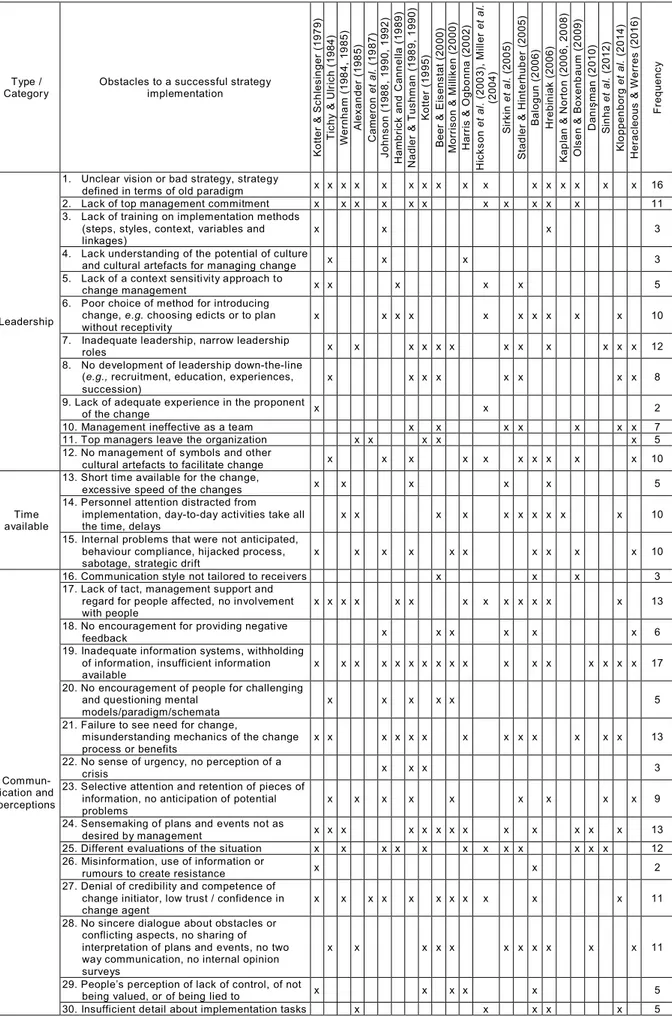
There are many obstacles to a successful strategy implementation. Researchers such as Alexander (1985), Kotter (1995) and Beer and Eisenstat (2000) provide comprehensive sets of implementation difficulties. Many other authors have contributed, however, to this
literature. In order to identify the most commonly cited obstacles to strategy implementation, relevant publications were selected in the EBSCO Host Research Database using several search strings – including ‘implem* and obstacl*’, ‘chang* and probl*’, ‘transform* and
difficult*’, ‘execut* and impedim*’, and others – in the titles and keywords of the
publications. Table 1 shows an extract of the sixty-five obstacles that have been found, the authors who have identified them, and the number of times each blockage has been
Table 1. Obstacles to a successful strategy implementation (Complete Table)
Type / Category
Obstacles to a successful strategy implementation K o tt e r & S c h le s in g e r (1 9 7 9 ) T ic h y & U lr ic h ( 1 9 8 4 ) W e rn h a m ( 1 9 8 4 , 1 9 8 5 ) A le x a n d e r (1 9 8 5 ) C a m e ro n e t a l. ( 1 9 8 7 ) J o h n s o n ( 1 9 8 8 , 1 9 9 0 , 1 9 9 2 ) H a m b ri c k a n d C a n n e ll a ( 1 9 8 9 ) N a d le r & T u s h m a n ( 1 9 8 9 , 1 9 9 0 ) K o tt e r (1 9 9 5 ) B e e r & E is e n s ta t (2 0 0 0 ) M o rr is o n & M il li k e n ( 2 0 0 0 ) H a rr is & O g b o n n a ( 2 0 0 2 ) H ic k s o n e t a l. ( 2 0 0 3 ), M il le r e t a l. (2 0 0 4 ) S ir k in e t a l. ( 2 0 0 5 ) S ta d le r & H in te rh u b e r (2 0 0 5 ) B a lo g u n ( 2 0 0 6 ) H re b in ia k ( 2 0 0 6 ) K a p la n & N o rt o n ( 2 0 0 6 , 2 0 0 8 ) O ls e n & B o x e n b a u m ( 2 0 0 9 ) D a n ış m a n ( 2 0 1 0 ) S in h a e t a l. ( 2 0 1 2 ) K lo p p e n b o rg e t a l. ( 2 0 1 4 ) H e ra c le o u s & W e rr e s ( 2 0 1 6 ) F re q u e n c y Leadership
1. Unclear vision or bad strategy, strategy
defined in terms of old paradigm x x x x x x x x x x x x x x x x 16 2. Lack of top management commitment x x x x x x x x x x x 11 3. Lack of training on implementation methods
(steps, styles, context, variables and linkages)
x x x 3
4. Lack understanding of the potential of culture
and cultural artefacts for managing change x x x 3 5. Lack of a context sensitivity approach to
change management x x x x x 5 6. Poor choice of method for introducing
change, e.g. choosing edicts or to plan without receptivity
x x x x x x x x x x 10 7. Inadequate leadership, narrow leadership
roles x x x x x x x x x x x x 12 8. No development of leadership down-the-line
(e.g., recruitment, education, experiences, succession)
x x x x x x x x 8 9. Lack of adequate experience in the proponent
of the change x x 2
10. Management ineffective as a team x x x x x x x 7 11. Top managers leave the organization x x x x x 5 12. No management of symbols and other
cultural artefacts to facilitate change x x x x x x x x x x 10
Time available
13. Short time available for the change,
excessive speed of the changes x x x x x 5 14. Personnel attention distracted from
implementation, day-to-day activities take all the time, delays
x x x x x x x x x x 10 15. Internal problems that were not anticipated,
behaviour compliance, hijacked process, sabotage, strategic drift
x x x x x x x x x x 10
Commun-ication and perceptions
16. Communication style not tailored to receivers x x x 3 17. Lack of tact, management support and
regard for people affected, no involvement with people
x x x x x x x x x x x x x 13 18. No encouragement for providing negative
feedback x x x x x x 6 19. Inadequate information systems, withholding
of information, insufficient information available
x x x x x x x x x x x x x x x x x 17 20. No encouragement of people for challenging
and questioning mental models/paradigm/schemata
x x x x x 5 21. Failure to see need for change,
misunderstanding mechanics of the change process or benefits
x x x x x x x x x x x x x 13 22. No sense of urgency, no perception of a
crisis x x x 3
23. Selective attention and retention of pieces of information, no anticipation of potential problems
x x x x x x x x x 9 24. Sensemaking of plans and events not as
desired by management x x x x x x x x x x x x x 13 25. Different evaluations of the situation x x x x x x x x x x x x 12 26. Misinformation, use of information or
rumours to create resistance x x 2 27. Denial of credibility and competence of
change initiator, low trust / confidence in change agent
x x x x x x x x x x x 11 28. No sincere dialogue about obstacles or
conflicting aspects, no sharing of interpretation of plans and events, no two way communication, no internal opinion surveys
x x x x x x x x x x x 11
29. People’s perception of lack of control, of not
being valued, or of being lied to x x x x x 5 30. Insufficient detail about implementation tasks x x x x x 5
Reluctance to change - fear of loss
31. Habit, low tolerance for change, reluctance
to let go, to experiment x x x x x x 6 32. Threat to existing social relationships x x 2 33. Fear that change will upset current balance
of power between groups and departments x x x x 4 34. Fear of loss of status, power, freedom,
economic benefits and security x x x x x x x x x 9 35. Fear of unknown, of uncertainty and
ambiguity, of negative feedback, of failure, of being incompetent
x x x x x x x x x 9 36. Originator of current status quo may feel
indicted x x x x x 5
Behavioural diagnosis
37. Lack of assessment of culture, values, symbols, gossip, and mental models of the organization
x x x x x 5 38. Lack of a behavioural diagnosis, no
assessment of readiness for change or incorrect assessment
x x x x x x x 7 39. Viewing people as resistants, not change
creators x x x x x 5 People’s
skills - training
40. Inadequate employee training on new tasks,
inadequate timing of training x x x 3 41. Current skills are insufficient or inadequate x x x x 4
Participation - involvement
42. Manipulation, or managers merely want a
ratification x x x x 4
43. No identification with the change, plan developed without participation, top down approach, no middle management commitment, no empowerment
x x x x x x x x x x x x x x x x x x x 19
44. Outside consultants proposed the change x x 2 45. Unclear responsibilities and accountability x x x x x x x 7
Culture and climate
46. Group norms, role prescriptions, routines, symbols, peer pressure, rites of intimidation and degradation
x x x x x x 6 47. Poor relationships, low trust, and
interdepartmental rivalry or conflict, leading to an unwillingness to cooperate and to subordinate to the organizational greater good
x x x x x x x x 8
48. Tradition bound, paradigm persistence and/or homogeneity, stories of unsuccessful changes
x x x x x x x x x x x 11
Structure
49. Structural inadequacy, rigidity or
bureaucracy x x x x x x x 7 50. Lack of a strong power coalition pro-change,
small size of power coalition x x x x x x x x x 9 51. Structural changes that were not required, or
in excess x x x 3
52. No institutionalization of the change in structure and culture, declaring victory too soon x x x x x 5 Change extension, projects, short term wins
53. Extension of the change, number of
departments and people affected x x x x x x x x x x 10 54. Lack of previous trials/experimentation with
the solution, lack of a pilot project x x 2 55. Lack of planning for short-term wins, change
not broken down into short steps or projects x x x x x 5
Coordination
56. Personal objectives conflict with
organizational objectives x x x x x 5 57. Conflicting organizational priorities x x x x x x x x x 9 58. Ineffective coordination x x x x x x x x 8
Resources
59. Limited available resources, committed resources in past decisions, withdrawal of resources
x x x x x x x x x x x 11 60. Sunk costs preventing reinvestment in a
better future alternative x x x 3
Performance management
61. Control/reward systems reinforce paradigm and status quo, lack of adequate
feedback/learning
x x x x x x x x x x x x x x x 15 62. No link established between strategic and
daily objectives, no strategic control x x x x x 5 63. No equity/justice in sacrifices asked and
rewards given x x x x x x 6
External events
64. Parent company structure, tradition, paradigm, change in its own strategy or withdrawal of support
x x x x x 5 65. Other unanticipated external events (macro
factors, stakeholders, societal culture…) x x x x x x x x x 9
most of the obstacles to successful strategy implementation are organizational factors that fall under management control. Secondly, it shows that there is considerable disagreement among researchers regarding what the most important obstacles are. In spite of this disagreement, Table 1 shows that any of the blockages identified can contribute to slow down the pace of strategy execution, introduce distortions in the process, generate excessive costs, and ultimately impede a successful implementation.
3. Relationships between obstacles
While research on how each obstacle affects the process and outcomes of strategy implementation has been prolific, no study has yet provided an answer to the following research question: How do strategy implementation obstacles relate to each other and affect strategy implementation? This is the main objective of this paper.
There are at least three different ways in which researchers have looked at the
relationships between obstacles. Most researchers simply ignore the possibility of any kind of relationships between implementation blockages. That is the case, for instance, of Tichy and Ulrich (1984), Cameron et al. (1987), Johnson (1988, 1990, 1992), Nadler and Tushman (1989, 1990), Stadler and Hinterhuber (2005), Balogun (2006), Hrebiniak (2006), and Kaplan and Norton (2006, 2008). Although some of these researchers identify the reasons why a specific obstacle might occur in a given organizational setting, they do not address the issue of causality between blockages.
Other researchers consider the possibility of accumulation of obstacles during
implementation, but do not acknowledge relationships between them. For example, Alexander (1985), Hambrick and Cannella (1989), Kotter (1995), and Harris and Ogbonna (2002)
suggest that an organization can experience several implementation problems. They briefly refer to the number of obstacles that can occur, with Alexander computing an average of obstacles per firm. Therefore, this seems to suggest simple accumulation of independent
obstacles, without any relationships between them. Sirkin et al. (2005), Hickson et al. (2003) and Miller et al. (2004) explain in considerably more detail this view that independent implementation difficulties might accumulate. Sirkin et al., for example, go as far as proposing an additive mathematical formula to predict the degree of implementation difficulty.
Lastly, other researchers consider the possibility of interaction, but fail to elaborate further on this concept. Olsen and Boxenbaum (2009), for example, suggest initially that there can be interactions between obstacles, but conclude (simply) that some obstacles prevent others from being removed from the change process. Wernham (1984, 1985) and Beer and Eisenstat (2000), however, argue that obstacles interact, with Beer and Eisenstat going as far as proposing a model of the (bidirectional) interactions among six ‘silent killers’ of strategy implementation. What these authors mean by interaction is not exactly clear. Although, they convey the idea of feedback loops (Wernham, 1984, 1985; Heracleous and Werres, 2016) and vicious circles (Beer and Eisenstat, 2000) between obstacles, which are forms of
unidirectional circular causality, it is not clear if and how they differentiate ‘interaction’ from ‘causality’. Therefore, there is clearly a dearth of studies explicitly addressing the topics of causality between obstacles and of chains of obstacles. Table 2 presents a synthesis of major thoughts on this issue.
Table 2. Relationships between obstacles Type of relationship K o tt e r & S c h le s in g e r (1 9 7 9 ) T ic h y & U lr ic h ( 1 9 8 4 ) W e rn h a m ( 1 9 8 4 , 1 9 8 5 ) A le x a n d e r (1 9 8 5 ) C a m e ro n e t a l. ( 1 9 8 7 ) J o h n s o n ( 1 9 8 8 , 1 9 9 0 , 1 9 9 2 ) H a m b ri c k a n d C a n n e ll a ( 1 9 8 9 ) N a d le r & T u s h m a n ( 1 9 8 9 , 1 9 9 0 ) K o tt e r (1 9 9 5 ) B e e r & E is e n s ta t (2 0 0 0 ) M o rr is o n & M il li k e n ( 2 0 0 0 ) H a rr is & O g b o n n a ( 2 0 0 2 ) H ic k s o n e t a l. ( 2 0 0 3 ); M il le r e t a l. ( 2 0 0 4 ) S ir k in e t a l. ( 2 0 0 5 ) S ta d le r & H in te rh u b e r (2 0 0 5 ) B a lo g u n ( 2 0 0 6 ) H re b in ia k ( 2 0 0 6 ) K a p la n & N o rt o n ( 2 0 0 6 , 2 0 0 8 ) O ls e n & B o x e n b a u m ( 2 0 0 9 ) D a n ış m a n ( 2 0 1 0 ) S in h a e t a l. ( 2 0 1 2 ) K lo p p e n b o rg e t a l. ( 2 0 1 4 ) H e ra c le o u s & W e rr e s ( 2 0 1 6 ) F re q u e n c y ( im p li c it + e x p li c it ) F re q u e n c y ( e x p li c it )
1. No relationship between obstacles is explicitly discussed (reasons for a specific obstacle might be identified, but no relationship between obstacles is explicitly addressed, identified or explained)
x x xa x x x x xb x x x 11 –
2. Accumulation of obstacles without any
interaction or causality x
c,d xc xc xa,c x x 6 2
3. Interaction (a bidirectional reciprocal relationship, perhaps with a multiplicative effect, but no unidirectional causality nor vicious circles), unidirectional causality and/or vicious circles (definition of the concepts is not provided and remain mixed and unclear, evidence of relationships insufficient)
xe x xf x xe x 6 6
Notes: a The authors discard the possibility of empirically studying any kind of cause-effect relationships. b The author does not explicitly address causal relationships between obstacles, but explains how a trigger event and middle managers’ sensemaking can originate an obstacle. c The authors make an implicit assumption of accumulation of several independent obstacles without interaction or causality between them. d The authors do not explicitly address any causal relationships between obstacles, but they explain why some obstacles might make an appearance in an organization. e The author suggests a feedback loop of events that can cause an obstacle. Feedback loops between obstacles might also be implied. f Two barriers prevented other barriers from being removed.
The diversity of views synthesized in Table 2 makes it difficult to offer a consensual answer to the research question regarding what types of relationships there are between obstacles. However, the analysis of the views expressed in the literature, together with the evidence gathered from the case study discussed below, suggest that obstacles to strategy implementation may simply accumulate, interact with each other, as well as be linked in cause and effect chains. The explicit acknowledgement in this paper that obstacles may form chains, and in this way prevent strategy implementation, is a major departure from most of the
existing literature on strategy implementation and change management.
4. A framework to explain strategy implementation failure
In what follows, and inspired by Mintzberg and Water’s (1985) discussion of how strategy is formed, we propose a theoretical framework for explaining strategy
implementation failure/success.
Organizations may have an intended strategy that was formed on the basis of a careful analysis of the situation (Johnson et al., 2008: 419; Andersen and Nielsen, 2009). This intended strategy may become the realized strategy. Frequently, however, this intended strategy, or a part of it, is abandoned by the organization and becomes the unrealized strategy (Mintzberg and Waters, 1985; Mintzberg, 1987). There can be many reasons why all or part of the initial strategic intent is not realized. Obstacles to strategy implementation will likely play a vital role in this process. Obstacles are the internal and external events that act to modify or impede execution of the initial strategic intention. On the one hand, obstacles may modify the original strategic intention, preventing it from being fully implemented as planned. In this case, the realized strategy is not exactly the intended strategy. On the other hand, obstacles may prevent altogether the implementation of the intended strategy. In this case, the outcome of the intended strategy is an unrealized strategy. Emergent strategies might also modify or prevent intended strategies from being implemented.
Obstacles might prevent implementation in at least three different ways. (1) Obstacles can accumulate, without relating to each other (e.g. Hickson et al., 2003; Miller et al., 2004). Accumulation means the successive addition of obstacles. (2) Obstacles might interact with other obstacles (e.g. Wernham, 1984, 1985; Beer and Eisenstat, 2000). Interaction means reciprocal action, a bidirectional reciprocal relationship, perhaps even a mutually reinforcing relationship with a multiplicative effect between obstacles. (3) Obstacles can cause other obstacles and in this way form causality chains between them. Causality means that there exists a cause and effect relationship between obstacles.
For a simple accumulation of obstacles to occur, obstacles must be independent and unrelated. For an interaction between obstacles to occur, obstacles must simultaneously coexist in time and reinforce themselves. For a causal relationship to occur, obstacles must
occur in different moments in time but be related by some type of function or underlying logic.
Considering that the literature seems to explicitly embrace the former two concepts, but not the latter, this paper is aimed at exploring the concept of causality. To this purpose, in addition to the evidence previously discussed, the paper illustrates how chains of obstacles can emerge in a real world context, using case study evidence.
5. Methodology
In order to increase the understanding of the reasons why so many strategy
implementation initiatives fail, and to expand the available empirical evidence supporting the answers to the questions discussed previously, this paper discusses the development of a strategic plan at a Faculty of Economics of one of Portugal’s newer public universities.
Although a case study research methodology has its own limitations of reliability and validity, and provides little basis for generalization, the opportunity it offers to examine, in-depth, the phenomenon under study and to deliberately cover contextual conditions represents an advantage over other methodologies in accomplishing the objectives of this research. Furthermore, by proposing a framework to explain strategy implementation failure (please see section 4), this paper is following good-practice recommendations in terms of proving causal relations. As emphasized by Maxwell (2004: 251), “causal explanation (…) involves the development of a theory about the process being investigated (…). Such a theory assists in designing the research, identifying and interpreting specific evidence supporting or
challenging the theory, and developing alternative theories that need to be ruled out to accept this theory.” The importance of building a conceptual framework to focus the collection and analysis of data had also been previously pointed out by Miles and Huberman (1994: Chapter 2).
after the case study intervention, using a case study protocol as suggested by Yin (1994), and covered a period of over 2 years. The role of the researchers as participant observers was instrumental in reaching some of the conclusions and covered different forms of engagement including: (1) interviewing key people from the organization including the Dean and Vice-Dean of the Faculty; (2) gathering information from sources other than interviews (e.g., questionnaires to faculty members, administrative staff and student representatives;
observation of meetings involving administration, faculty members and other staff members and documents released by the media, the university and the government); (3) facilitating meetings; (4) planning and designing particular interventions; (5) coding and analyzing the information collected; and (6) reporting the results and facilitating their discussion with the organization.
The interviews with the Dean and Vice-Dean were semi-structured in format and took place at two different periods in time. The first interview took place prior to the start of the strategic planning process and soon after the Dean of the faculty formed a steering group, which included the authors of this paper, to guide the effort of implementing a new strategy for the Faculty of Economics. This interview was aimed mainly at clarifying the objectives to be reached and the process to be followed. The second interview took place after the strategic planning process was interrupted. The aim of this interview was to capture the perceptions of the Dean and Vice-Dean regarding the reasons for the failure of the process and, in doing so, validate or question the conclusions reached by the authors. In both occasions, notes were taken by one of the authors, while the other conducted the interviews.
Other key sources of information were the meetings, including a half-day workshop, that took place during the preparation of the strategic plan and the observation of these meetings by the two authors. In order to identify, structure and keep a record of the views of the participants in these meetings, in some of them, the Oval Mapping Technique (Eden and
Ackermann, 1998) was used. A diary was also kept throughout the process by one of the authors in order to keep a record of the activities carried out as well as key thoughts and questions that emerged during the observation of the meetings or while analyzing the information collected.
The diary and the long term participant observation of the process by the researchers were instrumental in establishing causality relationships during the data analysis stage. The diary allowed us to establish a chronological sequence of events which is a necessary
condition to demonstrate causality (Bullock et al., 1994; Mulaik, 2009: 101). The participant observation, allowed us to obtain detailed data about specific situations and events and draw a clearer picture of causal processes.
The coding of the data was data driven and took place both during and after data collection, a tactic commonly used by qualitative researchers (Miles and Huberman, 1994). During data collection, codes were used to categorize and synthetize the different
implementation obstacles identified in the literature. At a later stage, once the data were collected and notes were taken regarding the events that prevented the implementation of the strategy, a coding process was used again to match the obstacles that emerged during the case study intervention with those that had been identified from the literature review.
In addition to these strategies, a narrative strategy (Pettigrew, 1990) was also adopted to construct a detailed story from the data and to prepare a chronology of events. As argued by Weiss (1994: 179), in qualitative studies “the demonstration of causation rests heavily on the description of a visualizable sequence of events, each event flowing into the next”. A similar opinion is shared by Maxwell (2004: 254) who also emphasizes that a chronological
“description of a social setting or event can reveal many of the causal processes taking place”. By using narrative and case analysis, it was possible to elucidate the connections between events and the interaction of causal processes as suggested by Maxwell (2004).
Because not all events or processes were physically observed, an interpretive approach had also to be adopted and some inferences had to be made during the data analysis, wherein the researchers attempted to elucidate and explain results by fitting together the multiple pieces of evidence, including the perceptions and reactions of those involved in the case study. It is important to emphasize, however, that at key points of the process some of the most influential participants, including the Dean, were asked to explicitly express their views regarding the process followed as well as the outcomes achieved. This allowed us to assess the correctness of our interpretations and also to check for eventual rival explanations. As emphasized by Miles and Huberman (1994), getting feedback from informants is fundamental to test and confirm findings.
Validity issues were addressed in three main ways. Firstly, by employing multiple sources of evidence (e.g. participant-observation, interviews and documents) to get the most accurate and detailed picture of events as possible and to corroborate findings. On several occasions the steering group also consulted the Dean and Vice-Dean of the faculty to check on the correctness and completeness of the conclusions reached. Secondly, by having more than one researcher present at some key points of the data collection process. Finally, by following an explanation building logic in analyzing the case study evidence. Reliability was integrated into the research design through the use of a plan containing all the major
components suggested by Yin (1994).
6. Case study: the faculty and the process
The Faculty of Economics where the case study took place has approximately 900 students, 45 teaching and research staff, and 15 technical and administrative staff and is responsible for undergraduate and postgraduate courses in Economics, Business
Administration and Sociology.
appointment of a new Dean, and its main objective was to develop a clear strategic plan to guide the work of the faculty over the next three to five years.
The process brought together representatives of the major stakeholder groups of the faculty (e.g. administration, faculty members, other staff members and students) and, through consultation, discussion and group consensus, established collective priorities for the faculty that were consistent, measurable and aligned with the faculty’s vision and strategic objectives. The procedure adopted was one of synergy, as recommended in Shapiro and Nunez (2001), and consisted of the following stages.
First, a preliminary strategic planning meeting involving the Dean and Vice-Dean of the faculty, the President of the Scientific Committee, each of the directors of the three
undergraduate degrees offered by the faculty, and two more staff members was held to identify and discuss strategic issues and to schedule two further meetings. These meetings involved all the members of the Scientific Committee and the President of the Pedagogic Committee, and were aimed at explaining the need for a new strategy and how the process would be organized, who would participate and how.
A half-day workshop was then held in order to analyze the internal and external environment and to agree upon the faculty’s vision and overall mission. In order to identify and structure the views of the participants, the oval mapping technique was used. In
particular, the participants were invited to write their ideas or issues on stickers (one post-it for each idea) and place them on a large board visible to everyone. After the workshop, the steering group carefully analyzed and clustered the issues that had surfaced during the workshop and as a result of this process prepared a draft strategic plan.
Then, the steering group consulted the Dean and Vice-Dean of the faculty on the completeness and appropriateness of this plan. Feedback was received and was used to refine and extend the plan. Having developed a generally accepted vision and mission statements, a
set of objectives, and strategies for obtaining them, these were issued to the faculty’s main stakeholders for consultation and comment.
A questionnaire and a cover letter explaining the purpose of the questionnaire were distributed to all staff members and to student representatives. The main objective of the questionnaire was to give the respondents the opportunity to provide additional comments and to rank the issues that had surfaced during all previous meetings in order to understand which ones were considered most important by the faculty’s key stakeholders. Twenty-nine teaching and research staff members (64%), four technical and administrative staff members (27%), and sixteen student representatives (100%) replied to the survey, with average results, for each of the 150 items of the questionnaire, ranging from a minimum of 3.2 (agreement) to the scale’s maximum of 4.0 (complete agreement). Items were ranked in accordance with their average results.
Following this ranking exercise, the results were re-issued to the Dean and Vice-Dean for further discussion. Once analyzed and approved by faculty leadership, a revised version of the plan was presented at the Scientific Committee by the Dean and the steering group. It was discussed by all participants and several suggestions were made. A strategy map (Kaplan and Norton, 2000) was then developed in order to ensure the coherence of the vision, mission and objectives, and to help communicate the strategy to the different stakeholders of the faculty, and a final version of the strategic plan was produced.
In summary, the outcome from the process was a written document which contained a synthesis of the SWOT analysis, a list of the fundamental stakeholders, the faculty vision, mission, strategy and strategic competencies – to be developed in order to differentiate the faculty –, and a list of objectives to be pursued during the Dean and Vice Dean’s mandates (three years). These were sanctioned by the Dean and Vice-Dean. The steering group also developed a consistent set of 35 key performance measures to monitor the achievement of the
strategic objectives specified in the plan. However, targets and dates for each specific key performance measure were not discussed. Regrettably, the strategic plan was completed and approved, but not implemented, in spite of the steering group having followed a process tailored to prevent some of the best known implementation obstacles.
7. Reasons for strategy implementation failure in the Faculty of Economics
The main reasons for the interruption of the process and failure to implement the plan are now presented in chronological order.
First, participants selectively collected and retained information regarding some
important events. For example, in spite of the use of formal and informal methods, including a national conference held at the faculty, aimed at obtaining all relevant information about an important future event, the so-called ‘Bologna Process’, the strategy process participants did not correctly anticipate the speed of this event nor its full competitive impact. A commonly held view among the participants was that it would be «very unlikely that any of the major Portuguese Universities [would] adhere to the Bologna Process in the first year». The Faculty Dean and Vice-Dean mentioned this assumption more than once. As a consequence,
reasonable but conservative expectations were initially formed about the speed the faculty’s competitors would adhere to the Bologna Process. In accordance with these expectations, a top-down approach was chosen to develop and implement the faculty’s strategy. Forming conservative expectations about future competitive challenges meant that participants’ mental models were not correctly updated in accordance with future events and consequently created an initial excessive confidence on the success of the plan that was expressed by feelings of «difficult but probable success» shared between the Dean, Vice-Dean and the steering group.
Second, the steering group replaced a systematic behavioral diagnosis with a brief and informal analysis. A proper diagnosis would have allowed for a more precise assessment of the organization’s readiness for change and, in particular, it would have helped anticipating
the motives for the infrequent participation in the planning process of an influential member of the faculty – a strong formal and informal leader, and a former Dean of the faculty. This member’s infrequent participation has probably affected the completion and implementation of the plan as it separated him from the change proponents and made the group of influential change proponents less numerous. This sent a message of lack of political support to
participants, a view shared by the steering group and the Dean and Vice-Dean (who
commented on this absence), and rendered the management team less effective by the absence of a valuable and insightful manager.
Third, the rush of Portuguese universities to comply with the new framework for higher education that had been set by the Bologna Process (OECD, 2006) was not anticipated as the expectation expressed by the participants on several occasions was that it would «take considerable time for universities to comply with the principles of the Bologna Process». However, news in the media and informal contacts with Deans of other schools soon made it evident, that the major Portuguese universities offering courses in Management and
Economics were going to complete the Bologna reforms in the first year.
This rush to Bologna compliance created, therefore, an enormous competitive pressure that was highly unexpected when the faculty started its strategic planning, just a few months before. As a consequence, the faculty wanted to be a part of the first wave of Portuguese institutions joining the Bologna Process. The view expressed by the leadership of the Faculty of Economics was that «continuing with 4 years undergraduate curriculums when the other universities [were] reducing the duration of their courses to 3 years, [would] be very detrimental to the competitiveness of the Faculty». This required a tremendous effort to quickly make all the necessary changes: bureaucratic, academic, procedural and others. These changes were made necessary too suddenly and thus constituted unanticipated internal
Fourth, in addition to the existing university degrees that had to be adapted to conform to the Bologna Process, the faculty saw an opportunity to develop new master courses and several proposals were made and approved. This represented one of the greatest efforts ever to develop new products. Although the content of the strategic plan did not exclude such
proposals, the planning process suffered from this intense simultaneous strategic activity. Participants experienced a conflict of priorities, as some of them were actively involved in the strategic planning process and simultaneously coordinating the development of new courses. This conflict of priorities ended up leading to the inversion of the initial top-down approach to an emergent bottom-up approach. One major symptom of this shift was the lack of time and energy to invest in the formal strategic planning activity. Several attempts to schedule a meeting to move forward with the strategic planning process proved unsuccessful as some of the participants emphasized that they were «very busy with the new courses».
Fifth, the members of the steering group were all directly involved in the development of several of those new course proposals. This involvement came on top of all other current professorial activities in the faculty. Again, lack of time was a major hindrance, which became evident when meetings of the steering group had to be postponed because of other important urgent matters.
Sixth, the Portuguese Government decided to change the whole process for evaluation of the higher education institutions (HEI) and introduced new legislation on the topic (CNE, 2008:47554). Other major changes were also introduced in the funding and governance of HEI. For instance, the universities funding changed from public only to public and private, and from a ‘teaching based funding’ to a ‘research based funding’ (OECD, 2006:80-82,103).
Seventh, these nationwide changes impacted not only the Faculty of Economics but also the University to which it belongs. A dramatic change in the university strategy, structure, governance and budgeting had to be developed. These changes dramatically modified the
context for the development of the institution, and the uncertainty that they introduced was an obstacle for the conclusion and implementation of the strategic plan of the faculty.
Eighth, the time frame for the Dean and Vice-Dean mandate was three years. The strategic planning process commenced in the second month of the mandate and it was on track until the seventh month. After that, the process started to suffer from delays, motivated by the above mentioned phenomena. This became obvious when it started being difficult to get a suitable time for all the key participants in the process to discuss the strategy of the Faculty due to other commitments. By the end of the first year there were too many changes taking place, both internally and externally, and the SWOT analysis had lost its focus. Even if the plan had been completed and approved, it would have had insufficient time for
implementation. The approach of the second half of the three year mandate was an obstacle to the strategy formation and implementation.
Ninth, the Dean and Vice-Dean had no intention of seeking election for a second mandate. As their mandate approached the middle, they mentioned on a few occasions that they had «no intention of being re-elected» and, consequently, the priority level they attributed to the development and implementation of a strategic plan was interpreted as having decreased. This interpretation found support in the fact that their commitment to the planning process waned. On several occasions the authors met the Dean and Vice-Dean and contrarily to what happened during the first months of the process, no mention was made of the strategic plan.
Tenth, the targets for the key performance measures defined to monitor the achievement of the strategic objectives were never discussed or approved. The need for a meeting between the steering group and the Dean and Vice-Dean was mentioned on a few occasions but it never took place. Other activities absorbed all the available time and the meeting was simply postponed successively.
8. Analysis of the reasons for failure, implementation obstacles and chains
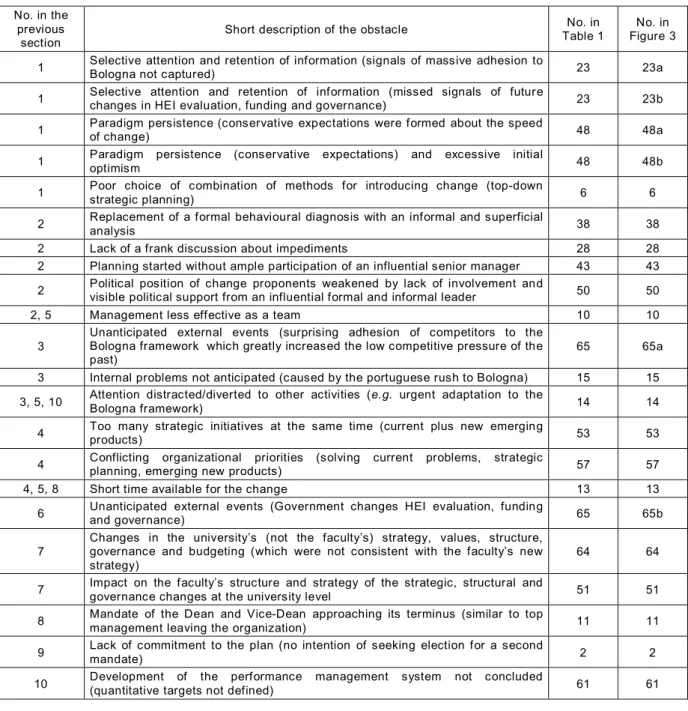
This section analyzes the aforementioned strategy implementation obstacles and the chains of causality that they have formed. For this purpose, it is convenient to start by comparing the obstacles suggested in the literature, and indicated in Table 1, with those identified in the previous section of this paper, which occurred in the case study of the Faculty of Economics. Table 3 is the result of this comparison. In order to elaborate on this table and facilitate the analysis, the ten reasons presented earlier were broken down into twenty-two detailed causes for failure. These were, in turn, re-ordered in accordance with the time at which they first occurred. The order of the obstacles is important in this research because, one of the basic requirements for establishing a casualty relationship is the temporal ordering of the cause and of the effect (the cause must be shown to unambiguously precede the effect; Bullock et al., 1994; Mulaik, 2009: 101).
Table 3. Comparison of obstacles in the literature with those of the Faculty of Economics
No. in the previous
section
Short description of the obstacle Table 1 No. in Figure 3 No. in
1 Selective attention and retention of information (signals of massive adhesion to Bologna not captured) 23 23a
1 Selective attention and retention of information (missed signals of future
changes in HEI evaluation, funding and governance) 23 23b
1 Paradigm persistence (conservative expectations were formed about the speed
of change) 48 48a
1 Paradigm persistence (conservative expectations) and excessive initial
optimism 48 48b
1 Poor choice of combination of methods for introducing change (top-down
strategic planning) 6 6
2 Replacement of a formal behavioural diagnosis with an informal and superficial
analysis 38 38
2 Lack of a frank discussion about impediments 28 28
2 Planning started without ample participation of an influential senior manager 43 43
2 Political position of change proponents weakened by lack of involvement and visible political support from an influential formal and informal leader 50 50
2, 5 Management less effective as a team 10 10
3
Unanticipated external events (surprising adhesion of competitors to the Bologna framework which greatly increased the low competitive pressure of the past)
65 65a
3 Internal problems not anticipated (caused by the portuguese rush to Bologna) 15 15
3, 5, 10 Attention distracted/diverted to other activities (e.g. urgent adaptation to the Bologna framework) 14 14
4 Too many strategic initiatives at the same time (current plus new emerging products) 53 53
4 Conflicting organizational priorities (solving current problems, strategic
planning, emerging new products) 57 57
4, 5, 8 Short time available for the change 13 13
6 Unanticipated external events (Government changes HEI evaluation, funding
and governance) 65 65b
7
Changes in the university’s (not the faculty’s) strategy, values, structure, governance and budgeting (which were not consistent with the faculty’s new strategy)
64 64
7 Impact on the faculty’s structure and strategy of the strategic, structural and
governance changes at the university level 51 51
8 Mandate of the Dean and Vice-Dean approaching its terminus (similar to top
management leaving the organization) 11 11
9 Lack of commitment to the plan (no intention of seeking election for a second
mandate) 2 2
10 Development of the performance management system not concluded (quantitative targets not defined) 61 61
Two main conclusions can be drawn from the analysis of Table 3 and from the analysis carried out in the previous sections. Firstly, the analysis suggests that there are many
individual reasons why strategy implementation can fail. In the case study at hand twenty-two obstacles were combined, leading to an unsatisfactory result.
Secondly, the analysis indicates that although obstacles may simply accumulate, they may also relate with each other in dynamic and complex manners. Obstacles accumulate when they occur randomly, with no identifiable cause or relationship to other obstacles.
Accumulation might happen either at a particular moment or over time. Obstacles may, however, reinforce themselves in an interactive and/or causal way. In the latter case, the emergence of an obstacle is triggered by another obstacle, which in turn may generate another and another, culminating in a chain or a complex network of obstacles.
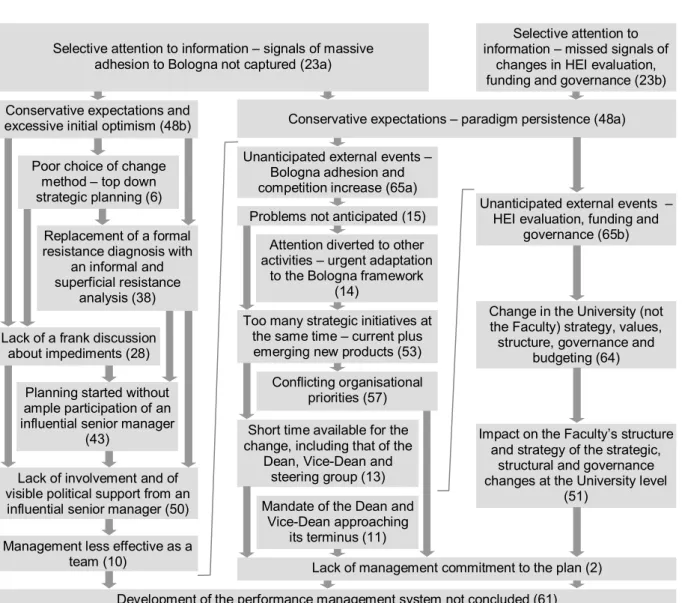
In the case study under analysis three major chains of causality, diagrammed in Figure 1, have led to the failure of the strategy implementation, suggesting that the various obstacles may combine in several different chains of events. The sequence of obstacles in each chain can be easily compared with the chronological representation in Table 3. In the case of the faculty, the problems started with the inability of the participants to obtain the information necessary to define the next steps of the strategy process. In particular, no information about which HEI would adhere to the Bologna process was available at the beginning of the
strategic planning process, which led the participants to believe that compliance «would take considerable time». Also, the changes in HEI evaluation, funding and governance that came into effect during the process, were not raised in the strategic planning meeting or subsequent workshop. Therefore, the first two obstacles are common to the three chains, and are
represented with larger rectangles, but then they led to different sequences of blockages, all contributing to the abandonment of the approved strategic plan.
Figure 1. Three series of obstacles linked in causality chains of events
Note: Figure 1 has been vertically compacted for convenience. Vertical lines in the shape of tall inverted Zs represent chronological precedence according to Table 3: obstacle 10 precedes obstacle 65a, and obstacle 13 precedes obstacle 65b. Causality is represented by arrows.
The first chain of causality (left on Figure 1) is related to the Faculty of Economics’ management. The conservative expectations and the steering group’s excessive optimism expressed by feelings of «difficult but probable success» led to a poor choice of change management method and to a superficial behavioral diagnosis which prevented the group from anticipating the reasons for non-participation of a charismatic and experienced senior manager. A frank discussion about the reasons for his absence and about his possible disagreement with the strategy never took place. Thus, a plan was developed without him, rendering the senior management team slightly less influential and less effective. In particular
Conflicting organisational priorities (57) Problems not anticipated (15)
Attention diverted to other activities – urgent adaptation
to the Bologna framework (14)
Short time available for the change, including that of the
Dean, Vice-Dean and steering group (13) Mandate of the Dean and
Vice-Dean approaching its terminus (11)
Development of the performance management system not concluded (61) Lack of management commitment to the plan (2) Too many strategic initiatives at
the same time – current plus emerging new products (53)
Planning started without ample participation of an influential senior manager
(43) Lack of a frank discussion
about impediments (28)
Management less effective as a team (10)
Lack of involvement and of visible political support from an
influential senior manager (50)
Change in the University (not the Faculty) strategy, values, structure, governance and
budgeting (64)
Impact on the Faculty’s structure and strategy of the strategic,
structural and governance changes at the University level
(51) Unanticipated external events –
Bologna adhesion and competition increase (65a) Poor choice of change
method – top down strategic planning (6)
Replacement of a formal resistance diagnosis with
an informal and superficial resistance
analysis (38)
Selective attention to information – signals of massive adhesion to Bologna not captured (23a)
Conservative expectations and excessive initial optimism (48b)
Unanticipated external events – HEI evaluation, funding and
governance (65b) Selective attention to information – missed signals of
changes in HEI evaluation, funding and governance (23b)
the steering group observed that after the absence of the charismatic leader from the half-day workshop, it became more difficult to obtain comments regarding the strategy of the faculty from some of the faculty’s main stakeholders, who had previously been very cooperative. This chain clearly illustrates how an obstacle, or more than one obstacle, can be the cause for a series of subsequent obstacles, which occur in different moments in time.
The second chain of causality identified (centre of Figure 1) is related to the
unanticipated speed of the Bologna Process and the internal activities that it triggered. This external event led to an unanticipated need to quickly adapt the existing courses. Therefore, attention was diverted to solve this strategic problem. This became clear when several meetings started being scheduled to discuss the changes that had to be implemented in order for the undergraduate degrees of the Faculty of Economics to comply, during the first year, with the Bologna process. And, if this diversion was not enough, some members then decided to create new courses, which increased the conflict in the priorities of competing strategic activities: strategic planning, adapting current courses, and creating new ones. The main consequence of this effervescent strategic activity and of the conflicting priorities was a lack of time available for planning. Meanwhile, the Dean’s mandate was coming close to its mid-term and since he had no intention of seeking re-election, his commitment to the plan
diminished. This became apparent when the members of the steering group mentioned to the Dean that they were available to schedule a meeting to discuss the strategic plan process, but this meeting never took place. Again, this chain suggests that an obstacle or more can be the cause for a series of subsequent obstacles.
The third chain of causality (right on Figure 1) is related to external events and to university governance, strategy and structure. The unanticipated external events caused turmoil in all the Portuguese universities with governance, structure, assessment and budgeting being under scrutiny. This fact was widely reported in the press and raised great
concerns within the faculty, regarding the kind of impact this scrutiny would have on its own strategy and structure. These concerns were expressed by the leadership of the Faculty in several meetings of the Scientific Committee. The high level of uncertainty raised contributed to a less committed top management team and further undermined the implementation of the strategic plan of the faculty. As mentioned previously, it became difficult even to arrange a meeting to discuss the implementation of the Faculty’s strategy. This chain is shorter and simpler than the others, but again, it illustrates how chains of obstacles can form.
The analysis of these three chains shows that in any of them the emergence of an obstacle triggered another, which led to another and another, until the interruption of the strategy process. This is an important characteristic of the chains of obstacles. Another important characteristic of the three chains is that they share some of the blockages identified in the case study. In fact, five of the obstacles in Table 3 (obstacles 2, 23, 48, 61 and 65) are shared by at least two of the chains. The three chains start with obstacles 23 and 48, two of them contain obstacles 2 and 65, and all end with obstacle 61.
Although the representation of the relationships between obstacles is, in this case, linear and sequential, it is possible that, in other settings, other types of relationship might occur. Vicious circles, so popular in the literature (e.g., Beer and Eisenstat, 2000; Balogun, 2006), might also occur, although none has been observed in this case study.
Finally, it can be argued that the three chains form a complex network of causal
relationships. The representation of the chains in Figure 1 can be seen as a network composed of three parallel chains with some shared blockages. It is possible that, in other settings, obstacles might form similar networks of chains. Most of these chains remain, however, poorly understood and one important question for researchers is whether there are common patterns of obstacles that can be identified.
9. Discussion and implications for research and practice
The ideas of accumulation and of interaction between obstacles to strategy
implementation are not new. Whilst Hickson et al. (2003), Miller et al. (2004) and Sirkin et al. (2005) discuss the accumulation of obstacles, Wernham (1984, 1985) and Beer and Eisenstat (2000) suggest the interaction among blockages. Other researchers might implicitly assume the possibility of accumulation and/or of interaction, but only these explicitly discuss those topics, as indicated in Table 2.
Regarding the concepts of causality between obstacles and of chains of obstacles, there is clearly a dearth of studies which explicitly address these topics. The only study that comes close to addressing them is the work of Beer and Eisenstat (2000), which describes a model of the interactions among six ‘silent killers’ of strategy implementation and refers to the
existence of a vicious circle of obstacles. This study represents a major step forward in the understanding of the relationships between obstacles and how these can prevent successful strategy implementation. However, it considers a limited number of obstacles (six) in a rigid model of predetermined interactions and, more importantly, this research does not discuss the concepts of unidirectional causality and of chains of obstacles. Consequently, the differences between interactions, causality and vicious circles, if any, are not discussed. Empirical evidence of the interactions/vicious circles is also vague and scarce, since the researchers present evidence of each of the obstacles (silent killers) but little (or no) evidence of causality. Furthermore, none of the conditions necessary to demonstrate causality (Bullock et al., 1994; Mulaik, 2009: 101) are considered in their work.
The present paper contributes to this discussion by providing temporal evidence from a case study and by clarifying the differences between accumulation, interaction, linear chains of causality and vicious circles. This study seems to be, therefore, the first to suggest that obstacles can cause other obstacles and that they can form long chains of successive
blockages.
The study is also a departure from previous work in that it explicitly brings together the previously identified concepts of accumulation and of interaction between obstacles with the ‘new’ concept of causality to explain strategy implementation failure. Many researchers have proposed prescriptive approaches for managing change (Balogun, 2006), but few have studied the reasons why the 30-70 percent rates of strategy implementation failure persist. The
framework suggested here adds a new explanation for these rates of failure. In particular, it shows that many different kinds of relationships between obstacles may emerge and that these relationships are less predictable and rigid than it might be suggested by previous studies (e.g. Beer and Eisenstat, 2000; Beer et al., 2005).
A fundamental question remains, however, unanswered: How do chains of obstacles develop? A plausible explanation is that chains may develop through a combination of undesired events, organizational members’ initial intentions and emergent opportunistic behaviors. Employees’ and middle managers’ behaviors are guided by persistent mental models, strongly protected by cultural artifacts (Johnson, 1988, 1990, 1992), which slowly evolve through an iterative process composed of a succession of social interactions, each with the purpose of making sense of unfolding top managerial actions and events that people cannot immediately understand (Argyris, 1977; Gioia and Chittipeddi, 1991; Balogun, 2006). These shared, persistent, slowly evolving mental models, composed of deeply held values and assumptions, constitute an underlying evolving explanation (logic) for active or passive resisting behaviors, including sabotage (Morrison and Milliken, 2000).
The recognition that people may resist change in many different ways and can do so actively to aggressively undermine implementation initiatives (Kotter and Schlesinger, 1979), and the recognition that an iterative process of social interactions underlies the evolution of people’s guiding mental models (Balogun, 2006) may, in fact, help explain how chains
develop and how they lead to failure. In particular, because these recognitions suggest that some kind of preconceived sequence of actions, possibly combined with opportunistic behavior that takes advantage of emerging internal and external events (Mintzberg and Waters, 1985; Mintzberg, 1987), some of which are by themselves obstacles to change, gives rise to other obstacles in order to prevent successful strategy implementation.
This initially preconceived and then emergent logic seems to constitute a reasonable explanation for many failed change efforts, although it does not seem to have been recognized as such by researchers. However, chains may also develop without any deliberate intention to resist change, as it was the case of chain three discussed above. This question of how chains of obstacles develop is, however, a question which demands further research.
In trying to provide an answer to the research questions presented in the introduction, the findings in this paper have several implications. The very high number of obstacles that exist makes it difficult for managers to keep all of them in mind. This finding suggests that any method which allows managers to anticipate the type of obstacles more likely to be faced by their organizations (Porter and Smith, 2005), and to anticipate the patterns of interaction or causality among them, would have major implications in this area. The classification of obstacles in a small number of generic types, as proposed by several researchers (e.g., Kotter, 1995; Beer and Eisenstat, 2000) seems to be insufficient to help managers identify the
specific types of obstacles from which their organizations are more likely to suffer. Although Sirkin et al. (2005) suggest the opposite; that managers should focus their attention on a short number of generic factors (obstacles) in order to avoid dealing with too many priorities simultaneously and to avoid spreading resources, they agreed that participants must engage in debate in order to identify the underlying specific causes of problems and to tailor specific and innovative solutions.
would be important to develop processes which allow them to deal with these obstacles once they emerge preventing their interaction and chain formation. As this research suggests, chains of obstacles and the difficulty of eradicating them are perhaps the reasons why it is so difficult to implement a new strategy and why most of the failure rates have been estimated to be so high.
In spite of the limitations of this research, which are discussed in the next section, the three chains identified in this work may constitute a valuable set of patterns of obstacles, both for research and practicing managers. These ‘examples’ can serve to develop theoretical frameworks aimed at understanding how chains of obstacles can be conceptualized, how they emerge, and how they can be recognized and stopped.
10. Main research limitations and future research
Causality between strategy implementation obstacles is one of the main themes in this research. However, establishing the existence of causality is a difficult task. Our
methodology, addresses, however, one of the most important conditions for establishing causality, which is the temporal ordering of the cause and of the effect (i.e., the cause must precede the effect, or a change in the independent variable must precede the change in the dependent variable). In this study, the temporal ordering of the strategy implementation obstacles was specifically considered. The case study methodology that was adopted, longitudinal in nature, offered some advantages over other methods in gathering temporal evidence on the phenomena under study. Furthermore, the intensive, long-term involvement of the researchers in the setting studied, the collection of rich data and the narrative strategy adopted, have all been suggested as valuable strategies for developing causal explanations (Maxwell, 2004).
However, as pointed out by Sayer (1992:260) “narratives suffer from a tendency to under-specify causality in the processes they describe” and to “gloss over the difference
between mere temporal succession and causality”.
Thus, one major limitation of the study, and a suggestion for future research, derives from the current study’s methodology and from its inability to prove beyond any doubt that causality between obstacles exists.
Although the case study methodology employed in this study can verify one of the three conditions necessary for proving causality (temporal ordering between cause and effect), two other conditions are concurrently required - the existence of correlation between two variables and the ruling out of extraneous variables. Future research based on cross sectional and
survey methods might assess the correlation between obstacles and begin to address these limitations.
Alternative methodologies for studying causality have been proposed in the literature. Two approaches that seem promising for the study of chains of obstacles are the systems view, which explores interactions among activity choices in complex systems (e.g.
Siggelkow, 2002; Woodside, 2010: 343), and the fuzzy set qualitative comparative analysis, which explores the variety of alternative ways by which a common outcome might occur (Ragin, 2000).
The idea, put forward in this paper, of combinations of obstacles that can form chains, is strikingly compatible with both the systems view and with the fuzzy set view of different causes for a common outcome (‘heterogeneous causality’). Future research based on these approaches would have the advantage of being able to address the multiplicity of possible combinations between obstacles and contribute to mitigate the limitations of the present study in areas where quantitative methods are unable to do so.
11. Conclusions
The development and implementation of a strategic plan is not a straightforward task, with most authors estimating a rate of failure of between 30 and 70 percent. In order to
understand these findings and the reasons why these rates still persist, the researchers carried out a literature review and discussed a case study of the development of a strategic plan in the Faculty of Economics of one of Portugal’s newer universities.
Although a case study research methodology provides little basis for generalization, the main objective was to contribute to research advancement by providing possible explanations for implementation failure, and ideas for further research in the field.
In order to extract useful conclusions and implications from the case study, twenty-two specific obstacles were identified and compared to the list of sixty-five obstacles, previously compiled from the literature review. Based on the evidence gathered from this comparison, from the case study analysis and from the exhaustive review of the literature, two major conclusions were then drawn.
The first conclusion is that the obstacles affecting a strategy process may simply accumulate over time, without any interaction or causality between them, as it is frequently assumed. However, the evidence gathered from the case study, strongly suggests that the occurrence of an obstacle will probably generate another related impediment, which in turn may generate another and another, leading to a ‘coherent’ chain of obstacles, acting together and reinforcing each other. This is an important finding as the occurrence of sequences of obstacles, linked together in reinforcing chains of causality, is a possibility that has not been investigated in the literature, and as a consequence remains poorly understood.
The second conclusion is that a coherent intertwinement of obstacles brings increased complexity to the process of strategy formulation and implementation. This enhanced
complexity makes it more difficult for managers to deal with the obstacles and the chains they form, and puts a strong emphasis on the need for management to assume a preventative attitude, rather than a reactive solution to the problem. Although the idea of accumulation and interaction between obstacles to implementation is not completely new, the proposition that