Cláudia Sofia Ferreira Raposo
Effect of EDTA enriched diets on farmed
fish allergenicity; a proteomics approach
UNIVERSIDADE DO ALGARVE
Faculdade de Ciências e Tecnologias
Cláudia Sofia Ferreira Raposo
Effect of EDTA enriched diets on farmed
fish allergenicity; a proteomics approach
Master in Aquaculture and Fisheries Specialization in Aquaculture
Thesis supervision by: Doutor Professor Pedro Rodrigues
UNIVERSIDADE DO ALGARVE
Faculdade de Ciências e Tecnologias
Effect of EDTA enriched diets on farmed
fish allergenicity; a proteomics approach
DECLARAÇÃO DE AUTORIA DE TRABALHO
Declaro ser a autora deste trabalho, que é original e inédito. Autores e trabalhos consultados estão devidamente citados no texto e constam da listagem de referencias incluída.
Universidade do Algarve, 30 de Setembro de 2016
© 2016 Cláudia Sofia Ferreira Raposo
A Universidade do Algarve reserva para si o direito, em conformidade com o disposto no Código do Direito de Autor e dos Direitos Conexos, de arquivar, reproduzir e publicar a obra, independentemente do meio utilizado, bem como de a divulgar através de repositórios científicos e de admitir a sua cópia e distribuição para fins meramente educacionais ou de investigação e não comerciais, conquanto seja dado o devido crédito ao autor e editor respectivos.
Acknowledgments
Ao Dr. Pedro Rodrigues, do Aquagroup e Professor da Universidade do Algarve, meu orientador, por me mostrar uma área de estudo pela qual me apaixonei, pela incansável ajuda e disponibilidade, pela preocupação, por me guiar, pelo ensinamento, por todas as oportunidades que me concedeu que desenvolveram bastante as minhas competências e pela força que sempre me desejava mesmo estando do outro lado do mundo.
À Denise Schrama, do Aquagroup, a minha orientadora não-oficial e companheira de viagens Europeias (espero que ainda venham muitas) um agradecimento obviamente mais do que especial, por todo o conhecimento teórico e prático que me transmitiu, orientação, supervisão, tempo, paciência, boa-disposição e por mesmo assim ainda me pedir desculpa por achar que não me dá atenção suficiente! E mais importante ainda, à amizade que se desenvolveu. Um grande e sincero obrigada, é definitivamente uma pessoa e uma trabalhadora incrível, e tenho a certeza que será uma grande doutora e investigadora.
Ao laboratório 1.8 do CCMAR, mais conhecido por Aquagroup, e toda a sua equipa por sempre me terem feito sentir bem-vinda e me terem integrado, pela ajuda, pela oportunidade, pelas gargalhadas.
À equipa do Ramalhete e ao André Lopes, por ter alimentado e cuidado das minhas douradas e especialmente por ter limpo os tanques! E claro, à amizade e companhia principalmente para os almoços na cantina da Universidade.
A todas as restantes entidades envolvidas neste trabalho, nomeadamente à Sparos pela formulação das dietas, ao GIGA Research Center da Université de Liége pela identificação das proteínas e ao Luxembourg Institute of Health por todo o trabalho de imunodeteção e especialmente à Dra. Annette Kuehn e sua equipa pela orientação aquando da minha estadia neste laboratório.
Ao meu namorado, Tomás Magalhães, por estar sempre lá, pela pessoa que é, pela calma que me transmite, por me fazer rir todos os dias mesmo com as poucas horas de sono, pela força de vontade e por tudo.
À minha grande amiga Irina, pelos 6 meses que vivemos em França, que me acompanhou durante todo o percurso académico e que foi uma peça essencial e que sempre será.
À minha amiga Rita, a minha salvação da minha estadia em Faro, e alguém espetacular que devia ter conhecido mais cedo.
E aos mais importantes e a quem dedico todo este trabalho, os meus pais. Pela educação que me transmitiram, pelas oportunidades que me proporcionaram, pelo apoio, pela ajuda, pelo esforço para me darem o melhor e o impossível, pelo orgulho que demonstram por mim todos os dias, pela preocupação, por todo o meu percurso académico e por todas as metas futuras que atingirei na vida, a origem serão sempre eles.
Abstract
A continuously increase of the world’s population has been registered over the last decades, along with an augment of fish consumption worldwide. Fish is one of the most common elicitors of food-allergies. The panallergen in fish, β-parvalbumin (β-PV), is responsible for the initiation of immunoglobulin-E (IgE)-mediated allergic reactions. PV is a calcium-binding muscle protein, highly stable and IgE cross-reactive. Conserved IgE epitopes are located in the calcium-binding domains where a reduced IgE-binding capacity was found upon calcium depletion. The present work aims to reduce farmed fish allergenicity by inducing this potentially less allergenic PV (apo-PV), through specific fish diets supplemented with Ethylenediaminetetraacetic acid (EDTA), a calcium chelator used as tool to deplete calcium-ions from PV. Gilthead sea bream (Sparus aurata) was reared under four different conditions differing in the supplementation of EDTA. After 98 days of trial, fish were slaughtered and muscle and plasma samples were taken. A biochemical characterization was performed, along with a proteomic analysis. Fish extracts were prepared from fish muscles and proteins were separated by two dimensional difference gel electrophoresis (2D-DIGE) followed by spot identification using matrix-assisted laser desorption ionization – time of flight/ time of flight mass spectrometry (MALDI-TOF/TOF). Fish allergenicity was evaluated by skin-prick tests (SPT) and immunoblot assays with sera from fish-allergic patients. Low concentrations of EDTA showed to have a positive impact in reducing allergenicity without affecting fish growth performance and organoleptic properties. Comparative proteomics showed an effect of the diets with 8% of EDTA in the expression of several proteins with a variety of functions. As expected, parvalbumin’s expression was unchanged. SPTs and immunoblot assays revealed a slightly reduction of the allergenicity. This preliminary experiment shows that an EDTA supplemented diet might be a promisor tool to modulate fish allergenicity and it is a valuable contribution to improve safety of aquaculture fish.
Resumo
Um crescimento contínuo da população tem sido registado ao longo das últimas décadas, acompanhado de um aumento do consumo de peixe a nível mundial. Este aumento do consumo de peixe, associado à promoção de hábitos alimentares que incita o consumo deste produto alimentar, e à diminuição dos stocks de peixes selvagens nos oceanos levou a uma maior procura de peixes de aquacultura. No entanto, o peixe é um dos principais instigadores de alergias alimentares e estudos que englobem as medidas de criação de peixe em aquacultura para modulação deste potencial alergénico são escassos ou praticamente inexistentes. As alergias alimentares são um problema em crescimento na sociedade atual e uma elevada prevalência das alergias a peixe tem sido registada principalmente em países costeiros e países onde o consumo de peixe é elevado. O principal alergéneo no peixe, designado por β-parvalbumina (β-PV), é responsável por desencadear reações alérgicas mediadas por anticorpos imunoglobulina-E (IgE). A PV é uma proteína do músculo, pequena (Mw ~12 kDa), acídica (pI ~ 6), que participa na contração e relaxamento muscular. Pertence à família designada por EF-hand, caracterizada por apresentar dois domínios EF-hand capazes de se ligarem a iões de cálcio. Assim, esta proteína é capaz de se ligar a dois iões cálcio ao mesmo tempo. A quantidade de PV varia também consoante o tipo de músculo e quantidades mais elevadas desta proteína têm sido associadas a uma maior rapidez de relaxamento muscular. É uma proteína altamente estável a desnaturação química, térmica, e proteolítica, e que apresenta reatividade cruzada com os anticorpos IgE. Esta reatividade cruzada é responsável pelo facto de grande parte dos pacientes alérgicos a peixes serem alérgicos a mais do que uma espécie diferente de peixe. Ou seja, estes domínios de ligação podem apresentar uma elevada homologia entre espécies. Na PV estes domínios proteicos onde se ligam os iões de cálcio apresentam epítopos, zonas onde se ligam os anticorpos IgE, que contêm regiões conservadas de aminoácidos. A capacidade de ligação dos IgE aos epítopos é reduzida aquando da libertação dos iões de cálcio da proteína uma vez que uma diferente conformação é induzida. Assim, o presente trabalho visa reduzir a alergenicidade do peixe de aquacultura induzindo uma forma da PV potencialmente menos alergénica (apo-PV), através de dietas suplementadas com ácido etilenodiaminotratraacético (EDTA). Este quelante de cálcio foi usado neste trabalho como uma ferramenta para diminuir a disponibilidade de cálcio no músculo ou mesmo para retirar os iões de cálcio da PV uma vez que foi provado já em diversos estudos, que o EDTA é capaz de imitar a PV na
maioria das suas tarefas de contração/ relaxamento muscular. Doze grupos de douradas (Sparus aurata), constituídos por 25 peixes cada, foram submetidos a quatro condições de crescimento (três tanques para cada condição) diferindo na concentração de EDTA presente na dieta: controlo (0% de EDTA), EDTA3%, EDTA5% e EDTA8%. Após 98 dias de ensaio, os peixes foram abatidos em água e gelo e retiradas amostras de músculo e plasma. Foi realizada uma caracterização bioquímica do músculo do peixe onde foram avaliados os seguintes parâmetros como medidas de qualidade e bem-estar: pH, rigor
mortis, capacidade de retenção de água do músculo (WHC), textura e análise sensorial. Foi
feita também uma quantificação dos níveis sanguíneos de cortisol nos peixes de modo a poder avaliar-se o estado de stress a que os animais estavam submetidos. Seguiu-se uma quantificação da PV através do método de imunodetecção ELISA. Este método foi validado com uma análise proteómica uma vez que os métodos ELISA disponíveis no mercado apresentam anticorpos contra a parvalbumina do bacalhau e, tendo em conta a alta reatividade cruzada que esta proteína apresenta, os resultados podiam não ser significativos. Na análise proteómica foram preparados extratos de músculo de peixes das quatro condições diferentes, seguindo-se uma separação das proteínas através de uma electroforese diferencial em gel a 2 dimensões (2D-DIGE). Nesta técnica as proteínas são separadas consoante o seu peso molecular e ponto isoelétrico e marcadas com flurocromos o que permite a comparação de proteínas pertencentes a diferentes amostras no mesmo gel. As proteínas musculares detectadas como diferencialmente expressas foram retiradas do gel, submetidas a digestão por tripsina e identificadas usando a técnica de espectrometria de massa designada por ionização por dessorção a laser assistida por matriz – tempo de voo/tempo de voo (MALDI-TOF/TOF). A alergenicidade dos peixes foi avaliada através de testes cutâneos (SPTs) e técnicas de imunodeteção utilizando soro de pacientes alérgicos a peixe. Baixas concentrações de EDTA mostraram um impacto positivo na redução da alergenicidade sem efeito sobre o crescimento dos peixes ou propriedades organolépticas o que demonstra possivelmente que uma diferente conformação, menos alergénica da PV foi induzida. Estas baixas concentrações de EDTA tiveram também um ligeiro efeito positivo sobre o pH e a capacidade de retenção de água do músculo possivelmente devido ao facto do EDTA diminuir a disponibilidade de cálcio e assim as protéases dependentes de iões cálcio não serem ativadas. A quantificação do cortisol revelou um estado de stress ligeiramente elevado que pode dever-se a diversas causas como as técnicas de manuseamento. A análise proteómica revelou um ligeiro efeito das
dietas enriquecidas com 8% de EDTA sobre a expressão de determinadas proteínas com funções conhecidas como contração muscular, metabolismo de energia, estrutura celular e reguladores de transcrição de DNA e tradução de mRNA. Tal como era esperado, a expressão da PV manteve-se inalterada, o que foi comprovado pela técnica ELISA assim como pela análise proteómica. Os SPTs com pacientes alérgicos a peixe revelaram uma ligeira redução da alergenicidade para peixes submetidos a 3% de concentração de EDTA. Os testes de imunodeteção realizados com soro de pacientes alérgicos a peixe mostraram igualmente uma ligeira redução do potencial alergénico. Este teste preliminar, apesar de requerer estudos complementares, mostra que dietas suplementadas com EDTA são uma medida promissora para modular o potencial alergénico em peixes sendo uma contribuição importante para a segurança alimentar em peixes de aquacultura.
Abbreviations
µl - Microliter µm – Micrometer
2-DE – Two-dimensional electrophoresis
2D-DIGE – Two-dimensional difference gel electrophoresis 3D – Three dimension
AA – Amino acid
Acetyl-coA – acetyl-coenzyme A ANOVA – Analysis of variance Apo-PV – apo-parvalbumin ATP – Adenosine triphosphate
BLAST – Basic Local Alignment Search Tool
CHAPS – 3-[(3-Cholamidopropyl) dimethylammonio]-1-propanesulfonate hydrate CHL – Centre Hospitalier de Luxembourg
Cm – Centimeter Ctrl – Control
Cy2 – bright, green-fluorescent dye that can be excited using the 492 nm laser line Cy3 – bright, orange-fluorescent dye that can be excited using the 532 nm laser line
Cy5 – bright, far-red-fluorescent dye that can be excited with 633 nm or 647 nm laser lines DMF – Dimethylformamide
DNA – Deoxirribonucleic acid DTT – DL-Dithiothreitol
EAACI – European Academy of Allergy and Clinical Immunology EDTA – Ethylenediaminetetraacetic acid
EDTA3 - Ethylenediaminetetraacetic acid 3 % EDTA5 - Ethylenediaminetetraacetic acid 5% EDTA8 - Ethylenediaminetetraacetic acid 8%
EGTA - ethylene glycol-bis(β-aminoethyl ether)-N,N,N',N'-tetraacetic acid ELISA – Enzyme-linked immunosorbent assay
ESI-Ion Trap – Electrospray ionization-Ion trap EU – European Union
FAO – Food and Agriculture Organization FBW – Final body weight
FCR – Feed conversion ratio FE – Feed efficiency FI – Feed intake g - Grams GE – General electronics h - Hour HCl – Hydrogen chloride His73 – Histidine 73 HRP – Horseradish peroxidase HSP – Heat shock proteins IBW – Initial body weight IEF – Isoelectric focusing IgE – Immunoglobulin E IgG – Immunoglobulin G
IPMA – Instituto Português do Mar e da Atmosfera IUIS – International Union of Immunological Societies kDa – Kilo daltons
LIH – Luxembourg Institute of Health M - Molar
mA/gel – Milliamps per gel
MALDI-TOF/TOF – Matrix-assisted laser desorption/ionization-time of flight min - Minutes
mM – Milimolar
mRNA – Messenger ribonucleic acid MS – Mass spectrometry
Mw – Molecular weight NaOH – Sodium hydroxide nmol – Nanomole
PDH – Pyruvate dehydrogenase
PDHC – Pyruvate dehydrogenase complex
PDHK2 – Pyruvate dehydrogenase kinase, isoform 2 PEA – Plano Estratégico para a Aquicultura portuguesa PFF – Peptide fragment fingerprinting
pI – Isoelectric point
PMF – Peptide mass fingerprinting Pmol - Picomole
POP – Plano Operacional das Pescas PTMs – Post-translational modifications PUFA – Poly unsaturated fatty acids PV - Parvalbumin
RAST – Radioalergosorbent test RB – Rehydration buffer
S.D. – Standard deviation SDS – Sodium dodecyl sulfate
SDS-PAGE – Sodium dodecyl sulfate polyacrylamide gel electrophoresis SGR – Specific growth rate
SIPA1L1 – Signal-induced proliferation-associated 1 like protein 1 SPT – Skin-prick test
SR – Sarcoplasmic reticulum TMA - Trimethylaminuria
TMAO – Trimethylamine N-oxide TMB – 3,3’,5,5’-Tetramethylbenzidine TnC – Troponin C
TnI – Troponin I TnT – Troponin T
Tris-HCl – Tris(Hydroxymethyl)aminomethane hydrochloride buffer UK – United Kingdom
V - Volts
v/v – Volume per volume Vhr – Volume per hour VFI – Voluntary feed intake w/v – Weight per volume Wdf – Weight of dead fish WG – Weight gain
WGt – Total weight gain WHC – Water holding capacity
Table of Contents
Acknowledgments………...i Abstract………..ii Resumo……….iii Abbreviations………vi Table of Contents………..ix List of Figures………...xi List of Tables………xv 1. State of art 1.1. Aims of the work……….11.2. State of the aquaculture worldwide……….1
1.3. Fish quality and welfare………..4
1.4. Food allergies………..7
1.5. IgE-mediated food allergies………9
1.6. Fish allergies……….12
1.7. Fish parvalbumins……….13
1.8. Gilthead sea bream (Sparus aurata): biology, production and allergenic potential………16
1.9. β-Parvalbumins detection: immunochemical methods vs proteomics………..18
2. Materials and Methods 2.1. Fish and rearing conditions………...26
2.2. Sampling………26
2.3. Zootechnical characterization………...27
2.4. Biochemical characterization of fish muscle 2.4.1. pH………...28 2.4.2. Rigor mortis………28 2.4.3. WHC………...28 2.4.4. Texture………...29 2.4.5. Sensorial analysis………...29 2.4.6. Statistical analysis………..29
2.5. Parvalbumin quantification – ELISA method………...30
2.7. Proteomic analysis
2.7.1. Protein extraction………...31
2.7.2. Protein labelling for 2D-DIGE………...31
2.7.3. Protein separation by 2D electrophoresis………...32
2.7.4. Gel image acquisition, analysis and statistics………32
2.7.5. Protein identification………..33
2.8. Skin-prick tests………..33
2.9. IgE-reactivity to PV with fish-allergic patients’ sera - 1D-PAGE immunodetection 2.9.1. Protein extraction………...34
2.9.2. Evaluation of sera’s IgE-reactivity from fish-allergic patients……..35
2.9.3. Clean-up of protein extracts………...36
2.9.4. Protein labelling……….36
2.9.5. Protein separation by 2D gels – multiplexing………36
3. Results 3.1. Zootechnical characterization………...39
3.2. ELISA assays – parvalbumin and cortisol quantification……….40
3.3. pH………..41
3.4. Rigor mortis………...42
3.5. WHC………..42
3.6. Texture and sensorial analysis………...43
3.7. Skin-prick tests………..45
3.8. Immunoblot………...46
3.9. Multiplexing 2D-gels………47
3.10. Proteomic analysis………...48
4. Discussion………....53
5. Conclusions and future perspectives………67
6. References………....69
List of figures
Figure 1.1. World’s fish production by the fisheries and aquaculture industry, in million tones (Adapted from: FAO 2014)…………...………2 Figure 1.2. World and Europe’s fish production by the fisheries and aquaculture industry, in million tones, and the contribution of the aquaculture industry for these numbers (Adapted from: FAO 2014)………2 Figure 1.3. External deficit of fishery products in Portugal, in million tonnes. The aquaculture production is not sufficient to make this balance positive since Portugal is a country with high fish consumption per capita (Adapted from: PEA 2014-2020)………....3 Figure 1.4. Evolution of rigor mortis. A- Pre-rigor mortis; B – rigor mortis. (Adapted from: Diouf & Rioux 1999)………...5 Figure 1.5. Internal organization of a skeletal muscle fiber (Adapted from: Martini et al. 2012)………...6 Figure 1.6. Different types of stressors able to induce different physiological responses to stress in fish, grouped as primary, secondary and tertiary responses. Some responses can evoke others, like the grey arrows indicate (Adapted from: Barton 2002)………...7 Figure 1.7. Adverse food reactions according to the European Academy of Allergy and Clinical Immunology (EAACI) classification………9 Figure 1.8. Typical immunological response caused by a food allergen. A food allergen, like the ones present in fish, initiates an IgE-mediated reaction. After the first exposure to the allergen, the recently produced IgE antibodies bind to the mast cells. Upon second exposure, the allergens bind to the sensitized cell inducing it to produce histamine and other mediators responsible for the allergy symptoms (Adapted from DePestel et al. 2008)……….10 Figure 1.9. Conformational epitopes, contrarily to sequential epitopes are destroyed when structural changes in the protein occur during food processing (Adapted from: Sampson 2004)……….11 Figure 1.10. Role of parvalbumin in the promotion of fish muscle relaxation: the protein is responsible for shuttling calcium ions from the TnC to the SR (Adapted from: Arif 2009)……….14
Figure 1.11. Representation of the three-dimensional helix-loop-helix structure of carp parvalbumin. The capital letters indicate the six α-helices and the yellow spheres represent the calcium ions (Adapted from: Arif 2009)………15 Figure 1.12. Photography of a Gilthead sea bream specimen (Adapted from: FAO 2005-2016)………...16 Figure 1.13. Gilthead sea bream production (in tons) by the main producer countries of this fish species (Adapted from: FEAP 2014)………..17 Figure 1.14. Comparison of parvalbumin concentration, in ppm/mg, between the muscle tissue of farmed and wild fish, of different fish species………...18 Figure 1.15. Schematization of the EDTA structure bound to a metal ion (Adapted from: Andreea 2013)………..19 Figure 1.16. Main steps of the ELISA assay (Adapted from Epitomics 2008)……...20 Figure 1.17. Common proteomic workflow for aquaculture studies. Whatever the strategy used in a proteomic study, both of the approaches, top-down and bottom-up have two main features in common: sample preparation and protein identification and characterization, being this last one, the aim of the workflow (Adapted from Rodrigues et al. 2012)……….22 Figure 1.18. Workflow of a 2D-DIGE using minimal labelling technique. The sample proteins are labelled with the dyes Cy3 and Cy5 and the Cy2 is used as internal standard consisting of a pool of all the proteins. The different resultant images are associated with the fluorescence correspondent to each CyDye (Adapted from: Posch 2010)……….23 Figure 1.19. A – Internal working of a MALDI-TOF/TOF mass spectrometer; B – Example of a MALDI-TOF/TOF instrument used for MS/MS. The system is able to identify gel separated proteins by determining accurate masses of tryptic peptides through the fragmentation of a molecular ion of interest, in the collision-induced dissociation (CID), selected in the timed ion selection (TIS) (Adapted from: Applied Biosystems)………..25 Figure 2.1. Tanks 1 and 11, belonging to the conditions Ctrl and EDTA3, respectively, at Ramalhete experimental station………...26 Figure 2.2. Immunodetection procedure. For each fish, sera from 14 patients were tested for IgE-reactivity………..35
Figure 2.3. Serva HPE Blue Horizon flatbed electrophoresis system with the plate, where the gels are placed, and the power supply………37 Figure 2.4. Experiment workflow. Four different dietary conditions were settled with different concentrations of EDTA in the diet. Each condition had 3 tanks randomly sorted, with 25 Gilthead sea bream each, reared under the different conditions previously described. Five fish from each tank were used for sampling: blood and muscle samples were collected and used for the cortisol quantification, and for parvalbumin quantification and proteomic analysis, respectively. Fish from each tank were characterized biochemically by rigor mortis, muscle pH, WHC, texture and sensorial analysis. Skin-prick tests were performed to access the fish allergenic potential………38 Figure 3.1. Growth of gilthead sea bream (Sparus aurata) from the 4 different feeding conditions reared over 98 days. Data points represent the mean of n = 75………..40 Figure 3.2. Parvalbumin levels determined by ELISA assay in muscle samples from gilthead sea bream (Sparus aurata) submitted to the different diet conditions described: control, EDTA3, EDTA5 and EDTA8. Data bars are presented as mean ± SD (n = 4) for each condition. No significant differences were found between conditions (p ≤ 0.05)………..40 Figure 3.3. Cortisol levels determined by ELISA assay in blood samples from gilthead sea bream (Sparus aurata) submitted to the different diet conditions described: control, EDTA3, EDTA5 and EDTA8. Data bars are presented as mean ± SD (n = 12) for each condition. No significant differences were found between conditions (p ≤ 0.05)………...41 Figure 3.4 Post-mortem changes in pH in the muscle of gilthead sea bream (Sparus
aurata) stored in ice during 72h. Data points are the mean of n = 9 for each sampling time.
*P ≤ 0.05 vs. control at 4, 6, 8, 24, 48 and 72h post-mortem………..41 Figure 3.5. Development of rigor mortis during ice storage of gilthead sea bream (Sparus
aurata). Data points are the mean of n = 12 for each sampling time. *P ≤ 0.05 vs. control
at 1h post-mortem……….42 Figure 3.6. Post-mortem changes in liquid loss (A), fat loss (B) and WHC (C) in gilthead sea bream (Sparus aurata) muscle during 24h ice storage. Data are the mean of n = 9 for each sampling time. *P ≤ 0.05 vs. control at 6h post-mortem in fat loss………43
Figure 3.7. Textural parameters of gilthead sea bream (Sparus aurata) muscle after
post-mortem storage on ice. Data bars are presented as mean ± SD (n = 14) for each parameter.
Different letters indicate significant differences among conditions (p ≤ 0.05)………..43 Figure 3.8. Sensory analysis performed on gilthead sea bream (Sparus aurata) fed with the control diet and with the EDTA3% for 98 days. Scores of the attributes are given as absent-very intense. No significant differences were detected between the fish from the two conditions (p ≤ 0.05). A – CTRL, B – EDTA3………...45 Figure 3.9. Coomassie-stained 15% SDS-PAGE gels of gilthead sea bream from control condition (1) and gilthead sea bream from EDTA3% condition (2). M, marker………….46 Figure 3.10. IgE-reactivity of single patient sera (1-14) to gilthead sea bream from control condition (A) and gilthead sea bream from EDTA3% condition (B). Control antibodies (C1-4) were used to detect parvalbumin. M, marker………...47 Figure 3.11. Gilthead sea bream (Sparus aurata) muscle proteome on a 2D Multiplex gel showing differences in expression of certain proteins between the control and EDTA3 conditions. Pink arrows, overlapping of control and EDTA3 gilthead sea bream; Purple arrows, EDTA3 gilthead sea bream……….48 Figure 3.12. Representative 2D gel of muscle from gilthead sea bream (Sparus aurata) on a 12.5% polyacrylamide 2D gel. Circled spots, representing significantly different expressed proteins between the different conditions, were sequenced and identified (Tables 3.3, 3.4 and 3.5)………49 Figure 4.1. Sequence of post-mortem events fish muscle undergoes immediately after slaughtering process, responsible for flesh softening, named tenderization, and dissolution of rigor mortis. In the presence of EDTA, the concentration of free calcium ions is reduced and the further steps (dashed arrows) are delayed or suppressed………58 Figure 4.2. Main myofibrillar proteins forming the muscle fibers of the fish muscle implicated on the process of relaxation and contraction in the skeletal muscle. A - Sarcomere; B – event during muscle relaxation; C – events during muscle contraction………63 Figure 7.1. Poster presented in COST Action 1402: Improving Allergy Risk Assessment Strategy for New Food Proteins, 2nd ImpARAS Conference, September 20-22, Warsaw, Poland………..74
List of tables
Table 1.1. Shrimp most common allergens and their correspondent IgE-binding epitopes……….11 Table 3.1. Growth performance and feed utilization of gilthead sea bream (Sparus aurata) reared for 98 days under different feeding conditions. Values are mean ± SD (n=75)………...39 Table 3.2. Scoring of the skin-prick tests performed in fish-allergic patients concerning the red skin wheal’s diameter……….45 Table 3.3. – Differently expressed (p ≤ 0.05) proteins between gilthead sea bream (Sparus
aurata) from control and EDTA8 conditions identified by MALDI-TOF/TOF MS after
separation by 2D-DIGE. Negative fold changes are down expressed in control. Positive fold changes are up expressed in control……….50 Table 3.4 – Differently expressed (p ≤ 0.05) proteins between gilthead sea bream (Sparus
aurata) from control and EDTA3 conditions identified by MALDI-TOF/TOF MS after
separation by 2D-DIGE. Negative fold changes are down expressed in control. Positive fold changes are up expressed in control……….51 Table 3.5. – Differently expressed (p ≤ 0.05) proteins between gilthead sea bream (Sparus
aurata) from EDTA3 and EDTA8 conditions identified by MALDI-TOF/TOF MS after
separation by 2D-DIGE. Negative fold changes are down expressed in control. Positive fold changes are up expressed in control……….51
1. State of art
1.1. Aims of the work
The main goal of this work is to verify the effect of EDTA on the allergenic potential of farmed gilthead sea bream (Sparus aurata) through six major scientific objectives: 1 – evaluate the effect of EDTA enriched diets (with different concentrations of EDTA) on the activity, structure and expression of the fish β-parvalbumin; 2 – realize a proteomic characterization in order to assess the effect of EDTA on the muscle proteome and identify the differentially expressed proteins; 3- perform a biochemical characterization to verify the effect of EDTA supplementation on the organoleptic properties of the fish muscle; 4 – perform a zootechnical characterization in order to assess the effect of EDTA enriched diets on the fish behaviour and growth performance; 5 – evaluate the allergenic potential of gilthead sea bream fed with EDTA enriched diets through SPTs and finally; 6 – assess the effect of EDTA on the IgE-reactivity of fish-allergic patients’ sera through immunodetection assays.
1.2. State of the aquaculture worldwide
The continuous growth of the world’s global population, which is expected to reach 9.6 billion people in 2050 coupled with the challenge of feeding the world while trying to maintain its natural resources for future generations, leads to an increased food demand, comprising fish. Fish is an extremely nutritious food product and a valuable source of essential AAs, polyunsaturated fatty acids (PUFA) and lipid-soluble vitamins, currently consumed as never before (Kuehn et al. 2014; Lopata & Lehrer 2009; Tsabouri et al. 2012). In 2010, fish represented already 16.7% of the world’s population’s intake of animal protein (FAO 2014). Consequently, this increased consumption of fish from a few decades on, led to a worldwide decline in wild fish stocks and thus to a decreasing in global capture fisheries (Figure 1.1) (Kime et al. 2001; Rodrigues et al. 2012). Aquaculture plays here a significant role, emerging as a solution to meet this high fish demand, providing already almost half of all fish for human consumption (Figure 1.1). In 2012, farmed fish contributed already with 42.2% of the total 158 million tonnes of fish produced, including for non-food purposes (FAO 2014). Aquaculture is also considered, nowadays, the food-producing sector in fastest expansion (Rodrigues et al. 2012).
China leads by far the world’s aquaculture production with estimated values of 43.5 million tonnes of food fish in 2013, of the 70.5 million tonnes registered for the global aquaculture production in the same year (FAO 2014).
Figure 1.1. World’s fish production by the fisheries and aquaculture industry, in million tones (Adapted from: FAO 2014)
Contrarily to the overall growth of the aquaculture production, the aquaculture output in some European countries has been fallen in the last years, contributing to a global decreasing in farmed fish production by the European continent (Figure 1.2). Among these countries are Spain, France and Italy. The main cause for this decline is believed to be the availability of imported fish with lower production costs, leading to a fall, especially in finfish and molluscs production by the mentioned European countries. In 2012, the farmed fish production in Europe contributed with only 4.32% for the world total production being thus the continent with the lowest average annual growth rate in the period of 2000-2012, reaching only 2.9% (FAO 2014).
Figure 1.2. World and Europe’s fish production by the fisheries and aquaculture industry, in million tones, and the contribution of the aquaculture industry for these numbers (Adapted from: FAO 2014)
Portugal offers a great geomorphological advantage for the aquaculture sector since it presents 1187 km of coastline and a huge diversity of species favourable for farming and with great market value. However, it is a very exposed coast to harsh weather conditions making offshore aquaculture an enormous challenge. Great part of the Portuguese aquaculture enterprises and farms are concentrated in the Algarve coast, south of Portugal, with bivalves’ production predominating the output (POP 2007-2013; PEA 2014-2020).
Before the 90’s, the Portuguese aquaculture was uniquely focused on bivalves, mainly clams of the species Ruditapes decussatus and rainbow trout. Only on this decade, marine species like sea bream and sea bass, and recently turbot and sole, started to be produced and commercialized (PEA 2014-2020).
Farmed fish production increased from 4457 tonnes in the early 90’s to 10317 tonnes in 2012, with turbot production representing approximately 4400 tonnes of this amount. Algarve production represents here 5465 tonnes of the national aquaculture production in the same year. Although the increased volume of farmed fish verified in the last decade, this aquaculture production is not sufficient to balance the negative deficit of the fisheries sector, mainly because Portugal is one of the countries in the world with the highest fish consumption, reaching 56,7 kg per capita/year originating high volumes of importation (Figure 1.3) (PEA 2014-2020).
In an European Union (EU) context, Portugal represented in 2011 only 2% of the global aquaculture production (PEA 2014-2020).
Figure 1.3. External deficit of fishery products in Portugal, in million tonnes. The aquaculture production is not sufficient to make this balance positive since Portugal is a country with high fish
consumption per capita (Adapted from: PEA 2014-2020).
-300000 -200000 -100000 0 100000 200000 300000 400000 500000 600000 -232200 -220900 70600 174200 302800 395100 T on n es 2000 2012 Importations Exportations Dificit
1.3. Fish quality and welfare
Farmed fish attempt to become the major source of dietary protein in our society (Kime et al. 2001) and this competition increases the need to store and transport food between places making food preservation a very important step to maintain the nutritional value, texture, flavour, and the highest quality of the fish product (Ghaly et al. 2010; Kolbe
et al. 2006; Schiavone et al. 2008).
The shelf life of a food product consists of the maximum length of time a given product is fit for human consumption, which means that, in the case of fish, it corresponds to the time from when it is taken from the water until is no longer fit to eat (Doyle 1989). Thus, it is of great importance for the aquaculture industry to improve and extend the shelf life of seafood.
After harvesting, a seafood product passes through several stages of spoilage originating multiple compounds and the breakdown of others, responsible for changing odour, flavour and texture of the meat: rigor mortis, dissolution of rigor mortis, enzymatic autolysis, oxidation and microbial growth (Ghaly et al. 2010; Kolbe et al. 2006; Sigholt et
al. 1997). One of the most noticeable events in the post-mortem changes is the rigor mortis
(Figure 1.4) (Dunajski 1979), which corresponds to the process through which fish loses its flexibility due to stiffening of fish muscles after a few hours of its death (Adebowale et al. 2008). Immediately after death, muscle continues to hydrolyse ATP however at a slower rate, since the breakdown of glycogen into lactic acid maintains the levels of this molecule. Once the glycogen stores deplete, the ATP levels falls to zero and the myosin heads strongly attach to the thin filaments, or actin filaments, of the muscle myofibrils (Figure 1.5.) resulting in a rigid and stiff muscle (Offer et al. 1989). Multiple factors affect the rate and resolution of rigor mortis like the species, temperature, handling procedures, size and physical condition of the fish (Huss 1995). Enzymatic autolysis is mainly characterized by a reduction in textural quality, production of hypoxanthine by autolytic enzymes, production of formaldehyde by the degradation of Trimethylamine N-oxide (TMAO) originating Trimethylamine (TMA) and a pH drop, result of glycolysis, which breaks down glycogen originating lactic acid. Oxidation involves lipid oxidation, which is the major cause of deterioration for fish species presenting high fat content being responsible for the common off-flavour known as rancidity. In the last step of deterioration, microbial present in fish microflora and others tend to proliferate producing amines like putrescine,
histamine and cadaverine, ammonia, indole and acids resulting also in an unpleasant flavour and odour (Ghaly et al. 2010).
Figure 1.4. Evolution of rigor mortis. A- Pre-rigor mortis; B – rigor mortis. (Adapted from: Diouf & Rioux 1999)
Multiple factors affect freshness and quality of the fish flesh, like for example, chemical composition, storage temperature, ante-mortem handling, treatments after capture, and others (Dunajski 1979; Sigholt et al. 1997). Handling procedures, for example, increases the stress levels of the fish, causing an increased muscle activity and the release of cortisol, consequently reducing tissue water content (Sigholt et al. 1997). Fish muscle consists of 80% of fat and water, and, depending on the flesh properties and handling procedures, the muscle may lose or gain water, which for the market is very important since fish is sold by weight (Ofstad et al. 1996). Water holding capacity (WHC) of the muscle decreases with time in dead fish since post-mortem fish muscle sarcolemma, the plasma membrane surrounding the sarcoplasm, or the cytoplasm of a muscle fiber (Figure 1.5) (Martini et al. 2012), separates from the myofibrils and no longer traps water in between. WHC is therefore strongly influenced by structural changes in proteins, which are also strongly influenced by temperature, ionic strength and pH (Nordic Council of Ministers 1995; Ofstad et al. 1996). Evaluating the WHC will thus indicate the state of denaturation of the muscle proteins.
A
Figure 1.5. Internal organization of a skeletal muscle fiber (Adapted from: Martini et al. 2012)
Fish welfare is mainly evaluated through the stress status of the fish and the resultant stress physiological responses (Barton 2002). This is of great interest for the aquaculture industry since growth and reproductive performances, health status and diseases susceptibility are strictly related to stress conditions (Alves et al. 2010). As mentioned above, handling procedures can increase stress levels, but other stressors like chemical and perceived stressors can also evoke physiological responses (Figure 1.6), which are a mechanism of the fish to maintain its normal homeostatic state. These are grouped as primary, secondary and tertiary responses. Primary responses involve the release of corticosteroid and catecholamine hormones into circulation. Cortisol is the main corticosteroid present in actinopterygian fish and, therefore, its circulating level is commonly used as an indicator of the stress level of the fish. Secondary responses include metabolic changes and expression of heat-shock proteins (HSPs). Finally, tertiary responses include changes in growth and behaviour, for example (Barton 2002).
Based on the changes occurring in fish during its process of quality loss and in previous studies it is possible to affirm that it is of great importance for the market to evaluate fish shelf life through tests like muscle pH, WHC, rigor mortis, flesh firmness, sensory analysis among others (Aman 1983; Özogul et al. 2005; Özogul et al. 2006; Özyurt et al. 2009).
Figure 1.6. Different types of stressors able to induce different physiological responses to stress in fish, grouped as primary, secondary and tertiary responses. Some responses can evoke others, like the grey arrows
indicate (Adapted from: Barton 2002)
1.4. Food allergies
Producing fish under strict controlled conditions and the possibility of manipulate an ideal product are two of the greatest advantages of the aquaculture against fisheries to fulfil the population’s huge and rising demand for fish. However, as well as several food sources, fish, being these wild or farmed, is one of the most common elicitors of food allergies. This increased consumption of fish has resulted in more frequent reports of these adverse reactions leading to the need of understanding the reasons for the persistence of this allergy (Tsabouri et al. 2012). Previous studies on how farming practices can help modulating fish allergenicity are little or practically inexistent.
Food allergies have become, in the last several decades, an important public health concern with a continuously increasing prevalence, without any cure known (Burks et al. 2012; Kulis et al. 2015), and it’s now considered a worldwide problem in westernized nations (Sampson 2004). Food allergy can be defined simply as an adverse health effect derived from an immune response directed toward food (Burks et al. 2012; Flanagan 2014; Kulis et al. 2015). More than 170 foods have already been reported as potentially allergenic and among these, considered the most common ones, are peanuts, tree nuts, eggs, milk, fish, crustacean shellfish, wheat and soy (Burks et al. 2012; Flanagan 2014). Food allergies can appear in childhood and outgrow, persist through adulthood, named de
novo sensitization, or appear only in adulthood (Burks et al. 2012). Allergies to milk, soy,
egg and wheat, normally resolve around school age in children, contrarily to peanut and seafood allergies that are usually permanent (Longo et al. 2013; Sicherer & Sampson 2006; Valenta et al. 2015).
Food allergenicity is mediated by specific proteins, named food allergens able to trigger specific immunologic reactions, which are initiated by allergen-specific immune cells (Burks et al. 2012; Flanagan 2014; Kulis et al. 2015). Reactions can occur when ingesting food, either raw or cooked, considered class 1 food allergy, or simply by inhaling the food allergens, which are called aeroallergens, recognized in this case as class 2 food allergy (Burks et al. 2012; Sicherer & Sampson 2006). The major group of food allergens are the class 1 allergens characterized by water-soluble glycoproteins, relatively small (normally with 10-70 kDa) and very stable to thermal, acidic and proteolytic denaturation. Includes proteins like the caseins from milk, ovomucoid from eggs, and β -parvalbumins
from fish. Bet v 1 from birch pollen is an example of a class 2 allergen that is able to induce sensitization through the respiratory route. A food may also have numerous homologous allergens sharing cross-reactivity between them, capable of inducing different immunological responses. Cooking food, like heating it, may reduce or enhance their allergenicity, depending on the allergen structure (Sicherer & Sampson 2006).
Adverse reactions to food are classified based on the pathogenetic mechanism (Figure 1.7). Toxic food reactions are a result of small contaminants, named toxins that can be naturally present in food or incorporated by food processing, for example. These molecules have an effect on all individuals who eat contaminated food. Contrarily to it, non-toxic food reactions occur with food that is not tolerated by only a few individuals. It can be sub-divided into immunological responses (food allergy) and non-immunological responses (food intolerance). Food intolerance can also be sub-divided into enzymatic and pharmacological food intolerance. First one includes lactose intolerance, the most common case, characterized by a deficiency on the β-galactosidase levels, the enzyme responsible
for the hydrolysis of lactose. The second one is caused by vasoactive amines present in foods, like histamine and dopamine (Ortolani & Pastorello 2006). Among the so-called food allergies it is possible to distinguish two kinds of responses: IgE-mediated (e.g. milk, eggs and fish) and non-IgE mediated ones (e.g. gluten intolerance) (Flanagan 2014; Kulis
et al. 2015; Ortolani & Pastorello 2006). The most common reaction, result of a non-IgE
(Ortolani & Pastorello 2006). According to Valenta et al. (2015), the most common type among food allergies are the IgE-mediated ones, affecting approximately 1-3% of the world’s population.
Figure 1.7. Adverse food reactions according to the European Academy of Allergy and Clinical Immunology (EAACI) classification
1.5. IgE-mediated food allergies
The term “IgE” refers to Immunoglobulin E, a type of antibody found only in mammals. When a food allergen-specific IgE enters the blood circulation (Figure 1.8) and is recognized by a B cell, it will produce antibodies IgE against it and, upon further exposure of any allergenic protein of the same kind, these antibodies are induced and bind onto high-affinity IgE FcεRI receptors present on mast cells, basophils and cells of the mucosa and skin (Flanagan 2014; Kulis et al. 2015). The activation of these cells requires cross-linking of IgE receptors with the allergen, thus, more than two IgE molecules need to be bound to one single allergen (Matsuo et al. 2015). This will cause degranulation and release of chemical mediators, such as histamine, responsible for causing the characteristic symptoms of allergy (Flanagan 2014; Kulis et al. 2015). An immediate reaction takes place a few minutes after contact with the allergen followed by a late-phase response that begins
ADVERSE FOOD REACTIONS Non toxic Immune Mediated (Food allergy)
IgE mediated mediated Non IgE
Non Immune Mediated
(Food
Intolerance)
Enzymatic Pharmaclogical Undefined
4-6 hours after the contact and continues for several days (Ortolani & Pastorello 2006). This is the chain of reactions that happens with fish allergens.
Figure 1.8. Typical immunological response caused by a food allergen. A food allergen, like the ones present in fish, initiates an IgE-mediated reaction. After the first exposure to the allergen, the recently produced IgE antibodies bind to the mast cells. Upon second exposure, the allergens bind to the sensitized cell inducing it to produce histamine and other mediators responsible for the allergy symptoms (Adapted from DePestel et al.
2008).
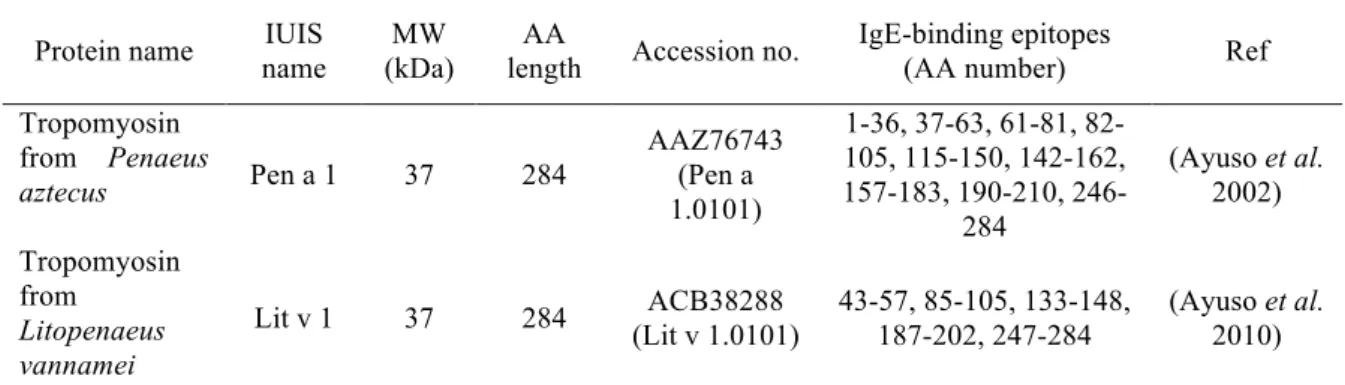
IgE antibodies bind to specific recognition sites in allergens, called IgE-binding epitopes (Figure 1.9), responsible for the allergenicity of the allergen. These can be divided into linear (sequential) and conformational (discontinuous) epitopes. First ones are characterized by continuous amino acid (AA) sequences, while the second ones by spatially adjacent AAs, distantly located in the AA primary sequence of the allergen. Improving the knowledge about the epitope structures of an allergen can contribute to a more accurate diagnosis and possibly for the development of hypoallergenic foods. Some epitopes have already been well mapped and characterized, like the ones from allergen molecules belonging to chicken eggs, cow’s milk, wheat and shrimp. Studies on shrimp allergens are the most developed among seafood allergies and tropomyosin is the main allergen present (Table 1.1). Crustacean-allergic patients can show cross-reactivity among different types of shellfish since tropomyosins among crustaceans share around 98% of homology (Matsuo et al. 2015). Cross-reactivity is therefore characterized by the phenomenon when IgE antibodies recognize similar epitopes in an allergen to the ones they were originally directed at in another allergen (Ortolani & Pastorello 2006). This phenomenon can be caused when allergens share at least 50-70% of sequence identity and
it was already observed among various fish species and edible frog species (Ma et al. 2008). Table 1.1 shows an example of similarity between epitopes from two different isoforms of tropomyosin.
Both sequential and conformational epitopes are evidently responsible for allergic reactions, however, people presenting IgE antibodies against sequential epitopes react to food in any form, cooked or raw, while people with IgE antibodies against conformational epitopes are able to tolerate small amounts of cooked or hydrolysed food, since this processing induces structural changes in the proteins and conformational epitopes are destroyed (Sampson 2004).
Table 1.1. Shrimp most common allergens and their correspondent IgE-binding epitopes
Protein name IUIS
name
MW (kDa)
AA
length Accession no.
IgE-binding epitopes
(AA number) Ref
Tropomyosin from Penaeus aztecus Pen a 1 37 284 AAZ76743 (Pen a 1.0101) 1-36, 37-63, 61-81, 82-105, 115-150, 142-162, 157-183, 190-210, 246-284 (Ayuso et al. 2002) Tropomyosin from Litopenaeus vannamei Lit v 1 37 284 ACB38288 (Lit v 1.0101) 43-57, 85-105, 133-148, 187-202, 247-284 (Ayuso et al. 2010)
Figure 1.9. Conformational epitopes, contrarily to sequential epitopes are destroyed when structural changes in the protein occur during food processing (Adapted from: Sampson 2004).
Multiple in vivo and in vitro assays can be performed to assess the IgE-reactivity of food allergens (Velickovic & Gavrovic-Jankulovic 2014). In in vivo detection the most common tests are the SPTs that basically consists of puncturing the skin with a small food sample (Griesmeier 2009). The test is applied on the forearm and, after 15-20min, if the
person is sensitized it will develop a red swelling were the allergen was applied (Heinzerling et al. 2013). This is mainly used as a first test to confirm or refute allergic reactions since it’s not very specific, especially for fish allergy, because patients seem to demonstrate monosensitivity to specific species (Sharp & Lopata 2014). A positive skin-prick test merely indicates that the patient has been sensitized to a particular food (Lee & Burks 2006). One of the advantages of this method is that multiple different allergens can be tested simultaneously since the consequential reaction appears right of the area of the SPT (Heinzerling et al. 2013). In vitro tests include the measurement of serum-specific IgE using several types of quantitative immunoassays like for example radioalergosorbent test (RAST) and enzyme-linked immunosorbent assay (ELISA), or immunoblots performed with sera from fish-allergic patients.
1.6. Fish allergies
As stated above, the increased production and consumption of fish have led to constant reports of adverse health problems, and, in western countries like Portugal and Spain where the consumption of seafood is high, coastal countries, and countries with high number of fish-processing industries, it is one of the most common food allergens (Kuehn
et al. 2014; Tsabouri et al. 2012). Fish are capable of inducing IgE-mediated allergic
reactions and prevalence rates vary considerably according to the region. In general seafood allergy affects up to 5% of all children and 2% of all adults (Sharp & Lopata 2014). However the actual prevalence of fish allergies is still not well established but it is estimated that corresponds approximately between 0.2-2.29% of the general population (Kuehn et al. 2014; Sharp & Lopata 2014). Fish allergy can be manifested in a variety of symptoms, from mild to severe reactions, comprising urticaria, allergic contact dermatitis, diarrhea or anaphylaxis (Van Do et al. 2005).
Cross-reactivity among fish species has been repeatedly reported and seems to be even more frequent between closely related fish (Kuehn et al. 2014). The study of Van Do
et al. (2005) describes the cross-reactivity of allergens from 9 commonly consumed fish
and stated that cod, salmon, pollack, herring and wolf-fish contained the most potent cross-reacting fish allergens (parvalbumins in this case), whereas halibut, flounder, tuna and mackerel were the least allergenic. This also explains why allergic people exhibit the same symptoms upon contact with different fish species (Swoboda et al. 2002). Contrarily to
these evidences few fish-allergic patients are able to tolerate certain fish species, such as tuna. Monosensitivity to a single fish has also been reported for sole, swordfish, pangasius, tuna and more recently for salmon and salmonid fish (Kuehn et al. 2014, Ma et al. 2008).
1.7. Fish parvalbumins
Several fish allergens have been identified during the last decades: enolases, aldolases, gelatin, vitellogenin and parvalbumins. Multiple studies have identified parvalbumins as the major cross-reactive allergens in multiple fish species and these have been so far, the most well characterized fish allergens (Bugajska-Schretter et al. 2000; Kuehn et al. 2014; Lopata & Lehrer 2009). The first analysis performed to fish allergens was in Baltic cod (Gadus callarias), identifying Gad c 1, a parvalbumin, as the major codfish allergen (Elsayed & Bennich 1975). Thus, this is usually used as reference to which other fish allergens are related (Van Do et al. 2005). The allergenicity of parvalbumins has been studied in the last few years in different fish species and by 2012, the allergome database (www.allergome.org) had already 218 allergenic isoforms of fish parvalbumins inserted (Velickovic & Gavrovic-Jankulovic 2014).
Parvalbumins are low molecular-weight proteins (10-12 kDa) belonging to a group of acidic (pI = 4.0-5.2), water-soluble, Ca2+-transporting muscle proteins responsible for promoting relaxation in the fast-twitch muscle fibres (Bugajska-Schretter et al. 2000, Lee
et al. 2012; Lopata & Lehrer 2009; Van Do et al. 2005; Velickovic & Gavrovic-Jankulovic
2014). According to Coughlin et al. (2007), higher amounts of parvalbumin are associated with faster rates of relaxation. The contraction-relaxation cycle of vertebrate muscles is promoted by the exchange of Ca2+ between the sarcoplasmic reticulum (SR) and the myofibrils, while relaxation is achieved by the return of Ca2+ from myofibrils back to the SR. In fast-twitch muscle fibres, parvalbumins facilitate the muscle relaxation by carrying the calcium from troponin-C (TnC), a subunit of the regulatory protein troponin, back to the SR (Figure 1.10) (Arif 2009). Bony fish muscle is composed by two types of tissues, the light and the dark muscle differing in their function and composition (Kuehn et al. 2014). Kobayashi et al. (2016) affirms that parvalbumin content varies by muscle parts, presenting the highest levels in white muscle and the lowest in dark muscle. Tuna is therefore considered less allergenic since its flesh is mainly composed by dark muscle of low parvalbumins’ expression (Lim et al. 2005). Physical and chemical effects of food
processing techniques may also alter the fish allergenicity through parvalbumin degradation or oligomerization, which causes a decrease or an increase in the number of IgE-binding epitopes (Sletten et al. 2010).
Figure 1.10. Role of parvalbumin in the promotion of fish muscle relaxation: the protein is responsible for shuttling calcium ions from the TnC to the SR (Adapted from: Arif 2009)
Parvalbumins are included on a family of proteins named EF-hand proteins. The three-dimensional (3D) structure of fish parvalbumin reveals six α-helices named A, B, C, D, E and F arranged in three homologous domains, AB, CD and EF, consisting each one of two helices interspaced by one loop (Figure 1.11). This makes the three EF-hand motifs, characteristic of this family of proteins, capable of chelating one divalent metal ion each, like calcium and magnesium (Arif 2009; Elsayed & Apold 1983; Kuehn et al. 2014). Only two of these motifs are functional, the CD and de EF domains, and able to bind to the metal ions (Bugajska-Schretter et al. 1999). The first motif, AB, the non-functional one, forms a cap covering the hydrophobic surface of the pair of functional domains (Swoboda
Figure 1.11. Representation of the three-dimensional helix-loop-helix structure of carp parvalbumin. The capital letters indicate the six α-helices and the yellow spheres represent the calcium ions (Adapted from:
Arif 2009)
Parvalbumins can be sub-divided into two distinct phylogenetic lineages, the alpha (α) and the beta (β), which differ in their isoelectric point (pIα > 5.0, pIβ < 4.5), molecular
weight and in other characteristics of the primary structure of the protein (Bugajska-Schretter et al. 2000; Kuehn et al. 2014; Lopata & Lehrer 2009; Van Do et al. 2005). They also differ in their affinity for metal ions: β-parvalbumin has 16% greater affinity for Mg2+ but an about 200% greater affinity for Ca2+ compared to its α homologous (Arif 2009). In
amphibian tissues, both parvalbumins subtypes have been detected whereas in mammalian and avian muscles only α-parvalbumin was reported (Kuehn et al. 2014). In bony fish muscle it is the β-parvalbumin that can be found, contrarily to cartilaginous fish muscle that expresses exclusively α-parvalbumin (Goodman et al. 1979). However, only fish β-parvalbumins were considered so far a cross-reactive food allergen, presenting stability to thermal, chemical and proteolytic denaturation (Bugajska-Schretter et al. 2000; Hilger et
al. 2004; Lopata & Lehrer 2009; Van Do et al. 2005). The same fish usually expresses two
or more different β-parvalbumin isoforms, differing in the amino acid sequence and in their allergenicity, as in the case of salmon (β1 and β2), which is related to the IgE-binding epitopes (Kuehn et al. 2014; Velickovic & Gavrovic-Jankulovic 2014). Salmon isoforms β1 and β2 have more than 64% identity. This influences the reaction of one fish-allergic patient, who can react more to one isoform than to another, explaining the challenge of diagnosing a fish allergy (Velickovic & Gavrovic-Jankulovic 2014).
Several studies show a global rearrangement of the protein upon the depletion of calcium from the functional sites, promoting its apoform, named apo-parvalbumin. Helices A, B and F remain practically unchanged in their position, but C, D and E helices undergo substantial reorientation (Henzl & Tanner 2007). This apo-parvalbumin, which is
calcium-depleted, presents a substantial reduction of IgE binding from fish-allergic patients suggesting thus a reduction of the allergenic potential of the protein under this form (Bugajska-Schretter et al. 2000; Hamada et al. 2003; Kuehn et al. 2014; Swoboda et al. 2007; Perez-Gordo et al. 2013). Bugajska-Schretter et al. (1998), also observed a reduction of IgE antibodies bound to parvalbumin after Ca2+ depletion. This suggests that the IgE-binding epitopes of the fish β-parvalbumins are of the conformational type.
Additionally, studies based on the molecular dynamics and structure of the parvalbumin, suggest that the functional EF-hand loops do not exhibit the same binding properties when separated from their protein environment (Cates et al. 2002). As mentioned above, parvalbumin can bind to two Ca2+, with high affinity, but it can also bind to Mg2+ with moderate affinity (Allouche et al. 1999; Johnson et al. 1999). Allouche et al. (1999) stated that, in the presence of Mg2+ in the environment, the affinity of Ca2+ to both binding sites is lower than if there was no competitor. Johnson et al. (1999) also affirms that apo-parvalbumin can rapidly bind to Ca2+, contrarily to Mg-parvalbumin which is not
able until Mg2+ dissociates. Thus, this emphasizes that a change in the environment surrounding the β-parvalbumin, like for example, in order to increase competition for the binding sites, or for the calcium, will promote its apoform, a potentially less allergenic form of parvalbumin.
1.8. Gilthead sea bream (Sparus aurata): biology, production and
allergenic potential
Gilthead sea bream, Sparus aurata (Linnaeus, 1758) (Figure 1.12), is a high valuable fish for aquaculture industry, widely cultured in the Mediterranean region and constitutes an interesting animal model for research (Calduch-Giner et al. 2013).
Figure 1.12. Photography of a gilthead sea bream specimen (Adapted from: FAO 2005-2016)
Belonging to the Sparidae family it can reach up to 70 cm long and weight 10 kg. It is commonly found throughout the Mediterranean sea and along the Eastern Atlantic
coasts, from the United Kingdom to the Canary Islands (Fischer et al. 1987). It can live in marine waters as well as in the brackish waters of coastal lagoons. It commonly inhabits rocky or sandy bottoms, but can be also seen in seagrass beds. During the spawning period, between October and December, adults migrate into deeper waters (until 150 m depth). It is a hermaphrodite species, maturing for the first and second year of life as a male and then throughout the second or third year as a female. It feeds on molluscs, crustaceans and small fish (Fischer et al. 1987; Pavlidis & Mylonas 2011).
Sea bream was successfully reproduced for the first time in captivity in the 1980s and since then intensive rearing systems (sea cages) started to be developed, becoming this species, one of the main products of European aquaculture, with Greece leading the production (Figure 1.13). Nowadays, most of the sea bream production comes from juveniles already produced in hatcheries. This species reaches commercial size usually after one and a half years (Pavlidis & Mylonas 2011).
Figure 1.13. Gilthead sea bream production (in tons) by the main producer countries of this fish species (Adapted from: FEAP 2014)
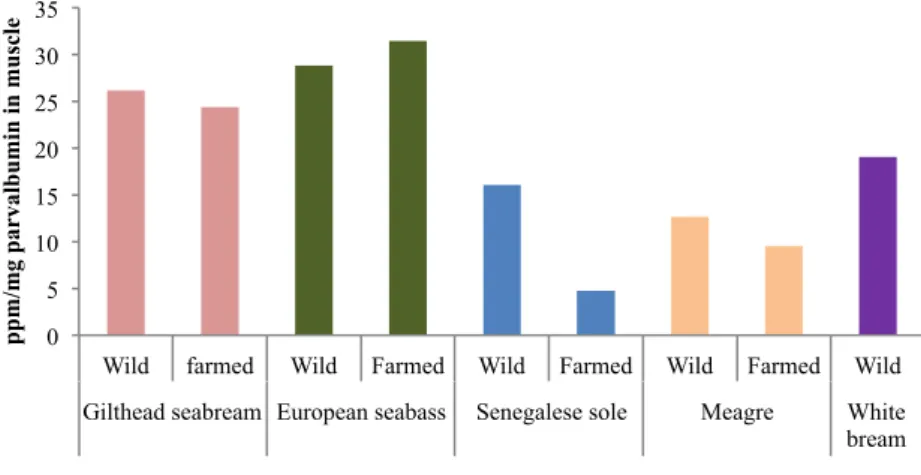
Skeletal muscle is the largest organ system in fish representing, in commercially sized gilthead sea bream, around 34.3-48% of the total body weight (Grigorakis & Alexis 2005; Testi et al. 2006). Several types of proteins, with several different functions, encompassing myosin, transferrin, enolase, tropomyosin, parvalbumin, among others, constitute fish muscle tissue (Addis et al. 2010). Muscle parvalbumins’ content, as referred above, can be assessed in order to evaluate the fish allergenic potential and thus, an ELISA assay performed prior to this experiment, aiming to compare the parvalbumin concentration in the muscle of different fish species, identified gilthead sea bream as the
second most allergenic species, either in farmed or wild fish (Figure 1.14). Giving this data, along with the high commercial value of this species and the high availability of it, gilthead sea bream was the species selected for the present study.
Figure 1.14. Comparison of parvalbumin concentration, in ppm/mg, between the muscle tissue of farmed and wild fish, of different fish species
1.9. EDTA as a competitor to β-parvalbumin
Based on these studies, it’s possible to affirm that the most effective way of changing the ionic environment of a fish muscle tissue and thus try to promote the β-parvalbumin apoform, is through a formulated diet. This is how aquaculture and its possibility of controlling fish farming conditions appear here as an important tool to try to modulate the allergenicity of cultivated aquatic species.
EDTA is a compound with numerous utilities that can chelate Ca2+ and Mg2+, although with a higher affinity to calcium. Upon complex formation, meaning the binding of the metal ion, both nitrogen ions and four carboxylate oxygen ions bind to it and curl up to envelop the metal ion (Figure 1.15) acquiring, the chelator, an increased rigidity (Moeschler et al. 1980). EDTA was found to be a promisor compound to induce the potentially less allergenic form of parvalbumin, the apo-parvalbumin, since Johnson et al. (1999) discovered that intracellular EDTA mimics the major fish allergen in the promotion of muscle relaxation. Johnson et al. (1999) proved that EDTA can be used as an “artificial” parvalbumin since it can assume practically all its tasks, like for example, its Ca2+ and
Mg2+ dissociation rates are identical and its behaviour in sequestering Ca2+ while in
Mg-bind form is practically the same. Alpod & Elsayed 1979 (1983), in studies with Gad c 1, reported a decrease of approximately 30% of IgE bound to the allergen, devoid of Ca2+, in
0 5 10 15 20 25 30 35
Wild farmed Wild Farmed Wild Farmed Wild Farmed Wild
Gilthead seabream European seabass Senegalese sole Meagre White bream p p m/ mg p ar val b u mi n in mu sc le