A high-throughput behavioral paradigm
for
Drosophila olfaction - The Flywalk
Kathrin Steck
1, Daniel Veit
1, Ronald Grandy
1, Sergi Bermu´dez i Badia
2, Zenon Mathews
3, Paul Verschure
3,
Bill S. Hansson
1*
& Markus Knaden
1*
1Max Planck Institute for Chemical Ecology, Jena, Germany,2Madeira Interactive Technologies Institute, University of Madeira -Carnegie Mellon j Portugal - Madeira Tecnopolo, 9020-105 Funchal, Portugal,3Laboratory of Synthetic Perceptive, Emotive and Cognitive Systems, ICREA-UPF, Barcelona, Spain.
How can odor-guided behavior of numerous individual
Drosophila be assessed automatically with high
temporal resolution? For this purpose we introduce the automatic integrated tracking and odor-delivery
system
Flywalk. In fifteen aligned small wind tunnels individual flies are exposed to repeated odor pulses,
well defined in concentration and timing. The flies’ positions are visually tracked, which allows
quantification of the odor-evoked walking behavior with high temporal resolution of up to 100 ms. As a
demonstration of
Flywalk we show that the flies’ behavior is odorant-specific; attractive odors elicit directed
upwind movements, while repellent odors evoke decreased activity, followed by downwind movements.
These changes in behavior differ between sexes. Furthermore our findings show that flies can evaluate the
sex of a conspecific and males can determine a female’s mating status based on olfactory cues. Consequently,
Flywalk allows automatic screening of individual flies for their olfactory preference and sensitivity.
T
he vinegar fly Drosophila melanogaster has become a model organism for olfaction mainly due to the
impressive genetic toolbox available, which enables us to manipulate the neuronal architecture of the
olfactory system. These manipulations help to understand how odorants are detected by the peripheral
olfactory sensory system
1,2and how information is further processed in the first olfactory processing centre, the
antennal lobes
3–6. While neurophysiological characteristics can be precisely quantified (e.g. spike frequency of a
specific neuron or activity changes within a set of glomeruli of the antennal lobe), quantification of
odorant-induced behavioral changes in Drosophila still leaves much to be desired. Up to now the effect of minute changes
deriving from genetic manipulations of the fly’s sensory system were discovered rather by elaborate
neurophy-siological measurements than in quantitative behavioral assays. In order to compensate for the high variability of
behavioral data an ideal bioassay would require the synchronized observation of many individual flies and their
responses to repeated stimuli well-defined in quality, quantity, and stimulus on- and off-set. In addition, to
correlate behavioral and physiological data, stimulus presentation during behavioral and physiological
experi-ments should be similar, i.e. short pulses followed by prolonged pauses of clean air. At present olfactory driven fly
behavior is mostly investigated in mass experiments, as trap assays
7and T-mazes
8, in which large groups of flies are
asked to choose between one odorant and a control. Both bioassays use continuous olfactory stimulation rather
than odor pulses, which precludes any evaluation of olfactory response latencies. Furthermore, continuous
olfact-ory stimulation might cause adaptation of the flies’ sensolfact-ory system to an odor, and thus make any evaluation of
olfactory sensitivity difficult. Moreover, this approach is ecologically invalid as most odor driven behavior occurs
in turbulent plumes. Finally, olfactory behavior in mass experiments is quantified by the fraction of responding
flies. Hence, these experiments reveal the olfactory preferences of the plurality and not of individual flies.
Experiments with individual flies have been conducted in 2- and 4-way olfactometers
5,9,10, in arenas with
stationary air and flowing air conditions
11, in wind tunnels
12, and in a tethered-fly paradigm
13–15. Notably, the
2-way olfactometer experiment
10allows testing numerous individual flies simultaneously while investigation of
latency and strength of the flies’ olfactory responses is disregarded. By using two different arena setups Keller and
Vosshall
11screened behavior of individual flies with 73 different odorants. Measuring the activity change of the
flies after stimulus arrival allowed identifying odorants that were detected by the flies. However, the hedonic
valence of the odorants could not be assessed. Contrary to the other experiments mentioned, the wind tunnel
12and the tethered-fly experiment
13–15allow for the assessment of response latency and sensitivity. However, these
setups are designed for single flies and in order to gain meaningful sample sizes the experiments need to be
repeated many times.
SUBJECT AREAS:
ANIMAL BEHAVIOUR BEHAVIOUR BIOLOGICAL MODELS SENSORY SYSTEMSReceived
30 January 2012
Accepted
23 March 2012
Published
17 April 2012
Correspondence and requests for materials should be addressed to M.K. (mknaden@ice. mpg.de)*authors share senior authorship.
To remedy the shortcomings of presently used vinegar fly
bioas-says, we developed the Flywalk, a novel high-throughput paradigm
for studying odorant-evoked behavior in walking Drosophila. The
communication between the tracking system and the odor-delivery
system allows using the Flywalk as an open-loop paradigm as
described in the present work, with information being sent from
the odor-delivery system to the tracking system. In addition the
Flywalk can be programmed to meet demands of a closed-loop
sys-tem, where the behavior of the flies triggers the onset of the
odor-delivery system (i.e. whenever all flies, or a given percentage of the
flies are motionless, an odor stimulus is delivered). In the current
version of the system we track 15 freely walking flies simultaneously
in parallel small-sized wind tunnels (length, 18 cm; inner diameter,
0.8 cm; constant air flow of 18 cm/s) (Fig. 1). Each of the flies is
exposed to identical odorant pulses, well-defined in quality, quantity
and stimulus duration (for characterization of the odor stimulus see
Fig. 2 and Supplementary Information online, for description of the
stimulus device see
16). Communication between the stimulus
deliv-ery system and the automated tracking system allows calculation of
the exact time of the encounter between the stimulus and fly (i.e. the
meeting time, based on wind speed, stimulus onset and position of
the fly within the tube). This calculation enables detailed analysis of
the behavior of individual flies before, during and after odor
stimu-lation. A total of eight different odorant stimuli can be presented
repeatedly and the sequence of these is randomized with a stimulus
interval of 90 sec. This representative protocol results in an
experi-mental session that lasts for eight hours during which all 15 flies are
exposed in parallel to 40 stimulations per odorant, and allows for an
analysis of the response of each individual fly as well as the summed
responses of a group of flies to an odor, further referred to as the sum
response. The analysis presented here of the responses of individual
flies and of sum responses of numerous flies revealed odorant- and
concentration-specific changes in the flies’ undirected activity and
directed up- or downwind movements. Hence, the Flywalk bioassay
for the first time allows screening of large numbers of individual flies
for their odorant preferences, olfactory sensitivities, and response
latencies in an ecologically valid way.
As a demonstration of the properties of Flywalk we show that:
.
fly responses are odorant specific, i.e. stimulation with different
odors results in different patterns of directed up- or downwind
movements (i.e. attraction or repellence) and/or changes in
undirected activity.
.
odor responses are sex specific, i.e. responses of female and male
flies differ in strength and duration to food-related odors and to
the Drosophila pheromone cis-vaccenyl acetate , while both sexes
respond similarly to repellent odorants.
.
Orco mutant flies (lacking most functional olfactory receptors)
respond to some odorants with a change in activity but show no
directed movements, i.e. attraction or repellence.
.
volatile cues are sufficient for male flies to evaluate sex and mating
status of female conspecifics.
Results
A representative experimental session lasted for up to eight hours,
with flies being repeatedly exposed to short odorant pulses (for
detailed description of odor delivery, see Methods section). During
the time between the pulses, the flies could move freely and
redistribute. The point in time when an odor pulse met a fly (meeting
time) could be determined based on the combined knowledge of
Figure 1
|
Experimental setup. 15 flies are individually exposed within glass tubes to a continuous air flow (speed, 18 cm/s; temperature, 25uC; humidity, 70%) and are automatically tracked. A computer-controlled stimulus system produces olfactory stimuli, which are transported by the air flow via a split-up board to the flies. The stimulus system communicates on- and off-set to the tracking system. Digital flow meters after each glass tube guarantee that airflow and, hence, stimulus movement are controlled and identical in all tubes. Based on position of the flies within the tubes and knowledge about stimulus timing and speed, the tracking system calculates each fly’s responses to up to eight different olfactory stimuli with a temporal resolution of 100 ms. A photo ionization detector (PID) plugged into an additional tube checks reliability of the stimulus device. Red rectangle, retroillumination (.630 nm) provided by electroluminescent foil to preclude visual cues. Flies positioned close to the tube ends, i.e. out of region of interest (ROI, open blue rectangle), are not tracked.stimulus onset, wind speed, and the actual position of each fly. (For a
detailed analysis of stimulus characteristics and timing by means of
measurements with a photo ionization detector and
electroantenno-gram recordings within the tubes see Fig. 2 and Supplementary
Information online). Based on the recorded actual positions of
the flies and with the help of a MATLAB routine (The Mathworks,
Natick, USA) the walking speed was calculated between 3 s before
and 7 s after the meeting time (Fig. 3a).
Flies typically remained motionless or moved randomly during
the pre-odor period (Fig. 3a). Also, flies did not change their
move-ments upon meeting with pulses of the solvent control (Fig. 3a,
min-eral oil). However, after meeting pulses of ethyl acetate, a known
attractant, flies exhibited increased upwind speed (blue squares in
Fig. 3a). On the other hand, pulses of benzaldehyde, which has been
described as a repellent
17, evoked mainly downwind movements (red
squares in Fig. 3a). These responses to the stimuli were stable during
the whole experimental session (for an analysis of response stability
of 30 flies see also Supplementary Fig. S4 online). Furthermore, the
response to ethyl acetate was dose-dependent, with the strength of
responses correlating well with stimulus concentration
(Supplemen-tary Fig. S7 online). As individual flies were stimulated repeatedly
with each odorant, we could also test whether or not each fly was
significantly attracted or repelled by it (Fig. 3b and Supplementary
Fig. S5 online).
In addition to ethyl acetate and benzaldehyde, we tracked
res-ponses to pulses of balsamic vinegar and to cis-vaccenyl acetate
(cVA, a pheromone involved in aggregation, mating, and
aggres-sion
18–21). We recorded responses of 30 female and 30 male wild type
flies. For each individual fly we calculated the upwind speed and the
undirected activity (i.e. whether the fly was moving or not,
independ-ent from the heading direction and walking speed) before, during
and after encountering the stimulus. Based on repeated stimulations
we calculated the median responses (i.e. the median walking speed
and the activity) of each fly to each odor (for an example see single fly
in Fig. 3a, for additional odorants see Supplementary Fig. S5 online).
Wild type flies of both sexes display a similar response repertoire
to all odors regarding both undirected activity and directed
move-ments (Fig. 4). However, sex-specific differences were found in
strength and duration of the responses to food-related odors
(bal-samic vinegar and ethyl acetate, Fig. 4b and c) and cVA (Fig. 4e).
Female flies accelerated their upwind movements significantly more
and longer after stimulation with food-related odors than male flies.
Male flies on the other hand, responded stronger and longer lasting
to cVA than female flies. As upwind movements would bring a fly
closer to an odor source, we interpret odorants that provoke upwind
movements as attractive. While all food-related odors and cVA
pro-voked directed upwind runs 200–300 ms after meeting time,
benzal-dehyde resulted in a non-sex-specific, 500-ms lasting decrease in
activity (from now on called ‘‘freezing’’) that was followed by a
directed downwind movement (Fig. 4d). Freezing also occurred
when flies were tested with 1-octen-3-ol (Supplementary Fig. S6
online), another odor that has been described to repel Drosophila
22.
We interpret the freezing and downwind movements as avoidance
behavior.
To reconfirm the findings that the responses we observed are
indeed olfactory guided we performed experiments with Orco
mutant flies. These flies are lacking most olfactory receptors but
are equipped with functional ionotropic chemical receptors that have
been described to detect mainly acids and amines
6. Orco 2/2 flies
were neither attracted nor repelled by any of the odors (Fig. 4, for
additional odorants see Supplementary Fig. S6 online). However,
activity patterns of Orco 2/2 flies changed significantly when they
were exposed to balsamic vinegar and benzaldehyde (Fig. 4b and d).
Orco 2/2 flies exhibited prolonged freezing behavior after
encoun-ters with balsamic vinegar pulses (Fig. 4b). Benzaldehyde on the
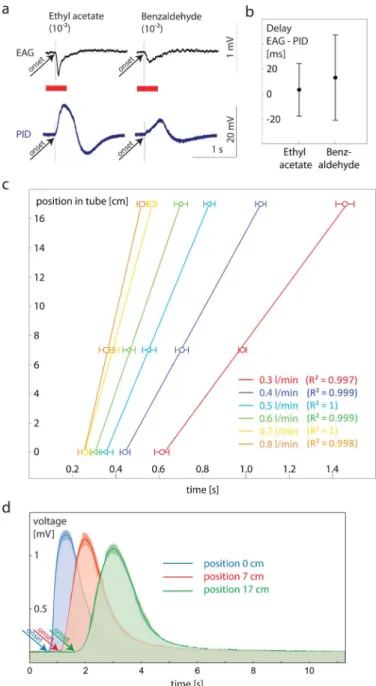
Figure 2
|
Stimulus characterization. (a) Simultaneous PID and EAG recordings of odor pulses.We simultaneously recorded PID and EAG signals at different positions in the tube (5 cm, 10 cm and 15 cm) to 500 ms pulses of ethyl acetate and benzaldehyde (1022dilution). Bothsignals were recorded simultaneously using a 4-channel USB acquisition controller, type IDAC-4 (Ockenfels SYNTECH GmbH, Germany). Arrow heads depicts onset of responses. Please note that the Syntech software processes the analogue input of the PID signal with the same filters as used for EAG processing. Therefore, the course of the PID signal does not reflect the real but a processed course over the whole time elapse. However, it informs about the onset of the signal (arrow head). (b) Delay between time of onset in EAG and PID recordings after stimulation with ethyl acetate and benzaldehyde (n510). We found no systematic delay between both methods applied (n510). (c) Calibration for speed of stimulus movement within the tubes (n510). We conducted PID measurements at three positions in the tube for five different air flows. Linear correlation between time and pulse position within the tube ensures that the stimulus is moving with a constant and predictable speed. (d) Shape of pulses depending on position in tube (n55 for each measurement). Solid line, median; shaded area, interquartile range.
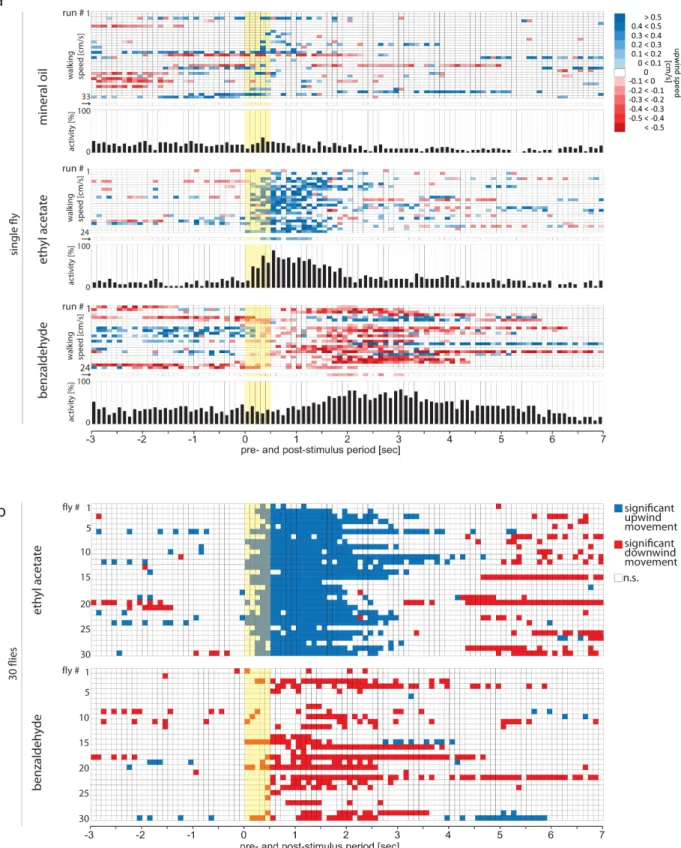
Figure 3
|
Odor induced responses measured withFlywalk. (a) Ethograms, responses of a single fly to repeated stimuli (duration, 500 ms, onset at 0 s; yellow bar) with mineral oil (as solvent control, N 5 30), ethyl acetate (N 5 24), and benzaldehyde (N 5 24). Each row depicts an individual response to one stimulation over a time period of 10 s (3 s pre stimulation, 500 ms stimulation, 6.5 s post stimulation, temporal resolution, 100 ms). Upwind speed is color coded. Arrow marked row, median response during all repeated stimulations with the corresponding odor. Histograms depict activity [%] per time interval, i.e. proportion of colored squares and total squares per time interval. (b) Statistically analyzed responses of 30 flies to repeated stimulations with ethyl acetate and benzaldehyde. Each row depicts the statistically analyzed response of one individual fly to repeated stimulations with ethyl acetate respectively benzaldehyde, compared to the median response to the solvent. Red square, statistical test reveals that net-responses to odor is smaller than expected value 0, i.e. fly exhibited significant downwind movement during that 100-ms time frame; blue square, statistical test reveals that net-responses to odor is larger than expected value 0, i.e. fly exhibited significant upwind movement during that time frame; white square, statistical test reveals that net-responses to odor does not differ from expected value 0, i.e. fly did not exhibit significant up- or downwind movement. Yellow area, 500 ms odor stimulus. For statistical analysis see Method section.Figure 4
|
Odor induced responses of female and male wildtypeDrosophila and female Orco- mutants. (a–e) Tested odors. Top graphs, boxplot representation of odor-induced changes in upwind speed of 30 flies; black line, median upwind speed; box, interquartile range; whiskers, 90th and 10th percentiles. The blue box-plots depict significantly increased upwind speed compared to the upwind speed during the solvent control situation within the corresponding 100-ms time frame; red box-plots depict significantly decreased upwind speed compared to the upwind speed during the solvent control situation within the corresponding 100-ms time frame, grey box-plots depict no significant difference in upwind speed. Pink colored bar depicts time intervals during which the group showed increased movements compared to the other group (i.e. females vs. males). Low graphs, undirected activity of 30 flies; black line, median activity; shaded area, interquartile range; green, significantly increased activity compared to solvent control; orange, significantly decreased activity compared to solvent control; grey, activities in odor and solvent control situations do not differ. Yellow area, 500 ms odor stimulus. For statistical analysis see Methods section.other hand evoked in Orco 2/2 flies a delayed increase in activity, as
also observed in wildtype flies (Fig. 4d).
As this setup enables us to stimulate individual flies with pulses of
volatiles compounds and observe already minute changes in the flies’
behavior, we next investigated how flies respond to fly odors, i.e. the
headspace of flies (for detailed description of rearing and headspace
collection see material section). We recorded the movements of
males, virgin females and mated females while they were exposed
to pulses containing the headspace of males, virgin females and
mated females (Fig. 5). Males, virgin females and mated females
responded with higher upwind speeds to the male volatiles compared
to the female volatiles (Fig. 5b–d). However, while headspace of
mated females evoked no significant response in any of the tested
groups, headspace of virgin females was attractive to males. Hence,
based on volatile cues flies in general are able to distinguish between
sexes and males can evaluate a female’s mating status.
Discussion
Here we present a novel paradigm and instrument for studying the
odor-induced behavior of Drosophila. The method features four
major advantages over commonly used approaches:
.
The positions of 15 individual flies are tracked in parallel.
.
Each animal is exposed to an identical air stream carrying
ident-ical odor stimuli.
.
Stimuli are delivered with high precision in quantity, quality and
timing.
.
The stimulus delivery system is synchronized in time with the
automatic tracking system.
The combination of these requirements allows for
.
screening of numerous odors for behavioral relevance,
.
in-depth study of odor-evoked behavior of numerous
individu-ally tested flies with a so-far unmatched temporal resolution of
100 ms,
.
better comparability of behavioral and physiological data (EAGs,
calcium imaging, and single sensillum recordings), as both can be
obtained with identical olfactory stimuli.
In order to demonstrate the potential of this approach we
addressed the following questions:
.
Do male and female flies differ in their olfactory responses?
.
Do Orco mutant flies respond to olfactory stimuli?
.
Are volatile cues sufficient for flies to evaluate sex and mating
status of conspecifics?
We found that depending on stimulus quality flies responded with
directed runs. Attractive odors (ethyl acetate, balsamic vinegar and
cVA) increased the flies’ upwind movements, while an aversive odor
(benzaldehyde) elicited downwind movements (Fig. 4). Additional
information regarding olfactory responses was provided by the
evaluation of the flies’ undirected activity. While it is evident that
increased directed movements also result in increased activity, a
decrease in activity, i.e. freezing as a response to odorants (Fig. 4),
has so far been overlooked. Furthermore, odor-evoked changes in
behavior appear to be consistent during long experimental sessions
(Supplementary Fig. S4 online). These findings thus enabled us to
evaluate the behavior of individual flies for their olfactory
pre-ferences (Fig. 3b, 4, and Supplementary Fig. S5) and sensitivity
(Supplementary Fig. S7 online).
We provide evidence that flies exhibit sex-specific responses to
food-derived odors (ethyl acetate and balsamic vinegar, Fig. 4b, c)
and to a fly-derived pheromone (cVA) (Fig. 4e). The significantly
stronger responses of females to food odors might be explained by
increased motivation of females. Female flies have higher food
requirements due to egg production, and are additionally searching
for potential oviposition sites. By contrast, we found no differences
between responses of female and male flies to the repellent odors.
Upon stimulation with benzaldehyde and 1-octen-3-ol both sexes
responded with freezing, which in the case of benzaldehyde was
followed by downwind movements (Fig. 4d). Males responded
stron-ger to cVA than females. cVA is involved in different behavioral
circuits: after successful mating a male fly transfers cVA to the
female, which reduces her attractiveness to other males
23.
Further-more cVA has been demonstrated to act as an aggregation
phero-mone for female and male flies
18and – in high concentrations – to
induce aggression in males
21. The observed upwind runs of females
thus correspond well with the role of cVA as an aggregation
phero-mone. On the other hand, the even stronger responses of males to
cVA might be explained by co-acting motivations like aggregation
and aggression.
We next asked whether the odor-evoked response of the flies
depends on functional olfactory receptors. Based on previous
find-ings showing that mutant flies lacking the olfactory coreceptor Dmel/
Orco are not attracted to a majority of odors, these flies and their
larvae have been described as anosmic
24. We could confirm that Orco
flies are not attracted nor repelled by any of the odors tested (Fig. 4).
However, by measuring the mutant flies’ activity we were able to
identify odors (e.g. balsamic acid, benzaldehyde) that caused activity
changes. Hence, these volatiles might be detected by ionotropic
glutamate-like receptors, another kind of Drosophila
chemorecep-tors that are not affected by the Orco mutation
6,25. Again, the analysis
of activity offered additional valuable clues about the fly’s ability to
smell even in the absence of any valence-specific behavior.
The analytic power of the approach became further apparent when
we tested flies with headspace collections from males, and virgin and
mated females. Producing headspaces of 900 individually selected
flies with known sex and mating status is highly labor and time
consuming (see Methods). In such a case the advantage of the
Flywalk is that it is possible to collect meaningful data during a
limited number of experimental sessions (i.e. three experiments
already produced data with sufficient statistical power). We found
that all female flies responded strongly (i.e. exhibited upwind runs) to
the headspace of males (Fig. 5b) but not to the headspace of females
(Fig. 5c and d). So far sex discrimination experiments in Drosophila
always included multisensory information like visual, tactile,
aud-itory, gustatory and olfactory cues
1,20,26,27. Our results show that
olfactory cues alone are sufficient for female flies to identify potential
mating partners. Like females, males responded to male headspace
(Fig. 5b) but not to the one collected from mated females (Fig. 5d), i.e.
they discriminated between sexes. Males were however attracted by
the virgin female headspace (Fig. 5c). This shows that male flies are
capable of evaluating the mating status of a potential partner based
on olfactory cues. Future experiments using our high-throughput
behavioral paradigm – the Flywalk – will be aimed at revealing which
volatile components are involved in the evaluation of sex and mating
status.
Methods
Fly rearing.Flies (CantonS, Bloomington) and Orco 2/2 mutants were maintained at 25uC, 70% relative humidity under 12L:12D in standard food vials
(25 mm395 mm) containing standard agar-cornmeal medium. At the age of 4 days flies were starved for 24 hours in a glass vial containing a moist bed of tissue paper. Experiments were conducted with 5-days old flies.
Experimental setup.The setup consisted of 15 glass tubes (length, 18 cm, Ø 0.8 cm, Fig. 1) each containing one fly. The tubes were aligned on an electroluminescent foil (Reichelt, Germany) combined with red plexiglass (allowing light with wave length .630 nm to pass). The positions of the flies were recorded with an automatic tracking system (Supplementary Fig. S3 online). As the only light source during the experiment derived from the red illuminating background, any visually induced following behavior of neighboring flies could be excluded. The tubes were connected to an olfactory stimulus generator16that
provided continuous air flow (purified compressed house air; temperature, 25uC; humidity, 75%; wind speed, 18 cm/s) and – after the flies were allowed to adapt for 30 min – delivered pulses of up to seven individual odorants and a no-odorant solvent control with a stimulus length of 500 ms and a stimulus interval of 90 s.
Figure 5
|
Responses of male, virgin female, and mated female flies to fly odors. (a–d) Tested headspaces of no flies (a), male (b), virgin female (c), and mated female (d) flies. Top graphs, boxplot representation of odor-induced changes in upwind speed of 15 flies; black line, median upwind speed; box, interquartile range; whiskers, 90th and 10th percentiles. The blue box-plots depict significantly increased upwind speed compared to the upwind speed during the solvent control situation within the corresponding 100-ms time frame; red box-plots depict significantly decreased upwind speed compared to the upwind speed during the solvent control situation within the corresponding 100-ms time frame, grey box-plots depict no significant difference in upwind speed. Low graphs, undirected activity of 15 flies; black line, median activity; shaded area, interquartile range; green, significantly increased activity; orange, significantly decreased activity. Yellow area, 500 ms odor stimulus. For statistical analysis see Methods section.(For detailed description of the olfactory stimulation system see16, for a detailed
description of the connections between tubes and system see Supplementary Fig. S1 online.)
Stimulus preparation.Each of the seven odor vials contained one odor (either a single odorant, or a complex mixture like balsamic vinegar). Unless otherwise mentioned, odors were dissolved 1510 in mineral oil. 100 ml of the dissolved odor were pipetted in a 1 ml Eppendorf tube. One additional vial served as a solvent control. The odor and control vials containing the Eppendorf tubes were sealed hermetically with a stainless steel plug and a rubber O-ring and with corresponding ball-stop check valves at both inlets and outlets.
Preparation of headspace collections from males, and virgin and mated females. For each of the experimental sessions we prepared headspace collections of 100 mated males, 100 virgin females, and 100 mated females. For this purpose, flies were separated by sex at the pupal stage to ensure virginity of female flies. The flies – one group of virgin females and one group of mixed sexes – were kept for three days on standard agar-cornmeal medium. They were then transferred to sugar water for two days to reduce food-derived chemicals sticking to the flies’ bodies. Prior to the experiment we equipped the odor vials of the setup with flies, now separated by sex and mating status: one vial with 100 virgin females, one vial with 100 mated females and one vial with 100 mated males. The flies were kept in the vials at room temperature for 5 hours. Afterwards the vials were placed in the freezer (220uC) for 10 minutes and the flies were removed. This procedure ensured that the vials now contained volatile compounds derived from the flies. Finally the vials were inserted into the stimulus delivery system, allowed to reach room temperature and were then used for the experiment.
Stimulus characterization.In order to analyze the flies’ responses to odor pulses we needed detailed information regarding stimulus characteristics. Therefore, we analyzed pulses within the tubes using a photo ionization device (miniPID, Model 200A, Aurora Scientific Inc.Canada). The miniPID detects and quantifies non-air volatiles with a temporal resolution that resembles that of a fly antenna (Fig. 2a and b). Probing at different positions in the tubes informed us about the speed of the stimuli (Fig. 2c) and ensured that the characteristics of the stimuli regarding stimulus length, concentration, and concentration gradient were consistent at all positions within the tubes (Fig. 2d, for detailed procedure see Supplementary Information online). Digital flowmeters at the end of each hermitically sealed glass tube ensured that the wind speed, i.e. movement of the stimulus, was identical in all tubes.
Data generation and analysis.In order to analyze stimulus-induced responses, freely walking D. melanogaster flies were individually tracked (time resolution, ca. 25 Hz, spatial resolution, 0.06 cm, i.e. 25% of the fly’s body length; for detailed description of the tracking system see Supplementary Information). Position coordinates of the flies were synchronized with the timer information of the stimulus delivery system. Based on onset time and speed of the stimulus within the tube and the tracked position of each fly within its tube, a MATLAB routine (The Mathworks, Natick, USA) then calculated the time when the stimulus reached the fly for each individual, i.e. meeting time. In several cases, a fly was outside the region of interest (Fig. 1) when meeting the stimulus and therefore was not included in the evaluation. Thus, one representative experimental session resulted in approximately 22 analyzable runs per fly and compound (Supplementary Fig. S3 online). For each of these runs (which can be assigned unambiguously to a fly and to an odor) the MATLAB routine quantified the linear (i.e. up- and downwind) movements of the fly before, during and after the odor stimulation with a temporal resolution of 100 ms. The ethograms, i.e. the color-coded response matrixes for one fly tested repeatedly with mineral oil, ethyl acetate and benzaldehyde are displayed in Fig. 3a.
Statistical analyzes were conducted to test whether
. an individual fly increased its up- or downwind movements as a response to pulses of a given odor compared to the control (Fig. 3b and Supplementary Information Fig. S5).
. the sum response (i.e. the summed responses of a group of flies) to an odor differed to the response to the solvent control (Fig. 4 and Supplementary Information Fig. S6).
. the flies’ activity changed as a response to pulses of a given odor compared to the control (Fig. 4 and Supplementary Information Fig. S6).
. two groups of flies differed in their responses (i.e. the summed responses of two groups of flies) to the same odor (Fig. 4).
How does an individual fly respond to a given odor? In order to statistically analyze the responses of individual flies to the repeated stimulation with a given odor, we first calculated the median movements before, during, and after stimulation with mineral oil (i.e. the solvent control) for each fly (see median responses in Fig. 3a, single row of the data marked by arrow). We then subtracted the median response to the solvent stimulus (one median response) from each single response to a given odor stimulus (between 7 and 35 responses, compare Supplementary Fig. S3). By this calculation we receive (between 7 and 35) net-responses. If the response to a given odor is the same as to the solvent stimulus one would expect to receive values around 0 for all time intervals before, during and after stimulation. Therefore we use a Wilcoxon-Signed-Rank-Test to compare for each time interval whether these (7 to 35) net-values differ
from the expected value, i.e. from 0. If this statistical test reveals that the net-values for a given time interval is larger then 0, i.e. the heading direction is upwind, the cor-responding square appears blue in Figure 3b. If the net-values for a given time interval is smaller then 0, i.e. the heading direction is downwind, the corresponding square appears red in Figure 3b. If this statistical test reveals that the net-values for a given time interval does not differ from 0, the corresponding square appears white in Figure 3b.
When analyzing the summed responses of groups of flies we subtracted the median responses (i.e. 30 median traces) during mineral oil situation (i.e. the solvent control) from the median responses during test situations for each fly. This results in one net-response per fly and thus, 30 net-net-responses for the group of 30 tested flies. Assuming that the net-responses would not differ from 0 (because the responses to the solvent and to a given odor were the same) we tested against an expected value using the Wilcoxon signed-rank test. We tested for each time interval whether the 30 net-values differed significantly from the expected value, i.e. from 0. If this statistical test reveals that the net-values for a given time interval is larger then 0, i.e. the heading direction is upwind, the corresponding box-and-whisker-plot appears blue in Figures 4 and 5. If the net-values for a given time interval is smaller then 0, i.e. the heading direction is downwind, the corresponding box-and-whisker-plot appears red in Figures 4 and 5. If this statistical test reveals that the net-values for a given time interval does not differ from 0, the corresponding box-and-whisker-plot appears grey in Figures 4 and 5.
In addition to the directed movements (i.e. how fast a fly was moving up- or downwind) we quantified the undirected activity of each fly and each time interval (i.e. whether the fly was moving or not, independent from the direction or speed of movement). The activity histograms in Fig. 3a represent examples for a single fly tested with mineral oil (solvent control), ethyl acetate and benzaldehyde. The values of the activity histograms depict the relative proportion of movements for each time frame (i.e. the number of colored squares for each time frame of the ethogram compared to the total number of white and colored squares for each time frame of the ethogram). These activity traces were calculated for each fly, which results in 30 activity traces for each odor. Again, we subtracted the activity traces during control situations from the activity traces during test odor situations for each fly. This results in one net-activity per fly and odor and thus, 30 net-activities for the group of 30 tested flies. Assuming that the net-activity would not differ from 0 (because the activities during the solvent situation and during a given odor situation were the same) we tested against an expected value using the Wilcoxon signed-rank test. We tested for each time interval whether the 30 net-values differed significantly from the expected value, i.e. from 0. If this statistical test reveals that the net-values for a given time interval is larger then 0, i.e. the activity during the odor situation is increased compared to the solvent control situation, the corresponding time interval appears green in Figures 4 and 5. If the net-values for a given time interval is smaller then 0, i.e. the activity during the odor situation is decreased compared to the solvent control situation, the corresponding time interval appears orange in Figures 4 and 5. If this statistical test reveals that the net-values for a given time interval does not differ from 0, the corresponding time interval appears grey in Figures 4 and 5.
To analyze differences between groups tested with the same stimulus we compared the median movements of both groups during each time interval using the Wilcoxon signed-rank test. If the values for a given time interval differ between the groups, the corresponding time intervals are marked with a colored bar in the group showing increased movements in Figure 4.
1. Grosjean, Y. et al. An olfactory receptor for food-derived odours promotes male courtship in Drosophila. Nature 478, 236–U123 (2011).
2. Hallem, E. A. & Carlson, J. R. Coding of odors by a receptor repertoire. Cell 125, 143–160 (2006).
3. Bhandawat, V., Olsen, S. R., Gouwens, N. W., Schlief, M. L. & Wilson, R. I. Sensory processing in the Drosophila antennal lobe increases reliability and separability of ensemble odor representations. Nat. Neurosci. 10, 1474–1482 (2007). 4. Sachse, S. et al. Activity-dependent plasticity in an olfactory circuit. Neuron 56,
838–850 (2007).
5. Semmelhack, J. L. & Wang, J. W. Select Drosophila glomeruli mediate innate olfactory attraction and aversion. Nature 459, 218–U100 (2009).
6. Silbering, A. F. et al. Complementary function and integrated wiring of the evolutionarily distinct Drosophila olfactory subsystems. J. Neurosci. 31, 13357– 13375 (2011).
7. Ruebenbauer, A., Schlyter, F., Hansson, B. S., Lofstedt, C. & Larsson, M. C. Genetic variability and robustness of host odor preference in Drosophila melanogaster. Curr. Biol. 18, 1438–1443 (2008).
8. Tully, T. & Quinn, W. G. Classical-conditioning and retention in normal and mutant Drosophila melanogaster. J. Comp. Physiol., A 157, 263–277 (1985).
9. Faucher, C., Forstreuter, M., Hilker, M. & de Bruyne, M. Behavioral responses of Drosophila to biogenic levels of carbon dioxide depend on life-stage, sex and olfactory context. J. Exp. Biol. 209, 2739–2748 (2006).
10. Claridge-Chang, A. et al. Writing Memories with Light-Addressable Reinforcement Circuitry. Cell 139, 405–415 (2009).
11. Keller, A., Zhuang, H. Y., Chi, Q. Y., Vosshall, L. B. & Matsunami, H. Genetic variation in a human odorant receptor alters odour perception. Nature 449, 468– U6 (2007).
12. Budick, S. A. & Dickinson, M. H. Free-flight responses of Drosophila melanogaster to attractive odors. J. Exp. Biol. 209, 3001–3017 (2006).
13. Bhandawat, V., Maimon, G., Dickinson, M. H. & Wilson, R. I. Olfactory modulation of flight in Drosophila is sensitive, selective and rapid (vol 213, pg 3625, 2010). J. Exp. Biol. 213, 4313–4313 (2010).
14. Duistermars, B. J., Chow, D. M. & Frye, M. A. Flies require bilateral sensory input to track odor gradients in flight. Curr. Biol. 19, 1301–1307 (2009).
15. Lehmann, F. O. & Dickinson, M. H. The changes in power requirements and muscle efficiency during elevated force production in the fruit fly Drosophila melanogaster. J. Exp. Biol. 200, 1133–1143 (1997).
16. Olsson, S. B. et al. A novel multicomponent stimulus device for use in olfactory experiments. J. Neurosci. Methods 195, 1–9 (2011).
17. Kwon, Y. et al. Drosophila TRPA1 channel is required to avoid the naturally occurring insect repellent citronellal. Curr. Biol. 20, 1672–1678 (2010). 18. Bartelt, R. J., Schaner, A. M. & Jackson, L. L. Cis-vaccenyl acetate as an aggregation
pheromone in Drosophila melanogaster. J. Chem. Ecol. 11, 1747–1756 (1985). 19. Benton, R. Sensitivity and specificity in Drosophila pheromone perception. Trends
Neurosci. 30, 512–519 (2007).
20. Kurtovic, A., Widmer, A. & Dickson, B. J. A single class of olfactory neurons mediates behavioural responses to a Drosophila sex pheromone. Nature 446, 542– 546 (2007).
21. Wang, L. & Anderson, D. J. Identification of an aggression-promoting pheromone and its receptor neurons in Drosophila. Nature 463, 227–U114 (2010). 22. Knaden, M. (submitted).
23. Zawistowski, S. & Richmond, R. C. Inhibition of courtship and mating of Drosophila melanogaster by the male-produced lipid, cis-vaccenyl acetate. J. Insect Physiol. 32, 189–192 (1986).
24. Larsson, M. C. et al. Or83b encodes a broadly expressed odorant receptor essential for Drosophila olfaction. Neuron 43, 703–714 (2004).
25. Benton, R., Vannice, K. S., Gomez-Diaz, C. & Vosshall, L. B. Variant ionotropic glutamate receptors as chemosensory receptors in Drosophila. Cell 136, 149–162 (2009).
26. Murthy, M. Unraveling the auditory system of Drosophila. Curr. Opin. Neurobiol. 20, 281–287 (2010).
27. Everaerts, C., Farine, J.-P., Cobb, M. & Ferveur, J.-F. Drosophila cuticular hydrocarbons revisited: Mating status alters cuticular profiles. Plos One 5 (2010).
Acknowledgments
This study was supported by fundings from the Max Planck Society to BSH.
Author contribution
KS performed the experiments. KS, DV, and MK have constructed the behavioral paradigm. KS, SB, ZM, BSH, and MK have written the manuscript. SB, ZM, and PV have written the software and have edited the manuscript. RG has written additional routines to analyze the data.
Additional information
Supplementary informationaccompanies this paper at http://www.nature.com/ scientificreports
Competing financial interests:I declare that the authors have no competing interests as defined by Nature Publishing Group, or other interests that might be perceived to influence the results and/or discussion reported in this manuscript.
License:This work is licensed under a Creative Commons
Attribution-NonCommercial-ShareAlike 3.0 Unported License. To view a copy of this license, visit http://creativecommons.org/licenses/by-nc-sa/3.0/
How to cite this article:Steck, K. et al. A high-throughput behavioral paradigm for Drosophila olfaction - The Flywalk. Sci. Rep. 2, 361; DOI:10.1038/srep00361 (2012).
ERRATUM:
A high-throughput behavioral paradigm for Drosophila olfaction - The
Flywalk
Kathrin Steck
1, Daniel Veit
1, Ronald Grandy
1, Sergi Bermu´dez i. Badia
2, Zenon Mathews
3, Paul Verschure
3,
Bill S. Hansson
1& Markus Knaden
11Max Planck Institute for Chemical Ecology, Jena, Germany,2Madeira Interactive Technologies Institute, University of Madeira -Carnegie Mellon j Portugal - Madeira Tecnopolo, 9020-105 Funchal, Portugal,3Laboratory of Synthetic Perceptive, Emotive and Cognitive Systems, ICREA-UPF, Barcelona, Spain.