___________________________________
1 Professora Associada, Laboratório de Ensaios Não Destrutivos, Faculdade de Engenharia Agrícola, Universidade Estadual de Campinas, Campinas - SP.
2 Professor M.Sc., Divisão Tecnológica de Construção Civil, Faculdade de Tecnologia, Universidade Estadual de Campinas, Campinas, SP e Doutorando do Laboratório de Ensaios Não Destrutivos, Faculdade de Engenharia Agrícola, Universidade Estadual de Campinas - SP.
3 Engo Agrícola, Mestrando, Biosystems and Agricultural Engineering Department, University of Kentucky, EUA. Recebido pelo Conselho Editorial em: 9-4-2010
TESTING
RAQUEL GONÇALVES1, MILTON GIACON JÚNIOR2, IGOR M. LOPES3
ABSTRACT: The determination of the modulus tangent (Eci) and of the modulus secant (Ecs) of the concrete can be done using compression test but, to be simpler, it is used relations with characteristic strength (fck). Relations are also used to determine the transversal modulus (Gc) and, in the case of the Poisson’s ratio (), a fixed value 0.20 is established. The objective of this research was to evaluate the use of the ultrasonic propagation waves to determine these properties. For the tests were used specimens with fck varying from 10 to 35 MPa. For the ultrasonic tests were used cylindrical and cubic specimens. The modulus of deformation obtained by ultrasound was statistically equivalent to the obtained by compression tests. The results of modules obtained using the relations with fck was far away from those obtained by ultrasound or by compression tests. The Poisson’s ratio obtained by ultrasound was superior to the fixed value. We can conclude that the concrete characterization by ultrasound is consistent and, to this characterization the cylindrical specimen, normally used to determine fck, can be used.
KEWORDS:compressive strength, modulus of deformation, mechanical properties.
DETERMINAÇÃO DA MATRIZ DE RIGIDEZ DO CONCRETO UTILIZANDO ULTRASSOM
RESUMO: A determinação dos módulos de deformação tangente (Eci) e secante (Ecs) do concreto pode ser realizada por meio do ensaio de compressão, mas, por facilidade, utilizam-se relações com a resistência característica (fck). Relações são também utilizadas na determinação do módulo de elasticidade transversal (Gc) e, no caso do coeficiente de Poisson (), um valor fixo de 0,20 é adotado. O objetivo do trabalho foi avaliar o uso de propagação de ondas de ultrassom na determinação dessas propriedades. Para os ensaios, foram utilizados corpos de prova com fck variando de 10 a 35 MPa. No caso do ultrassom, os corpos de prova foram cilíndricos e cúbicos. Os valores de módulo de deformação obtidos por ultrassom foram estatisticamente equivalentes aos obtidos por compressão e, no caso do ultrassom, os corpos de prova cúbicos e cilíndricos apresentaram resultados estatisticamente equivalentes. Os módulos obtidos por meio de relações com fck distanciaram-se dos obtidos tanto por ultrassom quanto pelo ensaio de compressão. O coeficiente de Poisson obtido por ultrassom foi superior ao valor fixado. Pode-se concluir que a caracterização do concreto por ultrassom é viável e que, para essa caracterização, o corpo de prova cilíndrico, usualmente utilizado para a determinação do fck, pode ser utilizado.
PALAVRAS-CHAVE:resistência à compressão, módulo de deformação, propriedades mecânicas.
INTRODUCTION
software. However, the use of those software demands the complete characterization of the material.
In Brazil, procedures for determining the strength and elasticity parameters of concrete are given by the standard methods: NBR 5739 (1994) and NBR 8522 (2004). In structural design, concrete is classified by its compressive strength (fck) 28 days after molding. On the other hand, tests to determine the modulus of elasticity, which for concrete is normally called the modulus of deformation, are more intricate and require specific equipment that is not always available. The term “modulus of deformation” is adopted because Hooke’s Law is valid only for very limited stress values (approximately 30% of fc) because above that limit the concrete has a residual deformation after the load is removed, and so, the strain is no longer proportional to the stress. Considering this behavior, two methods have been proposed by NBR 8522 (2004) to determine the modulus of deformation by compression testing: the modulus of deformation tangent to the origin (Eci), and the secant modulus of deformation (Ecs). Eci is considered equivalent to the secant or chord modulus of deformation for stresses between = 0.5 MPa and 30% of the rupture stress (fc). Ecs is the angular coefficient of the secant line of the stress-strain diagram () passing through the point corresponding to = 0.5 MPa and through a point corresponding to a fixed stress (n).
Because of the difficulties with testing, these values are not always available to the designer, so the standard of the Design of Concrete Structures (NBR 6118, 2004) provides empirical equations that associate the modulus of deformation Eci to the concrete characteristic strength (fck). Experimental determination of the transverse modulus (Gc) and Poisson's ratio ( ) is even more complex, so the NBR 6118 (2004) assumes relationship with Ecs to obtain the Gc and for is fixed a value.
Several studies have shown that although the longitudinal modulus of deformation has a direct relationship with the characteristic strength, this relationship changes as a function of several parameters, so, the adoption of a single relationship is not adequate (SIDERIS et al., 2004).
With regard to Poisson’s ratio (), many technical papers have demonstrated that there can be major changes around the normally adopted value, both as a function of aggregates and as a function of the measurement method (SIDERIS et al., 2004, AGUILAR et al., 2006, BONFIGLIORI & PASCALE, 2000, KLINK, 1975, LU & HSU, 2007). It has been shown, by these authors that the Poisson’s ratio in compression is not constant, but varies along the cross section of the specimen, increasing with the distance from de specimen face. The results obtained by KLINK (1985) showed that the Poisson’s ratio measured at the center of the concrete specimens is about 55% higher than that obtained by the standard method, with measures in the face of the specimen. The results from these authors also show that the Poisson’s ratio can vary about 30% as a function of the composition of aggregates.
Previous research (PRASSIANAKIS & PRASSIANAKIS, 2004) on the assessment of the capacity of non-destructive testing (NDT) to evaluate concrete integrity concluded that ultrasonic tests were feasible for assessing the material.
Hooke’s Law provides the stress-strain relationship of elastic materials by means of the matrix of the material elastic components (stiffness matrixCiklm) (BODIG & JAYNE, 1982). Non-destructive testing using the propagation of ultrasonic waves has been used to obtain the stiffness matrix of materials where the number of independent components depends on the degree of complexity of the material being assessed. In the case of concrete, considered to be isotropic, the matrix is composed of only three independent elements.
the mass and a is the acceleration) and the differential equation for the wave propagation (
= where u is the displacement and V is the velocity of the particle) it can be associate stress
with the movement of the internal structure of the material. In 1877, using a complex mathematical procedure, Christoffell obtained the relationships between the coefficients that make up the material’s stiffness matrix (Cii and Cij) and the propagation speed of ultrasonic waves (Vii and Vij).
Taking into account the above mentioned aspects, the aim of this study is to evaluate the use of ultrasonic technique to determine the stiffness matrix of concrete, and through it the elastic parameters (E, G and).
METHODOLOGY
To perform this research, 30 cylindrical specimens measuring 100 mm in diameter x 200 mm in length, and five cubic specimens 150 mm in size were molded with five different concrete mixes. The cubes were used in ultrasonic tests to assess if there would be a difference in the stiffness matrix results as a function of the specimen shape.
The five different mixes were made to obtain different strength, so, using different proportions of cement, aggregates, sand and water. The range of fck adopted for the study had an objective to cover the situations with a low, medium and upper (considering the rural structures) level of strength allowing verify if the behavior of the results will be comparable for all level of strength.
The sand and aggregates was the same for all mixes, because we don’t want to introduce any variability linked to the materials. The density of the cement, sand and aggregate was 3,100 kg m-3, 2,564 kg m-3 and 2,960 kg m-3, respectively. The maximum dimension of the aggregate was 19 mm and the slump was 80 mm. With these constituent characteristics the proportion of materials for each mix was calculated (Table 1).
TABLE 1. Proportion of constituents of the five different mixes. Characteristic Strength (fck)
MPa Ratio Water/Cement Cement kg m-3 Gravel kg m-3 kg mSand -3
10 1.20 150 1,111 1,016
15 0.80 225 1,111 954
20 0.65 277 1,111 911
30 0.62 290 1,111 900
35 0.55 327 1,111 870
Concrete was prepared at the laboratory in five batches, with each mix (Table 1) corresponding to a different characteristic of estimate strength (fck). According to Table 1, with the mixes, the estimate fck values will be 10 MPa, 15 MPa, 20 MPa, 30 MPa and 35 MPa. The cement used to mold the specimens was High Initial Strength Portland (CP V ARI). This cement was chosen because this study is part of a project with the goal of classifying reinforced concrete poles, and manufacturers mostly use this type of cement. All specimens were cured in air (approximately 25°C temperature and 65% relative humidity) to simulate the fabrication of concrete poles. The cylindrical metallic molds were filled in four layers, and each layer received 25 strikes from a metallic rod. The strikes did not go beyond the lower layer. The cubes were molded in two layers, receiving 50 strikes with the metallic rod.
Ultrasound tests
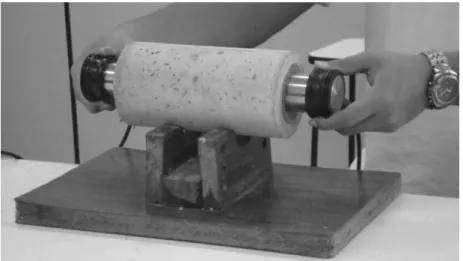
parallel to each other on planar faces (Figure 1) so that wave propagation occurred along the length (200 mm).
FIGURE 1. Ultrasound test on cylindrical specimen.
For the shear transducer, wave propagation was along the length while polarization was in a perpendicular direction. The choice of positioning the transducers on the plane face allowed for better coupling. For each cylindrical specimen, 10 measurements of the wave propagation time were made for both the longitudinal and transverse waves in order to quantify the measurement error.
For the cubes, transducers (longitudinal and transverse) were positioned in parallel on three faces of the specimen (faces 1; 2 and 3) (Figure 2).
FIGURE 2. Ultrasound test on cubic specimen.
piece, a material where the wave propagation speed is known (2,700 m s-1 longitudinal and 1,100 m s-1 transversal).
With the propagation time (t) of the ultrasonic waves as measured by the equipment, and the length of travel (L = distance between transducers), the longitudinal and transverse propagation speeds were calculated. The longitudinal velocities were V11, V22 and V33 according to the measurement directions. The transversal velocities were V12 or V21 (named V66), V13 or V31 (named V55) and V23 or V32 (named V44).
Static tests
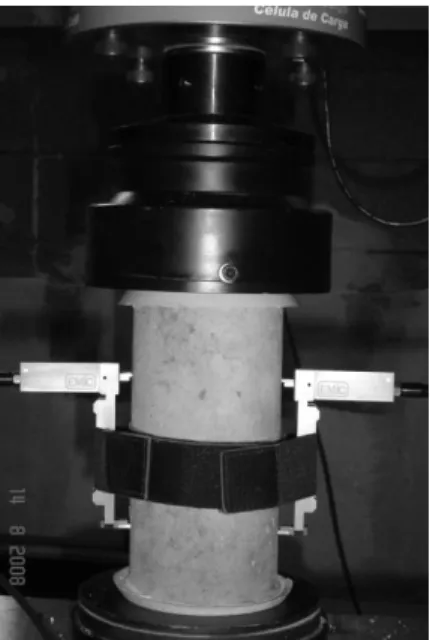
After ultrasonic testing, the cylindrical specimens were coated on top with a mixture of sulfur and kaolin, melted, and placed on the cap to assure that the surfaces were smooth and perpendicular to the specimen axis. After capping, the cylindrical specimens were tested with a universal testing machine (DL30000, EMIC, Brazil) according to NBR 5739 (1994). For the strain measurements were used the extensometers of the testing machine (Figure 3).
FIGURE 3. Compression test with extensometers to strain measurements.
To obtain the modulus of deformation, the specimens were tested according to NBR 8522 (2004). The testing machine allows the modulus of elasticity (Ei) and the rupture stress (fc) to be directly obtained, and captures all stress and strain points, thus making it possible to export the data afterwards to determine the modulus of deformation according to the standards. In addition to fc and Ei, the tangent and secant modulus of deformation (Eci and Ecs respectively) were also calculated using the stress (fc) - strain () diagram and Equations 1 and 2.
(1)
(2)
Where 0.3fc and 0.3fc are the stress and the strain at 30% of the rupture (fc), 0.5 is the strain at 50% of the rupture (fc) and n and n are the stress and the strain at a point corresponding to a fixed stress.
(3)
Ecs = 0.85 Eci (4)
Gc = 0.4 Ecs (5)
Elastic constants assessment
The specific mass of the material () and the velocities of ultrasonic wave propagation obtained with the use of longitudinal transducers (Vii) and with the use of shear transducers (Vij) allow the calculations of the diagonal stiffness terms (Cii and Cij) using the Equation 6.
[Cii = Vii2] or [Cij = Vij2] (6)
So, C11 = V112, C22 = V222, C33 = V332, C44 = V442, C55 = V552, C66 = V662
For isotropic materials the V11 V22 V33, so C11 was calculated using an average of the V11, V22 and V33 and as consequence C11 = C22 = C33. Likewise V44 V55 V66 and so, using an average of these values C44 = C55 = C66.
Therefore, the stiffness matrix [C] takes the following form (BODIG & JAYNE, 1982):
Additionally, by the use of symmetry arguments BODIG & JAYNE (1982) show that C12 = C11– 2C44 that allow us to determine all parameters of the stiffness matrix.
The inverse of [C] gives the flexibility matrix [S], from which E, G, and were obtained for each cylindrical specimen and for the cubes.
G G G E E 1 0 0 0 0 0 0 1 0 0 0 0 0 0 1 0 0 0 0 0 0 E 1 E E 0 0 0 E 1 E 0 0 0 E E 1 S The characteristic strength (fck) of each batch was calculated using the NBR 12655 (2004). This method indicates that for to statistically control for the sampling, the sample size must be of at least n = 6 specimens, and the calculation of fck for 6 n < 20 specimens is given by Equation 7.
2 1 2 2
1
1 2
...
2 n
n
ck f
n
f f
f
f
(7)
where n = the number of specimens tested, and f1, f2,...,fn = values of strengths of the specimens in increasing order.
The same standard specifies that the fck should not have a value smaller than 6 f1,where 6 is a tabulated value that depends on the conditions of the concrete preparation (standard deviation) and on the number of samples tested, which for this study was 0.92 (six specimens in each batch).
RESULTS AND DISCUSSION
Table 2 shows the average results for specific mass (), tangent modulus of elasticity (Eci), initial modulus of elasticity (Ei), and the results for the characteristic strength (fck) for each of the batches. The results show that the characteristic strengths were not exactly equal to those expected for the calculated concrete mix (Table 1), but they were quite close. The greatest differences occurred for batch 2 and 3, with a mix calculated for 15 MPa and 20 MPa and results of 18.15 MPa and 18.2 MPa. Although different fck expected by the calculus, these two batches (2 and 3) had nearly identical fck.
The specific mass remained within the limits considered usual for concrete by NBR 9778 (2001), which are from 2,000 kg m-3 to 2,800 kg m-3. The tangent modulus of elasticity (Eci) was always slightly lower (6% on average) than the initial modulus of elasticity (Ei). This was expected since the former considers a straight line originating at 0.5 MPa and extending to 0.3 fc, while the latter considers a straight line starting at the origin. However, a statistical analysis (ANOVA and Multiple Range Test) performed using all pair of results from Eci and Ei for each specimen of each batch, using the Statgraphics Software, indicated that there was a significant difference only for batch 4, at a confidence level of 95%. It is important to detach that this statistical evaluation was not made using the means values (Table 2) but all sample.
The modulus of deformation determined by NBR 6118 (2004) (as a function of fck) was always lower than the value of Eci determined from the stress-strain diagram. This was also expected, because the use of a predicted value, instead of a calculated value, needs to be more conservative to prevent predictions errors which could provokes safety problems. However, it can be observe that these differences vary considerably (from 6 to 52%), indicating that determining Eci as a function of a fixed correlation with fck (5,600 x (fck½)) can lead to values that are rather small, and thus anti-economical in terms of design.
BODIG & JAYNE (1982) highlight that the determination of the modulus of deformation using the relations with strength can lead to results with differences of up to 20%, even for materials with an elastic behavior such as steel.
TABLE 2. Average values of the specific mass (),tangent modulus of deformation (Eci), initial modulus of deformation (Ei) and characteristic strength (fck), tangent modulus of deformation obtained from the characteristic strength (Eci NBR 6118) and transverse modulus of deformation obtained from the characteristic strength (GcNBR6118).
Batch fck expected kg m 3 GPa Eci GPa Ei MPa fck Eci
NBR 6118 MPa
GcNBR6118 MPa 1 10 2,349 (9) (1.23) 27.19 28.49 (1.18) 10.20 17.88 6.08
2 15 2,389 (39)
26.45
(1.24) 28.13 (1.76) 18.15 23.86 8.11 3 20 2,406
(21)
30.18
(1.92) 32.59 (1.63) 18.21 23.90 8.12 4 30 2,421
(13)
35.21
(1.28) 38.83 (0.36) 30.81 31.08 10.6 5 35 2,466 (15) (0.63) 34.81 36.14 (0.78) 34.12 32.71 11.12 *Values between parentheses indicate the standard deviation.** Results for cylindrical specimens.
Batches 2 and 3 are practically equal in terms of strength, but the differences in values of the modulus of deformation were 14% for Eci and 16% for Ei. The results obtained by SIDERIS et al. (2004) present differences about 20% in Eci for concretes with the same strength properties.
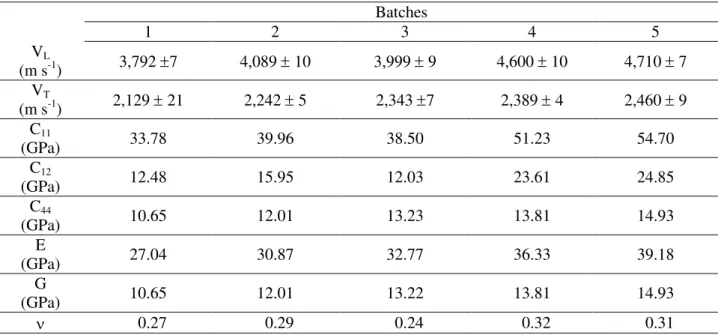
Table 3 and 4 present the results for the average longitudinal (VL) and transverse (VT) speeds, stiffness coefficients (C11, C12, and C44), longitudinal modulus of elasticity (E), transverse modulus of elasticity (G), and Poisson’s ratio () obtained through ultrasonic testing of cylindrical and prisms specimen, respectively. Results for the propagation speed of ultrasonic waves varied less in cylinders than for cubes. This result could be associated with the better homogeneity obtained in molding, since vibration is less effective in prisms. Furthermore, the greater weight of the layers in the cubes provides better compaction of the lower layer.
It was generally observed that speeds increased with fck, indicating that the method for assessing the mechanical properties of concrete had good sensitivity.
TABLE 3. Average longitudinal (VL) and transverse (VT) velocities, stiffness coefficients (C11, C12, and C44), longitudinal modulus of elasticity (E), transverse modulus of elasticity (G), and Poisson’s ratio () obtained through ultrasonic testing.
Batches
1 2 3 4 5
VL
(m s-1) 3,792 7 4,089 10 3,999 9 4,600 10 4,710 7
VT
(m s-1) 2,129 21 2,242 5 2,343 7 2,389 4 2,460 9
C11
(GPa) 33.78 39.96 38.50 51.23 54.70
C12
(GPa) 12.48 15.95 12.03 23.61 24.85
C44
(GPa) 10.65 12.01 13.23 13.81 14.93
E
(GPa) 27.04 30.87 32.77 36.33 39.18
G
(GPa) 10.65 12.01 13.22 13.81 14.93
0.27 0.29 0.24 0.32 0.31
TABLE 4. Average longitudinal (VL) and transverse (VT) speeds, stiffness coefficients (C11, C12, and C44), longitudinal modulus of elasticity (E), transverse modulus of elasticity (G), and Poisson’s ratio ().
Batches
1 2 3 4 5
(kg m-3) 2,323 2,333 2,348 2,410 2,475 VL
(m s-1) 4,009 49 4,243 22 4,235 60 4,690 22 4,793 26 VT
(m s-1) 2,161 42 2,418 37 2,334 42 2,350 62 2,474 60 C11
(GPa) 37.38 41.99 42.15 53.02 56.86 C12
(GPa) 15.68 14.69 16.56 26.38 26.55 C44
(GPa) 10.85 13.65 12.80 13.32 15.16 E
(GPa) 28.11 34.37 32.81 35.49 39.96 G
(GPa) 10.85 13.65 12.80 13.32 15.16 0.30 0.26 0.28 0.33 0.32 *Results for prisms specimens.
The ratio between the static tangent modulus and the dynamic modulus (ultrasonic) obtained by AGUILAR et al. (2006) was around 0.5 for low-strength concretes, and increased to approximately 0.8 for higher-strength concretes. It is important to note that AGUILAR et al (2006) compare Eci with the dynamic modulus obtained through the expression Ed = V2, and not with the modulus found from the flexibility matrix, which takes into account Poisson’s ratio. The ratio between the static tangent modulus and C11 obtained in this work, which correspond to the Ed obtained by the cited author, was about 0.80 for lower strength concrete (batch 1), 0.72 for medium strength concrete (batches 2 and 3) and 0.67 for higher strength concrete (batches 4 and 5). The differences between the batches with different strengths were less significant than the obtained by AGUILAR et al (2006). Using the modulus of elasticity (E) by the stiffness matrix from the ultrasonic testing, in cylindrical specimens, the differences with Ei were about 7%. PRASSIANAKIS & PRASSIANAKIS (2004), also using the Poisson coefficient correction, obtained differences with Ei about 5%.
The modulus of elasticity (E) values obtained with the stiffness matrix from the ultrasonic testing of cylindrical specimens for each batch were compared to the module obtained from the axial compression testing (Eci and Ei) using ANOVA and a Multiple Range Test. For batches 1; 3 and 5 there is no statistical difference between E, Eci, and Ei at a 95% confidence level. For batch 4, E is statistically equivalent to Eci but is different from Ei, and Eci is also different from Ei. Only for batch 2 the value of E obtained from ultrasonic testing was different from those obtained from compression testing.
of elasticity and on Poisson’s ratio. These data are normally predicted as a function of fck. An additional advantage of testing cylinders was that the observed measurement errors of both longitudinal and transverse speeds were much lower.
The ANOVA table and the Multiple Range Test comparison of the mean values of E obtained from ultrasonic testing (cube and cylinder) with the mean values of Eci and Ei obtained from axial compression testing for each batch show that there is no statistical difference between the results. It is important to point out that the ANOVA table resolves the variance of the data into two components, between groups and within a group, and uses “t” and “F” tests to draw conclusions about the statistical equivalence or difference between groups.
The statistical comparison of the values of modulus obtained from ultrasonic testing (cube and cylinder) and from axial compression testing (Eci and Ei) with the modulus proposed by NBR 6118 (2004) verifies that they cannot be considered statistically equal to the latter. This indicates the Standard gives a greater deviation from the actual value of the modulus than that predicted by the ultrasonic tests.
Considering that the value of G proposed by the Standard is even more conservative than the value of Eci, since it is correlated with Ecs (which is 0.85 x Eci), it is expected that the values obtained from ultrasonic tests will always be greater than those predicted by the Standard’s equation (Equation 5). Given the mean values, the value of G predicted by the Standard was 0.65 the value of G determined by ultrasonic testing.
In the case of Poisson’s ratio, NBR 6118 (2004) proposed to adopt a value of 0.20. The results obtained from the stiffness matrix were 0.27, 0.29, 0.24, 0.32, and 0.31 for batches with fck values of 10.20, 18.15, 18.21, 30.81, and 34.12 MPa, respectively. One can note that concretes with fck above 30 had average Poisson’s ratios of 0.32, while up to 18 MPa those ratios were 0.27. Therefore, the Poisson’s ratios were always greater than that proposed by the Standard (0.20) and the variation occurred within the interval (0.24 to 0.32). Interval variation for Poisson’s ratio from 0.22 to 0.34 was obtained by SIDERIS et al. (2004). AGUILAR et al. (2006), BONFIGLIORI (2000), KLINK (1975) and LU & HSU (2007) also demonstrate that there is a large range in the Poisson ratio, so, the adoption of a fixed value is not adequate. KLINK (1975) demonstrates that Poisson’s ratio of concrete, obtained in compression tests, is different at different points of measurement, increasing as the point approaches the centroid sections, where it reaches its maximum value. The results of KLINK (1975) showed that the value of the Poisson’s ratio obtained at the centroid of the section was about 56% larger than that obtained at the edge of the section. Since the ultrasonic test correspond an internal measurement, the results obtained are compatible with those from KLINK (1975).
CONCLUSIONS
The experimental results indicate that the complete stiffness matrix of concrete can be easily obtained and used to estimate the engineering parameters (E, G, and ) by ultrasonically testing the same cylindrical specimens usually employed to determine fck.
ACKNOWLEDGEMENTS
The authors are grateful to CNPq (National Council for Research) for the scholarship and CPFL (The São Paulo Electricity Company) for the financial support.
REFERENCES
AGUILAR, M.T.P.; SILVA, A.P.; CORRÊA, E.C.S.; CETLIN, P.R. Análise da capacidade de deformação do concreto: módulo de Young x módulo de deformação. In: CBECIMat -
ASSOCIAÇÃO BRASILEIRA DE NORMAS TÉCNICAS. NBR 12655: preparo, controle e
recebimento do concreto. Rio de Janeiro, 2004. 7 p.
ASSOCIAÇÃO BRASILEIRA DE NORMAS TÉCNICAS. NBR 9778: argamassa e concreto
endurecidos - determinação da absorção de água por imersão - índice de vazios e massa específica. Rio de Janeiro, 2001. 8 p.
ASSOCIAÇÃO BRASILEIRA DE NORMAS TÉCNICAS. NBR 5739: ensaios de compressão em
corpos de prova cilíndricos. Rio de Janeiro, 1994. 10 p.
ASSOCIAÇÃO BRASILEIRA DE NORMAS TÉCNICAS. NBR 8522: determinação dos módulos
estáticos de elasticidade e de deformação e da curva tensão-deformação. Rio de Janeiro, 2004. 9 p. ASSOCIAÇÃO BRASILEIRA DE NORMAS TÉCNICAS. NBR 6118: projeto de estruturas de
concreto. Rio de Janeiro, 2004. 221 p.
BODIG, J.; JAYNE, B. Mechanical of wood and wood composites. New York: Van Nostrand
Reinhold, 1982.
BONFIGLIOLI, B.; PASCALE, G. Internal strain measurements in concrete specimens in
compression. In: WORLD CONFERENCE ON NONDESTRUCTIVE TESTING/WCNDT, 2000. Roma.
FURTADO, D.A.; TINOCO, I.F.F.; NASCIMENTO,J.W.B.; LEAL, A.F.; AZEVEDO, M.A. Caracterização das instalações avícolas na mesorregião do agreste Paraibano. Engenharia Agrícola,
Jaboticabal, v.25, n.3, p.831-840, 2005.
KLINK, S. A. Acual Poisson's ratio of concrete. Structural ACI Journal, Detroit, p. 813-817,
nov./dez., 1985.
KLINK, S. A. Poisson's ratio variations in concrete. Experimental Mechanics, Brookfield, v.15, n.4,
p.139-141, 1975.
LU, X.; HSU, C.T.T. Tangent Poisson’s ratio of high-strength concrete in tri-axial compression.
Magazine of Concrete Research, London, v.59, n.1, p.69-77, 2007.
PRASSIANAKIS, I.N.; PRASSIANAKIS, N.I. Ultrasonic testing of non-metallic materials: concrete and marble. Theoretical and Applied Fracture Mechanics, Amsterdam, v.42, p.191-198,
2004.
SIDERIS, K.K.; MANITA, K.; SIDERIS, K. Estimation of ultimate modulus of elasticity and Poisson ratio of normal concrete.Cement and Concrete Composites, Barking, v.26, p.623-631,