Alternative Method for Determining the Elastic Modulus of
Concrete
A. H. A. Santos
*, G. O. Ribeiro
**, R. L. S. Pitangueira
**, E. V. M. Carrasco
*** (Departamento de Engenharia Civil - Instituto Politécnico - Pontifícia Universidade Católica de Minas Gerais) ** (Departamento de Engenharia de Estruturas - Escola de Engenharia - Universidade Federal de Minas Gerais) ABSTRACT
This paper presents the use of the technique of digital image correlation for obtaining the elasticity modulus of concrete. The proposed system uses a USB microscope that captures images at a rate of five frames per second. The stored data are correlated with the applied loads, and a stress-strain curve is generated to determine the concrete compressive modulus of elasticity. Two different concretes were produced and tested using the proposed system. The results were compared with the results obtained using a traditional strain gauge. It was observed a difference in the range of 4% between the two methods, wherein this difference depends of a lot of parameter in the case of the DIC results, as focal length and a video capture resolution, indicating that DIC technique can be used to obtain mechanical properties of concrete.
Keywords - Experimental testing, Concrete strain, Concrete Structures
I.
INTRODUCTION
An evaluation of the concrete compressive modulus of elasticity is obtained directly from the
stress-strain curve experimentally. Normal
techniques, such as the Brazilian standard [1] and the American standard [2], suggest methods for concrete strain determination using an electrical resistance strain gauge, a demec mechanical strain gauge and a compressometer. An electrical strain gauge is the most widely used method for concrete strain determination [3]. However, the adhesion of the strain gauge in a concrete sample requires time and attention from the workers, and the adhesion is not reused and results in a technique that is unsustainable. Additionally, the use of a strain gauge determines the size of the concrete samples for this application. Consequently, a strain gauge cannot be attached to smaller or larger parts unless the size is specified by the strain gauge producers.
In recent decades, new technologies, such as acoustic emission [4, 5], digital image correlation [6-11] and shearography [12,13], have been used for certain mechanical parameters of concrete, including the elasticity modulus.
Among these techniques, digital image
correlation (DIC) has gained rapid recognition. The DIC technique has several advantages, including accuracy, dynamics and the rapid analysis of data. This technique uses speckle patterns (natural or artificial) as information carriers. By matching the surface speckles captured before and after a deformation or displacement using a correlation function, adequate speckle displacement can be easily obtained [14].
The use of the DIC technique has been widely accepted in structures engineering because it is an important method for characterizing the mechanical response of homogenous [15-19] and heterogeneous materials [20-24] undergoing nominally planar deformation, especially when evaluating the fracture behavior [25-28]. When using the DIC technique for an evaluation of the elasticity modulus of concrete, the work of Robert et al [29] was the first to demonstrate excellent correlation between the results obtained for the DIC technique with the results obtained by the traditional method. Other work which also made this comparison was to Huang [3]. In this study, Huang [3] used two high-resolution CCD cameras equipped with long working distance lens. The proposed system that is presented in this paper uses a single USB microscope.
Using the principle of DIC, the motion estimated for each point is obtained from the expansion of the imaging system (correlation in mm/pixel). According to Pan [22] and Sutton [30], this estimate only depicts the real point of movement if two requirements are met: (a) the sample surface must be at an angle of 90 degrees to the sensor pickup and remain in this position during loading; (b) the image should not suffer from geometric distortion.
Fig. 1 shows images of a random pattern of a surface captured before and after deformation. To determine the displacement of point A, a region near this point is chosen in the reference image (Fig. 1a) and in the combined deformed image (Fig. 1b). The centroid of the selected rectangular area is used as a
reference point for measuring the relative
displacements. Additionally, the vertices of the
rectangle are used by the image processing software to check the rotation and/or translation of the point.
Figure 1 - Object deformed texture pattern and "overall dimensions"
After capturing the images and the definition of the reference points, subroutines are processed using specific software to store the displacements as rotations (image by image) or as generating coordinates (x, y) (point by point), which are converted using the ratio of pixels per unit length and are adopted as "overall dimensions" as shown in Fig. 1.
This article aims to evaluate the DIC technique for obtaining the elasticity modulus of concrete. Next, samples of concrete, which were prepared for two different compositions, were used for the test of uniform axial compression. The DIC technique results were compared with the results obtained using the strain gauge methods.
The DIC technique was applied using the USB microscope (800x) and specific software. The elasticity modulus of the concrete was determined using the stress-strain diagram.
II.
MATERIAL AND METHODS
According to Pan [22], the DIC technique consists of three consecutive steps: (a) The preparation of the sample surface and the experiment, (b) The recording images from the planar surface of the sample before and after the application of the load, (c) The processing of images acquired using appropriate algorithms to obtain the desired displacements and deformations.Fig. 2 shows the schematic setup of the proposed system for monitoring the deformation of the concrete. A single high-resolution USB microscope was used to capture images in a region (2.0 cm x 1.5 cm). The USB digital microscope (800x) has an image sensor of 1.2 megapixels and a video capture resolution of 1280 x 960 pixels. The rate of capture of the images is five frames per second and is recorded in an AVI video format no compression. The lighting is generated by an LED lamps’ microscope.
For image processing, software was developed using the LabVIEW platform, which analyzes the movements of translation and rotation of the
monitoring points and determines the relative displacements. The respective software implemented two techniques that are specific to image processing: shift invariant and rotation invariant. The first technique considers that during loading, monitoring points can rotate up to four degrees. Values higher than four degrees should be analyzed based on the second technique. The PhD dissertation of Guetti [31] developed the program and validated. In Annex A, this PhD dissertation is shown the steps and routines of digital image correlation software. The proposed set (Microscope and software) is used to measure the deformation.
Ten standard cylindrical concrete samples that have a 100-mm diameter and a 200-mm length were produced.
The specimen is under uniform axial
compression, which is calculated using the ratio between the load and the initial cross-sectional area of the specimen (Fig. 2). The longitudinal strain of the concrete cylinder is obtained from the relative displacement (d) in the axial direction of two points, is used as the basis of measurement (DL) and is located on the surface of the specimen near the generatrix of the cylinder. Using the stress-strain diagram, the elasticity modulus of the concrete is determined.
Figure 2 - System that Captures Digital Images
The studied region was prepared prior to testing by sanding the surface and was sprayed with black and white speckles to provide a good contrast image. A template with points spaced at 0.5 mm is generated. The test can be performed without any surface preparation, but the assurance of the monitoring points will be dependent on the randomness of the medium. The focal length of the microscope was 5 cm with an optical zoom of 200 times (200x). Next, the obtained digital scale was approximately 2 mm/pixel in both image directions. This ratio is suitable for determining deformations that are uniform and constant, when the precision of the deformation attainable is from 153 me.
by coarse aggregate limestone, river sand and cement (CP II - E32). No additives were included in the mixture. Fig. 3 shows the grading curves of the coarse and fine aggregates, which have a maximum diameter (fmax) of 2.4 mm and 12.5 mm, respectively.
The two types of concrete are denoted by L1 and L2. The mix proportions are listed in Table 1. The compressive strength test was performed, and the samples were healed outdoors for 28 days and were protected from direct sunlight.
Figure 3 - Grading curve for (a) fine aggregate, (b) coarse aggregate limestone
The average compressive strength that was determined at 28 days (fc 28) was 40 MPa (for L1 concrete) to 33 MPa (for L2 concrete).
Table 1 - Concrete mix proportions and compressive strength for 28 days
C
o
n
cr
ete
C
em
en
t
(k
g
/m
³)
C
o
ar
se
ag
g
reg
ate
(k
g
/m
³)
Fin
e
ag
g
reg
ate
(k
g
/m
³)
W
ater
(k
g
/m
³)
W
ater
/cem
e
n
t r
atio
A/C
Fc
2
8
(
MPa)
L1 400 1200 600 220 0,50 40
L2 400 1200 600 220 0,55 33
Following a standard concrete testing method indicated by technical standards [1,2], specimens were prepared with a surface flatness of contact using sulfur-based capping. The axial compression tests were performed using a servo-hydraulic machine EMIC, Model PC 200. When the cylinder sample was compressed, a series of images was captured and analyzed. To determine the elastic modulus, the elastic section of the stress-strain curve was
considered in the narrow range between 0.5 MPa and was 30% of the ultimate concrete strength. The data of the compressive strength were previously estimated using the uniaxial compression test, and the strength data were used to determine the ultimate loading for the cylinder specimens and to determine the static modulus of elasticity in compression. The value of 0.5 MPa is used to ensure a uniform contact between the specimen and the machine, which leads to an approximate initial deformation of 0.0001 mm / mm
Charging and discharging cycles were performed to stabilize the test at a rate of 0.45 MPa/s for intervals of 30 seconds between loading and discharge.
Using the system of data capture called SPIDER 8, the displacements’ information and the applied loads were stored in time. The images captured by the microscope were simultaneously stored on a hard disk in parallel. Once, the data capture system and the microscope are decoupled the variable "time" was adopted as the parameter compatibility information.
The compatibility was performed using an electronic spreadsheet, where, before performing the assay, the simultaneity of the system clocks data capture and the USB microscope was done. Additionally, an equivalent definition for the sampling frequency of the numerical data (5 Hz) and for the rate of image capture (5 fps) was performed before the test.
Fig. 4 shows a photograph of the experiment assembly.
Figura 4 - Real setup of the experiment using a servo-hydraulic machine EMIC, Model PC 200 and an USB microscope (800x). The sample is also affixed with traditional strain gauges (mechanical
extensometer).
III.
RESULTS AND DISCUSSION
Fig. 5 shows the deformation versus the time curves for the fourth specimen of concrete L1 obtained from the USB microscope and thetraditional strain gauges. The charging and
discharging cycles are very evident in the curves (Fig. 5). This variation was captured by the DIC technique even though the reference length (DL = 13 mm) of the image was different from the reference length of the traditional strain gauges (DL = 100 mm). The difference between the two curves can be attributed to the non-homogeneity of the composite material as well the difference between the reference length adopted for each of the methods for calculating the deformation.
Figura 5 - Curve deformation versus time for specimen CP4 - L1
The DIC technique has always presented a greater deformation than the traditional strain gauges (Fig. 5). For the highest stress levels, this difference is reduced. The percentage difference between the curves at points A and B is 6.5% and 47.8%, respectively.
An improved fitting in the curves for the highest stress may demonstrate that the DIC technique enhances their sensitivity as the deformation increases.
Figura 6 - Stress-strain curve for a 28-day cylindrical concrete sample CP4 –L1
Fig. 6 shows typical stress-strain curves for the cylindrical concrete sample CP4 - L1 that is obtained from the USB microscope and the traditional strain gauges. The resulting curves are very similar to each
other. The horizontal shift in the axis of the deformation is a direct consequence of the difference observed and discussed in Fig. 5.
The dispersion of the data (Fig. 6) that occurred in the loading and unloading cycles could be related to the fact that the test is held at the same stress level for 30 seconds to stabilize. The cycles may vary because of the apparatus oscillation in the load, which occurs to maintain the stress. For this sample, the difference between the values of the elasticity modulus for the DIC technique and the traditional strain gauges was approximately 3%.
For the other samples, similar curves were obtained, and the average of the elasticity modulus and the standard deviation was calculated (Table 2).
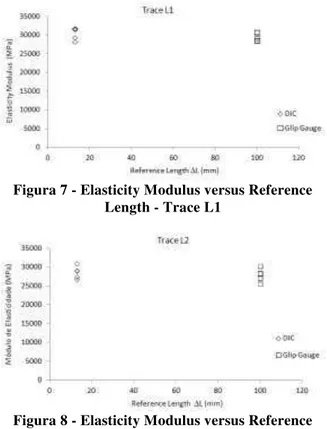
For concrete L1, the average elasticity modulus that was obtained using the DIC technique was 30.56 GPa, and the average elasticity modulus that was obtained using the traditional strain gauges was 29.49 GPa. For concrete L2, the average elasticity modulus obtained using the DIC technique was 28.75 GPa, and the average elasticity modulus that was obtained using the traditional strain gauges was 27.97 GPa. The values obtained for the two types of gauges are similar. The difference between these values for the L1 concrete was 3.63%, and the difference between these values for the L2 concrete was 2.8%. This divergence can be attributed to the differences of the analysis points, the difference between the reference lengths (DL) used to compute the strain for each method and the very characteristic of the inhomogeneous concrete.
Table 2 - Comparative data between the results obtained using the DIC technique and the
traditional strain gauges (MPa)
"optical" strain gauge size (13 mm, of same order of the mean size of the coarse aggregates), has very similar results with a large strain gauge size (100 mm). The test was performed using DIC repeatedly changing the position of the microscope. The values found for the same specimen were different, but within the range of the standard deviation shown in Tab.2. This result shows that the response DIC, even though localized, representing the macroscopic behavior of the axial compression test.
Figura 7 - Elasticity Modulus versus Reference Length - Trace L1
Figura 8 - Elasticity Modulus versus Reference Length - Trace L2
The results showed that the DIC technique provides values equivalent to the values obtained using traditional strain gauges as well as significant advantages. The first major advantage is that the DIC technique can be used without surface preparation or for the preparation of only a small region. Currently, no dependence exists for the randomness of the medium for this technique. The second major advantage is that the dynamics and flexibility of the DIC technique can be applied for studies in which the electrical strain gauge or mechanical strain gauge are not possible, including samples of various sizes. The third advantage includes the accuracy of the system, which can be improved in accordance with the situation by changing both the focal length and the focus area to achieve greater precision. Finally, the proposed system offers low-cost, easy use and sustainability because the hardware can be reused indefinitely.
IV.
CONCLUSIONS
A method for obtaining the concrete strain and displacements using a USB microscope (800x) and for determining the concrete elasticity modulus of compression has been proposed and validated in this paper. The values obtained by the proposed system was of the same order of magnitude of the values generated using the traditional strain gauge. A difference of up to 4% was found for the values of the modulus of elasticity.
New tests will be performed to improve this analysis. For example, a system will be developed for coupling the load to the images without the need for human intervention. In addition, the installation of other microscopes simultaneously will enable the identification of strains in the longitudinal and transverse plane as well as the outside shooting plane.
Generally, the digital image correlation
technique is a technology with a wide range of applications in structures engineering and can be used with any type of material, such as wood and steel.
Acknowledgements
The authors acknowledge the support received from Pró-Reitoria de Pesquisa da Universidade Federal de Minas Gerais - UFMG.
REFERENCES
[1] Associação Brasileira de Normas Técnicas –
ABNT. NBR 8522. Concreto - Determinação do Módulo Estático de Elasticidade à Compressão e Diagrama Tensão-Deformação. ABNT, 2008, 1-9.
[2] C469–02, Standard Test Method for Static
Modulus of Elasticity and Poisson’s Ratio of Concrete in Compression. ASTM, 2002, 1-5.
[3] H. Huang, L. Liu, F. C. Sham, Y. S. Chan, S.
P. Ng, Optical Strain Gauge vs. Traditional Strain Gauges for Concrete Elasticity Modulus
Determination. Optik - International Journal
for Light and Electron Optics, 121, 2010, 1635-1641.
[4] M. Huang, L. Jiang, P. K. Liaw, C. R. Brooks,
R. Seeley, D. L. Klarstrom. Using Acoustic Emission in Fatigue and Fracture Materials
Research. JOM – The Minerals, Metals &
Materials Society, 50(11), 1998, 1-12.
[5] M. Korenska, L. Padzera, M. Manychova.
Effects of Material Structure of Concrete on
Acoustic Emission Signal Parameters.
European Working Group on Acoustic Emission (EWGAE), 2010.
[6] T. C. Chu, W. F. Ranson, M. A. Sutton,
Applications of digital-image-correlation
techniques to experimental mechanics.
Experimental Mechanics, 25, 1985, 232-244.
[7] M. A. Sutton, M. Cheng, W. H. Peters, Y. J.
Optimized Digital Correlation Method to Planar Deformation Analysis. Image Vision Computer, 4, 1986, 143-150.
[8] H. Bruck, S. McNeill, M. A. Sutton, W.
Peters. Digital Image Correlation Using
Newton-Raphson Method of Partial
Differential Correction. Experimental
Mechanics, 29, 1989, 261-267.
[9] P. F. Luo, Y. J. Chao, M. A. Sutton, W. H.
Peters. Accurate Measurement of Three
Dimensional Deformations in Deformable and
Rigid Bodies Using Computer Vision.
Experimental Mechanics, v. 33, 1993, 123-132.
[10] Y. H. Huang, C. Quan, C. J. Tay, L. J. Chen.
Shape Measurement by The Use of Digital
Image Correlation. Optical Engineering,
40(8), 2005, 1-7.
[11] G. Vendroux, W. G Knauss, Submicron
Deformation Field Measurements: part2.
Improved Digital Image Correlation.
Experimental Mechanics, 38(2),1998, 86-92.
[12] Y. Y. Hung, Shearography: A New Optical
Method for Strain Measurement and
Nondestructive Testing. Optical Engeeniring, 21(3),1982, 391-395.
[13] Y. H. Huang, S. P. Ng, L. Liu, Y. S. Chen, Y.
Y. Hung, Shearographicphase Retrieval Using One Single Specklegram: A Clustering Approach. Optical Engeenring, 47(5), 2008, 15-22.
[14] M. A. Sutton, S. R. Mcneill, J. D. Helm, Y. J.
Chao. Advances in Two-Dimensional and
Three-Dimensional Computer Vision. Topics
in Applied Physics, 77, 2000, 323-372.
[15] F. Lagattu, J. Brillaud, M. C. Lafarie-Frenot.
High strain gradient measurements by using
digital image correlation technique. Materials
Characteristic, 53, 2004, 17–28.
[16] WD. Lockwood, B. Tomaz, A. P. Reynolds
Mechanical response of friction stir welded
AA2024: experiment and modeling. Materials
Science Engineering, A323, 2002, 348–53.
[17] A. P. Reynolds, F. Duvall. Digital image
correlation for determination of weld and base metal constitutive behavior. Welding Journal
78(10), 1999, 355–360.
[18] W. D. Lockwood, A. P. Reynolds, Simulation
of the global response of a friction stir weld
using local constitutive behavior. Materials
Science Engineering, A339(1-2) 2003, 35–42.
[19] J. Yan, M. A. Sutton, A. P. Reynolds, A.
Samer, D. Horsley. Characterization of heterogeneous response of pipeline steel weld
using digital image correlation. In:
Proceedings of the 2006 SEM annual conference and exposition on experimental
and applied mechanics, St Louis, Missouri, USA, 2006, vol. 1. 90–96.
[20] W. H. Peters, W. F. Ranson, Digital Imaging
Techniques in Experimental Stress Analysis. Optical Engineering, 21, 1981, 427-431.
[21] S. Choi, S. P. Shah, Measurement of
Deformations on Concrete Subjected to
Compression Using Image Correlation.
Experimental Mechanics, 37, 1997, 307-313.
[22] B. Pan, K. Quian, H. Xie, A. Asundi.
Two-dimensional Digital Image Correlation for in-plane Displacement and Strain Measurement:
A Review. Measurement Science and
Technology, 20, 2009, 1-17.
[23] N. McCormick, J. Lord. Digital Image
Correlation for Structural Measurements. Civil Engineering, 165, 2012, 185-190.
[24] M. A. Sutton, J. J. Orteu, H. W. Schreier.
Image Correlation for Shape, Motion and Deformation Measurements - Basic Concepts, Theory and Applications, Springer, 2009.
[25] D. Corr, M. Accardi, L. Grahan-Brady, S. P.
Shah. Digital Imaging Correlation Analysis of Interfacial Debonding Properties and Fracture Behavior in Concrete. Engineering Fracture Mechanics. 74(1-2), 2007, 109-121.
[26] J. D. Helm, Digital Image Correlation for
Specimens with Multiple Growing Cracks. Experimental Mechanics, 48, 2008, 753-762.
[27] K. V. Subramanian, M. Ali-Ahmad, M.
Ghosn. Freeze- Thaw Degradation of FRP-Concrete Interface: Impact on Cohesive Fracture Response. Engineering Fracture Mechanics, 75(13), 2008, 3924–3940.
[28] Z. Wu, H. Rong, J. Zheng, F. Xu, W. Dong.
An Experimental Investigation on the fpz Properties in Concrete Using Digital Image Correlation Technique. Engineering Fracture Mechanics, 78, 2011, 2978-2990.
[29] L. Robert, F. Nazaret, J.-J. Orteu, T. Cutard.
Use of 3-D Digital Image Correlation to characterize the mechanical behavior of a
Fiber Reinforced Refractory Castable,
Experimental Mechanical. 47(6), 2007, 761-773.
[30] M.A. Sutton, J.H. Yan, V. Tiwari, H.W.
Schreier, J.J. Orteu; The effect of out of plane motion on 2D and 3D digital image correlation
measurements. Optics and Lasers in
Engineering, 46(11), 2008, 746-757.
[31] P. C. Guetti. Contribuição ao Estudo das