Uniformity microsprinkler irrigation system using statistical quality control
Uniformidade da irrigação por microaspersão utilizando o controle estatístico de qualidade Maurício Guy de Andrade1* Marcio Antonio Vilas Boas1 Jair Antonio Cruz Siqueira2
Mireille Sato2 Jonathan Dieter3 Eliane Hermes3 Erivelto Mercante1
ISSNe 1678-4596
INTRODUCTION
Micro sprinkler irrigation produces positive yields in relation to water savings and increases crop productivity, but one of the concerns is the uniform distribution, which is the spatial distribution irrigation applied in a regular way throughout the area, once micro sprinklers tend to have low uniformity of application over the wet area (KOUMANOV et al., 2006).
Uniformity is also an important factor in the acquisition of equipment (BRAUER et al., 2011) and it is one of the most important elements for
irrigation, since it directly influences the agricultural
productivity (BRAUER et al., 2011; JUSTI et al., 2010; BRENNAN, 2008; KELLER, 2002).
For the analysis of irrigation parameters such as uniformity, statistic quality control techniques
can be used, such as Shewhart control charts and process capability index. JUSTI et al. (2010) used the process quality control by means of the control charts and/or process capability index to evaluate a sprinkler irrigation system, as well as HERMES et al. (2015), HERMES et al. (2014), HERMES et al. (2013), KLEIN et al. (2015) and JUCHEN et al. (2013) also used the statistic tools of process quality control, but in a drip irrigation system. All these authors concluded that the process capability index is directly proportional to the increase of the system uniformity, with the ability to monitor the irrigation control within satisfactory limits, besides the control charts contribute to the monitoring of the irrigation process.
Therefore, presuppose that the greater the spacing between micro sprinklers lower is the uniformity of irrigation distribution, considering the reliable tools of statistical quality control for more
1Programa de Pós-graduação em Engenharia Agrícola (PGEAGRI), Universidade Estadual do Oeste do Paraná (UNIOESTE), 85819-110, Cascavel,
PR, Brasil. E-mail: [email protected]. *Corresponding author.
2Programa de Pós-graduação em Engenharia de Energia na Agricultura (PPGEA), Universidade Estadual do Oeste do Paraná (UNIOESTE), Cascavel, PR, Brasil. 3Departamento de Engenharias e Exatas (DEE), Universidade Federal do Paraná (UFPR), Palotina, PR, Brasil.
ABSTRACT: The objective of this study was to evaluate the use of statistical quality control tools in the analysis of the uniformity of a microsprinkler irrigation system. For the analysis of irrigation Christiansen uniformity coefficient (CUC) and the distribution uniformity coefficient (DU) were statistically analyzed by means of the Shewhart control charts and process capability index (Cp). For the experiment 25 tests were carried out with a single micro sprinkler and subsequently seven different spacing between micro sprinklers were simulated. Control charts contributed to the diagnosis of the treatments to be under control and with satisfactory uniformity outcomes. Increase in process capability index was directly proportional to the average of CUC and DU.
Key words: Christiansen uniformity coefficient, distribution uniformity coefficient, control charts, process capability index.
RESUMO: O estudo objetivou avaliar o uso das ferramentas do controle estatístico de qualidade na análise da uniformidade de um sistema de irrigação por microaspersão. Para a análise da irrigação foram utilizados os coeficientes de uniformidade de Christiansen (CUC) e o coe-ficiente de uniformidade de distribuição (CUD), e estes foram analisados estatisticamente através dos gráficos de controle de Shewhart e do índice de capacidade do processo (Cp). Para o experimento foram realizados 25 ensaios com um único microaspersor, sendo posteriormente simulados sete diferentes espaçamentos entre microaspersores. Os gráficos de controle contribuíram para o diagnóstico dos tratamentos sob controle e com resultados satisfatórios de uniformidade. O aumento do índice de capacidade do processo mostrou-se diretamente proporcional as médias dos valores de CUC e CUD.
Palavras-chave: coeficiente de uniformidade de Christiansen, coeficiente de uniformidade de distribuição, gráficos de controle, índice de
capacidade do processo.
accurate diagnoses on the variability during the process. In accordance with the stated, the objective was to evaluate statistical control tools, the Shewhart control charts and the process capacity index, for the
analysis of distribution uniformity coefficients.
MATERIALS AND METHODS
Irrigation tests took place in the CASA Project Laboratory (Alternative Energy Systems Analysis Center), at the Universidade Estadual do Oeste do Paraná (UNIOESTE), campus Cascavel,
without the influence of external factors such as solar
radiation and wind.
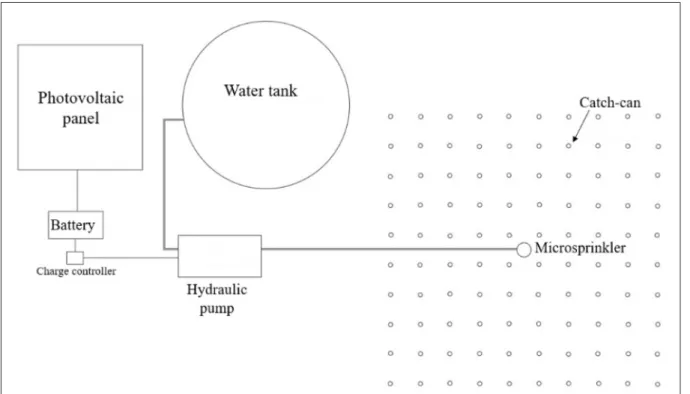
For the conduction of irrigation tests a system powered by solar energy by means of a photovoltaic panel composed of three modules with nominal power of 50W was assembled. Such a solar energy system was connected to an energy storage unit which was connected to a charge controller. The hydraulic pump used is a diaphragm one with a
maximum flow rate of 490L h-1 and with manometric
capacity of 207kPa. The micro sprinkler has a wet diameter of 6.0m, a 41L h-1 flow when working under
a pressure of 200kPa and the equipment is 0.25m high from soil (Figure 1).
The adopted methodology for data collection use a total of 100 catch-can collectors were positioned in a mesh pattern, with a 0.50m gap between them. The test time used was one-hour and, with completely randomized design was chosen, with 25 replicates for treatment, with the following: T1 - 1.0m x 1.0m spacing; T2 - 1.0m x 1.5m spacing; T3 - 1.5m x 1.0m spacing; T4 - 1.5m x 1.5m spacing; T5 - 1.5m x 2.0m spacing; T6 - 2.0m x 1.5m spacing; T7 - 2.0m x 2.0m spacing.
For each of these spacing combination simulation it was calculated the uniformity with the totals overlaid on each collector and also average, standard deviation, normality by the ANDERSON & DARLING (1952) method, data autocorrelation and
coefficient of variation.
In order to evaluate the irrigation system,
it was used the Christiansen Uniformity Coefficient
(CUC), proposed by CHRISTIANSEN (1942) and the
Distribution Uniformity Coefficient (DU), developed
by MERRIAM & KELLER (1978).
To monitor the uniformity coefficients
Shewhart control charts were built, aiming to investigate the parameters during testing, making it necessary to calculate the Upper Control Limit (UCL) and Lower Control Limit (LCL), using equations 01 and 02, in order to determine the graphs.
(1),
(2), in which USL = upper control limit; LCL = lower control limit;
x
=
average; MR = mobile range of observations; d2 = predetermined value (tabulated = 3.931).In order to evaluate the process capability, the methodology proposed by MONTGOMERY (2009) was used, in which the process capability index (Cp) is calculated and then used when the process is stable, that is, with statistical control and when the distribution of variable of interest is close to normal. When the process is stable, Cpk (unilateral
processes), defined according to the equations 3 and
4, is applied. Cpk is the lower value between Cpu (upper) and Cpl (lower), as shown in equation 05. (3), (4), (5)
in which σ = standard deviation.
The process classification for uniformity
values proposes as capable or suited those with
Cp≥1.45, given that processes are considered new and with unilateral specifications (MONTGOMERY, 2009).
RESULTS AND DISCUSSION
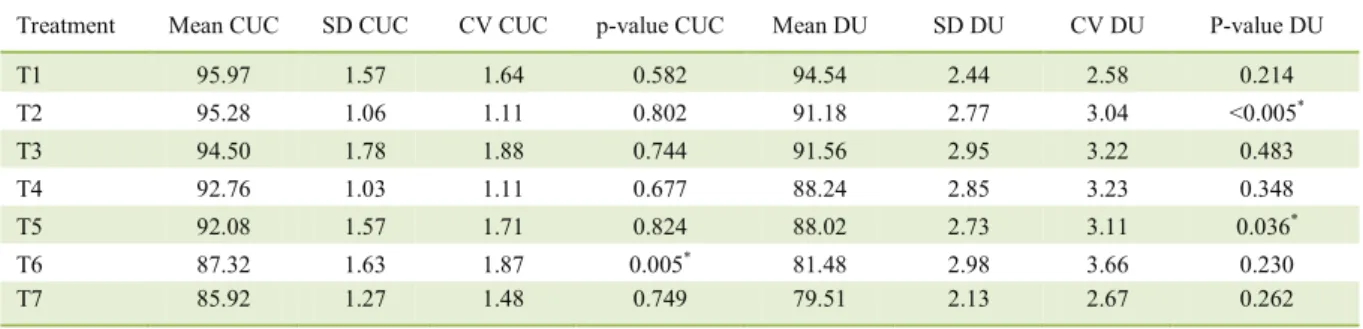
CUC and DU averages increased as the spacing between the micro sprinklers was smaller (Table 1). Standard deviation is higher for DU values
when compared to CUC, significantly influencing the
calculation of the process capability index.
The tests showed high uniformity levels, with CUC values from 85.92% to 95.97%, similar to those reported by HOLANDA FILHO et al. (2001) who performing the hydraulic characterization of a micro sprinkler, obtained CUC results from 85.2% to 96.6%, similar to the average values of SILVA & SILVA (2003) of 95.47%, considered from good to excellent
according to MANTOVANI (2002) classification.
When compared to other irrigation systems, CUC and DU values are correlated with the current tests, as well as with the results of FARIA
et al. (2016) that, when evaluating the influence of
wind on a sprinkler irrigation system with movable side reported CUC between 85% and 93.86% and DU from 76.71% to 89.26%. The high values of
the coefficients were due to the control of variable
pressure, use of a new micro sprinkler and use of an energy storage system.
For subsequent building of Shewhart control charts and calculation of the process capability index is suggested, according to MONTGOMERY (2009), that data is normally distributed and have no autocorrelation between them. According to the
Anderson-Darling normality test, with a significance
level of 5%, for CUC, treatment with T6 is not normal and treatments with DU, T2 and T5 are not normal (Table 1). Data autocorrelation was detected in treatment 2 in the case of CUC and treatment T1 in the case of DU; therefore, such treatments and those that did not presented normality were discarded for statistical quality control techniques purposes.
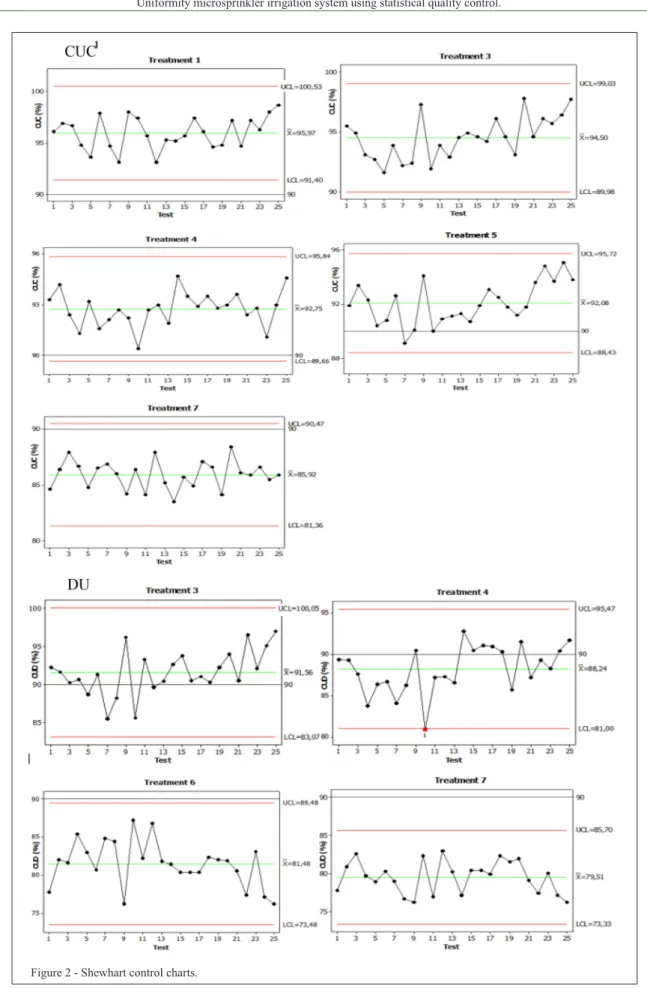
From Shewhart control charts (Figure 2) building and from the analysis of the CUC, it is possible to notice that treatments T1, T3, T5 and T7 are under control because none of them reaches points outside the upper and lower control limits nor presents undesirable settings as a trend or sequence (MONTGOMERY, 2009). Treatment T4 does not reach any points outside the control limits, but presents a sequence below midline, from tests 14 to 20 which is an indication of lack of control. For MONTGOMERY (2009), when seven consecutive values are above or below the midline it constitutes a data tendency and by assumption a probable lack of statistical control.
Analyzing the data distribution in relation to the 90% value line, which is for MANTOVANI (2002) the minimum irrigation uniformity value
that can be classified as excellent, T1 and T3 have
all values above the line and so they are the most appropriate spacing in relation to the distribution uniformity for CUC parameter, according to the control chart.
Regarding the illustrated DU parameter in
figure 2, T3, T5 and T7 treatments are under statistical
control and although treatment T7 of the tests 15 to 20 have values above midline, it is not considered as a trend (MONTGOMERY, 2009). Treatment T4 does not presents statistical control because test 10 is below the lower control limit, even if its values are above the 80%
line and classified as good, according to BRALTS (1986).
As demonstrated in the control charts for the DU, no treatment presents all data above 90%, to
be classified as excellent and only treatment T3 has
all values above 80% rated as good uniformity, due to
HERMES et al. (2013), HERMES et al. (2014) e HERMES et al. (2015) analyzing drip
irrigation based on Shewhart control charts verified
the occurrence of values below the lower control limit. JUCHEN et al. (2013) applied the control charts for drip irrigation for lettuce crop and obtained all tests results under control. JUSTI et al. (2010) using Shewhart control charts to study the uniformity of sprinkler irrigation detected one of the tests above the upper control limit (UCL) and none below the lower control limit (LCL).
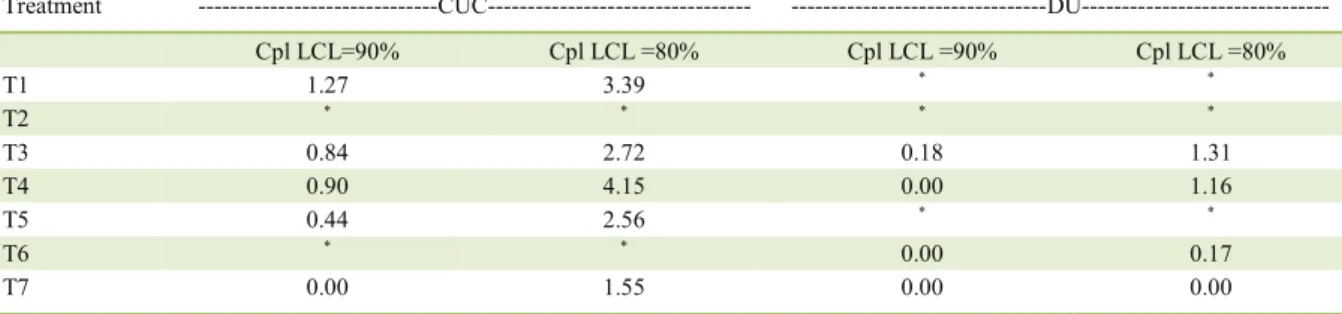
Regarding the process capability index (Table 2) it was only considered the lower limit control.
The value of 80% was classified as good and 90% as
excellent for CUC and DU. Analyzing the new processes
and unilateral specifications, MONTGOMERY (2009) classifies values above 1.45 as appropriate process.
Therefore, for CUC is noted that when considering LCL = 90% there are no appropriate treatments, but when considering LCL = 80%, all available treatments were considered appropriate. It has also been observed that for DU parameter no treatment was considered adequate in both LCLs.
Although most processes are classified as insufficient, there has been a directly proportional
behavior between the average of uniformity
coefficients and Cpl, and for CUC parameter the
relationship between variables is expressed by the equation CUC (%) = 87.107 + 7.4473Cpl, with a
coefficient of determination of R² = 88.13% for LCL
= 90%; however when applying LCL = 80% for CUC the equation is CUC (%) = 84.12 + 2.8273 Cpl, with
R² = 50.85%.
For CUD parameter, the relationship between the variables cannot be expressed for
LCL=90%, considering that most of the values were equal to zero. Though for LCL = 80% the relationship can be expressed by DU (%) = 79.70 + 8.4425 Cpl,
with R² = 98.26.
Equations for the CUC parameter with LCL=90% and DU with LCL = 80% showed a strong correlation between the variables, because they both have
high R² values. For each Cpl unit that can be controlled
in the process the value of the CUC and DU increases by 7.4473 and 8.4425 respectively; thus, demonstrating the importance of controlling the variability of the process to acquire high uniformity values.
For studies with drip irrigation, HERMES et al. (2013), HERMES et al. (2014) e KLEIN et al. (2015) detected that as CUC value increases, the process capacity index also increases, with a
coefficient of determination R2 of 70.35%, 61% and
91.84%, respectively. The same relation is established to DU values, according to HERMES (2015), with a R2 of 70.10% for LCL = 90% and 85.7% for LCL =
80%. JUSTI et al. (2010) also concluded the directly
proportional relation of uniformity coefficients with
Cpl and R2 of 78% when they studied the sprinkler
irrigation process.
In the research, according to the control tools used, variations of the tests; however, minor,
manly pressure, influenced the proper ratings of
processes, even with high uniformity values, these being proper tools for the diagnosis of uniformity micro sprinkler irrigation.
CONCLUSION
Control charts were adjusted to detect the treatments under control and the most suitable spacing
Table 1 - Descriptive statistics of uniformity coefficients.
Treatment Mean CUC SD CUC CV CUC p-value CUC Mean DU SD DU CV DU P-value DU
T1 95.97 1.57 1.64 0.582 94.54 2.44 2.58 0.214
T2 95.28 1.06 1.11 0.802 91.18 2.77 3.04 <0.005*
T3 94.50 1.78 1.88 0.744 91.56 2.95 3.22 0.483
T4 92.76 1.03 1.11 0.677 88.24 2.85 3.23 0.348
T5 92.08 1.57 1.71 0.824 88.02 2.73 3.11 0.036*
T6 87.32 1.63 1.87 0.005* 81.48 2.98 3.66 0.230
T7 85.92 1.27 1.48 0.749 79.51 2.13 2.67 0.262
the detected treatments are 1.0m x 1.0m spacing for
Christiansen uniformity coefficient and 1.5m x 1.0m spacing for distribution uniformity coefficient.
The process capacity index increase is directly proportional to CUC and DU average test value, with R2 above 80% in most cases, with smaller
spacing with higher index capacity. Therefore, the statistical quality control is adequate for the analysis of the distribution uniformity of the micro sprinkler.
REFERENCES
ANDERSON, T. W.; DARLING, D. A. Asymptotic theory of
certain goodness-of-fit criteria based on stochastic processes. Annals of Mathematical Statistics, v.23, p.193-221, 1952.
BRALTS, V. F. Field performance and evaluation. In: NAKAYAMA, F. S.; BUCKS, D. A. (Eds.). Amsterdam, 1986. p.216-240.
BRAUER, R. L. et al. Evaluation of the uniformity of water application in drippers as a function of iron content. Irriga, v.16, n.1, p.21-30, 2011. Available from: <http://revistas.fca.unesp. br/index.php/irriga/article/viewFile/188/97>. Accessed: Oct. 20, 2015. doi: 10.15809/irriga.2011v16n1.
BRENNAN, D. Factors affecting the economic benefits of sprinkler uniformity and their implications for irrigation water use. Irrigation Science, v.26, n.2, p.109-119, 2008. Available from: <http://link.springer.com/article/10.1007/ s00271-007-0077-9>. Accessed: Sept. 29, 2016. doi: 10.1007/s00271-007-0077-9.
CHRISTIANSEN, J. E. Irrigation by sprinkling. Berkely: University of California, Experiment Station, 1942. 124p. Bulletin, 670.
FARIA, L. C. et al. Influence of the Wind on water application uniformity of a mechanical lateral move irrigation equipment using rotating plate sprinklers. Ciência Rural, v.46, n.1, p.83-88, 2016. Available from:
<http://www.scielo.br/pdf/cr/v46n1/1678-4596-cr-0103_8478cr20141558.pdf>. Accessed: Jan. 23, 2016. doi: 10.1590/0103-8478cr20141558.
HERMES, E. et al. Process capacity index in drip irrigation with cassava wastewater processing. African Journal of Agricultural Research, v.10, p.1427-1433, 2015. Available from: <http:// www.academicjournals.org/journal/AJAR/article-full-text-pdf/8F6687551836>. Accessed: July 30, 2015. doi: 10.5897/ AJAR2015.9610.
HERMES, E. et al. Irrigation with wastewater from cassava processing with diferente concentrations of suspended solids.
International Journal of Food, Agriculture and Environment
(Print), v.12, p.487-490, 2014. Available from: <http://world- food.net/irrigation-with-wastewater-from-cassava-processing-with-different-concentrations-of-suspended-solids>. Accessed: Aug 07, 2015.
HERMES, E. et al. Quality control in irrigation and fertigation with cassava processing wastewater into drip system.
International Journal of Food, Agriculture and Environment
(Print), v.11, p.841-845, 2013. Available from: <http://world- food.net/quality-control-in-irrigation-and-fertigation-with-cassava-processing-wastewater-into-drip-system>. Accessed: Aug 07, 2015.
HOLANDA FILHO, R. et al. Hydraulic characterization of the Plastro Rondo microsprinkler. Revista Brasileira de Engenharia Agrícola e Ambiental, v.5. n.1, p.16-21, 2001. Available from: <http://www.scielo.br/scielo. php?script=sci_arttext&pid=S1415-43662001000100004>. Accessed: July 30, 2015.
JUCHEN, C. R. et al. Drip irrigation for the production of fertirrigated lettuce with agroindustrial wastewater. Irriga, v.18, n.1, p.243-256, 2013. Available from: <http://irriga.fca.unesp.br/ index.php/irriga/article/view/408/364>. Accessed: Sept. 27, 2016. doi: 10.15809/irriga.2013v18n2p243.
JUSTI, A. L. et al. Índice de capacidade do processo na avaliação da irrigação por aspersão. Eng Agríc, v.30, n.2, p.264-270, 2010. Available from:<http://www.scielo.br/scielo. php?script=sci_arttext&pid=S0100-69162010000200008>. Accessed: 30 July, 2015.
Table 2 - Process capability index.
Treatment ---CUC--- ---DU---
Cpl LCL=90% Cpl LCL =80% Cpl LCL =90% Cpl LCL =80%
T1 1.27 3.39 * *
T2 * * * *
T3 0.84 2.72 0.18 1.31
T4 0.90 4.15 0.00 1.16
T5 0.44 2.56 * *
T6 * * 0.00 0.17
T7 0.00 1.55 0.00 0.00
KELLER, J. Evolution of drip/microirrigation: traditional and non-traditional uses. Keynote address, International Meeting on Advances In Drip/Microirrigation, p. 2-5, December, 2002, Tenerife, Spain.
KLEIN, M. R. et al. Fertigation quality with drip irrigation system in grape orchard by using the process capability index. International Journal of Food, Agriculture and Environment, v.13, p.179-183, 2015. Available from: <http:// world-food.net/fertigation-quality-with-drip-irrigation-system-in-grape-orchard-by-using-the-process-capability-index>. Accessed: 07 Aug, 2015.
KOUMANOV, K. S. et al. Spatial and temporal distribution of root water uptake of an almond tree under microsprinkler irrigation. Irrigation Science, v. 24, n. 267, 2006. Available from: <http://link.springer.com/ article/10.1007/s00271-005-0027-3>. Accessed: 30 Jun, 2015.
MANTOVANI, E. C. Avalia: manual do usuário. Viçosa, EMBRAPA, 2002. 100p.
MERRIAN, J. L.; KELLER, J. Farm irrigation system evaluation: a guide for management. Logan: Agricultural and Irrigation, Engineering Department, 1978. Chapter XI: Basin Irrigation.
MONTGOMERY, D. C. Introdução ao controle estatístico de qualidade. Tradução: FARIAS, A. M. L., FLORES, V. R. L. F., LAURENCEL, L. C. 4. Editora LTC, 2009.