PERFORMANCE OF A RECIPROCAL SHAKER IN
MECHANICAL DISPERSION OF SOIL SAMPLES FOR
PARTICLE-SIZE ANALYSIS
(1)Thayse Aparecida Dourado(2), Laura Fernanda Simões da Silva(3) & Mara de Andrade Marinho(4)
SUMMARY
The dispersion of the samples in soil particle-size analysis is a fundamental step, which is commonly achieved with a combination of chemical agents and mechanical agitation. The purpose of this study was to evaluate the efficiency of a low-speed reciprocal shaker for the mechanical dispersion of soil samples of different textural classes. The particle size of 61 soil samples was analyzed in four replications, using the pipette method to determine the clay fraction and sieving to determine coarse, fine and total sand fractions. The silt content was obtained by difference. To evaluate the performance, the results of the reciprocal shaker (RSh) were compared with data of the same soil samples available in reports of the Proficiency testing for Soil Analysis Laboratories of the Agronomic Institute of Campinas (Prolab/IAC). The accuracy was analyzed based on the maximum and minimum values defining the confidence intervals for the particle-size fractions of each soil sample. Graphical indicators were also used for data comparison, based on dispersion and linear adjustment. The descriptive statistics indicated predominantly low variability in more than 90 % of the results for sand, medium-textured and clay samples, and for 68 % of the results for heavy clay samples, indicating satisfactory repeatability of measurements with the RSh. Medium variability was frequently associated with silt, followed by the fine sand fraction. The sensitivity analyses indicated an accuracy of 100 % for the three main separates
(1)Paper presented at the XXXII Brazilian Congress of Soil Science (Fortaleza, CE, 2-7/08/2009), during both oral and poster sections. Received in August 15, 2012 and approved in May 18, 2012.
(2)Undergraduate student at State University of Campinas, College of Agricultural Engineering - UNICAMP/FEAGRI. Financial support: Scientific Initiation Fellowship from SAE/UNICAMP. Av. Cândido Rondon, 501, Bairro Barão Geraldo. CEP 13083-875 Campinas (SP). E-mail: [email protected]
(3)Substitute Professor at Universidade Estadual Paulista - UNESP - Campus Rio Claro, Dept. of Petrology and Metallogeny, Institute of Geosciences and Exact Sciences. Avenida 24-A, 1515. CEP 13506-900. E-mail: [email protected] (4)Associate Professor at State University of Campinas, College of Agricultural Engineering - UNICAMP/ FEAGRI. E-mail:
(total sand, silt and clay), in all 52 samples of the textural classes heavy clay, clay and medium. For the nine sand soil samples, the average accuracy was 85.2 %; highest deviations were observed for the silt fraction. In relation to the linear adjustments, the correlation coefficients of 0.93 (silt) or > 0.93 (total sand and clay), as well as the differences between the angular coefficients and the unit < 0.16, indicated a high correlation between the reference data (Prolab/IAC) and results obtained with the RSh. In conclusion, the mechanical dispersion by the reciprocal shaker of soil samples of different textural classes was satisfactory. The results allowed recommending the use of the equipment at low agitation for particle size- analysis. The advantages of this Brazilian apparatus are its low cost, the possibility to simultaneously analyze a great number of samples using ordinary, easily replaceable glass or plastic bottles.
Index terms: soil texture, pipette method, mechanical dispersion, accuracy analysis.
RESUMO: AVALIAÇÃO DO DESEMPENHO DE MESA AGITADORA
RECIPROCANTE NA DISPERSÃO DE AMOSTRAS DE SOLO PARA FINS DE ANÁLISE GRANULOMÉTRICA
A dispersão da amostra de solo é uma etapa fundamental da análise granulométrica, sendo realizada mediante o uso de dispersantes químicos e agitação mecânica. O objetivo deste trabalho foi avaliar a eficiência de mesa agitadora reciprocante de baixa rotação na dispersão mecânica de amostras de solos de diferentes classes texturais. Foram realizadas análises granulométricas em 61 amostras com quatro repetições, empregando o método da pipeta para determinação da fração argila e tamisagem para determinação das frações areia grossa, areia fina e areia total, sendo o silte determinado por diferença. Na avaliação de desempenho, os resultados obtidos com uso da mesa agitadora reciprocante (MAR) foram comparados com dados disponíveis para as mesmas amostras oriundos de relatórios do Ensaio de Proficiência IAC para Laboratórios de Análises de Solos - Prolab/IAC. Análises de acurácia foram realizadas com base nos valores dos intervalos de confiança definidos para cada fração granulométrica componente de cada amostra ensaiada. Indicadores gráficos também foram utilizados na comparação de dados, por meio de dispersão e ajuste linear. A estatística descritiva indicou preponderância de baixa variabilidade em mais de 90 % dos resultados obtidos para as amostras de texturas arenosa, média e argilosa e em 68 % dos obtidos para as amostras de textura muito argilosa, indicando boa repetibilidade dos resultados obtidos com a MAR. Média variabilidade foi mais frequentemente associada à fração silte, seguida da fração areia fina. Os resultados das análises de sensibilidade indicam acurácia de 100 % nas três frações granulométricas - areia total, silte e argila - para todas as amostras analisadas pertencentes às classes texturais muito argilosa, argilosa e média. Para as nove amostras de textura arenosa, a acurácia média foi de 85,2 %, e os maiores desvios ocorreram em relação à fração silte. Nas aproximações lineares, coeficientes de correlação igual (silte) ou superiores (areia total e argila) a 0,93, bem como diferenças menores do que 0,16 entre os coeficientes angulares das retas e o valor unitário, indicam alta correlação entre os resultados de referência (Prolab/IAC) e os obtidos nos ensaios com a MAR. Conclui-se pelo desempenho satisfatório da mesa agitadora reciprocante de baixa rotação para dispersão mecânica de amostras de solo de diferentes classes texturais para fins de análise granulométrica, permitindo recomendar o uso alternativo do equipamento quando se emprega agitação lenta. As vantagens do uso do equipamento nacional incluem o baixo custo, a possibilidade de análise simultânea de grande número de amostras e o uso de frascos comuns, de vidro ou de plástico, baratos e de fácil reposição.
INTRODUCTION
Soil texture is based on different combinations of sand, silt, and clay separates that define the particle-size distribution of a soil sample (Gee & Or, 2002). Particle-size distribution is a natural and permanent soil property and one of the most frequently used for soil characterization (Hillel, 1982). Because of the correlation between specific surface and particle size, the percentage distribution of the various sizes of individual particles within a soil is an important soil characteristic (Baver et al., 1972). The particle-size distribution of a soil is determined by particle-size analysis. Particle-size analysis is defined as a measurement of the size distribution of the individual (primary) particles in a soil sample, according to texture fractions in a given classification scheme (Baver et al., 1972; Gee & Or, 2002). The analysis of particle sizes is a common and essential physical analysis of the soil, for which conventionally “fine earth” is used, or the soil fraction that can be sieved through 2 mm mesh. The size limits of the three main fractions of soil particles sand, silt and clay are given by diameter ranges, according to different scales. The sand fraction contains the largest particles, with diameters between 2.0 and 0.02 mm (ISSS) or 2.0 and 0.05 mm (USDA). Silt consists of medium-sized particles, with diameters from 0.02 to 0.002 mm (ISSS) or from 0.05 to 0.002 mm (USDA), and the clay fraction contains the smallest soil particles, with diameters below 0,002 mm or 0,2 on both scales (Gee & Or, 2002).
Soil texture is widely recognized as being fundamental for soil identification and classification. More recently, particle-size distribution has been widely used as an independent variable in pedotransfer functions for the estimation of more complex soil physical properties (Tomasella et al., 2000, Silva et al., 2008). In the soil, organic matter, iron oxides and carbonates act as cementing agents, keeping the particles together and forming aggregates. The success of particle-size analysis depends firstly on the sample preparation to ensure a complete dispersion of all aggregates into their individual primary particles without breaking up the particles themselves and secondly, on the accurate fractionation of a sample into its different separates (Baver et al., 1972). Thus, the dispersion phase consists of the individualization of the soil primary particles in aqueous suspension, by using chemical agents and physical methods (Gee & Or, 2002). The chemical agents are used to eliminate the flocculating ions, such as Al and Ca, to increase the repulsion between the primary particles, and to stabilize the individual particles in the suspension throughout the analysis (Gee & Or, 2002; Ruiz, 2005). In Brazil, the Brazilian Agricultural Research Corporation - Embrapa (1997) recommends the chemical agents hydroxide (NaOH) or Na-hexametaphosphate buffered with Na-carbonate for normal soils, the use of hydrogen chloride (HCl) at
10 % for calcareous soils, and Na-hexametaphosphate for saline soils. In São Paulo State, the Agronomic Institute of Campinas (IAC) recommends the use of a mixture of Na-hydroxide and Na-hexametaphosphate (Camargo et al., 1986). Sodium can adsorb high quantities of water and when the Na ion is adsorbed on the surface of soil particles it induces repulsion between them, which in turn facilitates the stabilization of the individual particles in suspension. In recent research, Neto et al. (2009) evaluated the effectiveness of different chemical agents for the dispersion of a Rhodic Hapludox irrigated with calcium-rich water. They concluded that the combination of hydrogen chloride (HCl) with Na-hydroxide (NaOH) was the most efficient way of recovering the clay fraction. Classical physical methods of soil dispersion include fast or slow shaking or rolling of the soil suspension. In the past 20 years, electronic dispersion, primarily by the use of sonication, has become increasingly popular (Gee & Or, 2002). In Brazil, Embrapa (1997) recommends the use of electric stirrers at high speed (10,000 to 12,000 rpm) for a short stirring time, varying from 5 min (for sandy soils) to 15 min (for clayey soils). In São Paulo, Grohmann & Raij (1977) demonstrated the superiority of slow shaking for a more efficient soil dispersion and clay determination for soil particle-size analysis performed in the IAC laboratories. Later, Camargo et al. (1986) recommended the use of low-speed stirrers (30 rpm), for example the Wiegner shaker, with longer stirring time, of about 16 h. According to Gee & Or (2002), not only a standardization of the treatments but also the testing of specific methodologies are needed, since the mechanical techniques can result in the fragmentation of the primary particles. The reciprocal shaker evaluated here belongs to the category of slow-speed shakers, for which there are no comparative performance studies based on the results obtained with methodologies and agitators commonly used in the laboratories. The advantages of this reciprocal shaker include its relatively low cost, the capacity to shake a large number (40) of samples simultaneously, and the possibility of using cheap and easy replaceable glass or plastic pots. Given the above, our objective was to evaluate the efficiency of a slow reciprocal shaker for the dispersion of soil samples of different textural classes for particle-size analysis.
MATERIAL AND METHODS
Experimental location and characterization of the soil samples
The tests were conducted with 61 soil samples of different textural classes. According to the textural groups defined by Embrapa (2006), the texture of nine of the soil samples was sandy (containing <150 g kg-1
clay and > 700 g kg-1 sand), of 22 medium (with clay
contents < 350 g kg-1 and > 150 g kg-1), of 20 samples
clayey (with clay contents > 350 g kg-1 and < 600 g
kg-1), and of the last 10 samples the texture was Heavy
Clay (with clay contents > 600 g kg-1).
The samples were selected from a soil bank of the Labsol, due to its participation in the IAC Proficiency Testing for Soil Analyses Laboratories - Prolab/IAC. The choice of this soil sample bank was due to the availability of results of particle-size analyses performed by more than 80 laboratories participating in the program. The data were used as references in the performance evaluation of the reciprocating shaker. The statistical procedures used in the Prolab/ IAC define the average value and the acceptable range of results obtained for each particle-size fraction (coarse sand, fine sand, total sand, silt and clay) for each soil sample (Quaggio et al., 1994). The acceptable range depends on the coefficient of variation (CV) of the results for each particle-size fraction for each soil sample, according to the following criteria: a) for CV 40 %, the acceptable range is the average ± 1.0 standard deviation (s) calculated from the results obtained by all laboratories; b) for CV between 20 and 40 %, the acceptable range is the average ± 1.5 s, and c) for CV < 20 %, the acceptable range of results is the average ± 2.0 s. These data sets of particle-size analyses determined independently and as a part of a soil analysis quality program, were considered appropriate to draw conclusions not only about the accuracy but also on the precision of the results obtained by mechanical dispersion with a reciprocal shaker (RSh).
Analysis methods
The particle-size analyses were carried out by the Pipette Method described by Day (1965) for clay determination, by sieving for separation of the sands and by the difference between the former to obtain silt, according to the procedures described by Embrapa (1997) and Camargo et al. (1986).
a) Principles
The pipette method is a direct sampling procedure based on the particle settling speed in an aqueous suspension according to Stokes’ law (Equation 1). The basic assumptions to apply Stokes’ law to soil suspensions are: a) the terminal velocity is reached as soon as settling begins; b) resistance to settling is entirely due to the viscosity of the fluid; c) particles are smooth and spherical; d) there is no interaction between individual particles in the suspension (Gee & Or, 2002). Since the soil particles are not smooth and spherical, d must be regarded as equivalent rather than actual diameters. The methods of particle-size analysis based on the settling velocity determine the soil particles more precisely according to the settling
time, as defined by equation 2. For clay fraction determination, after the dispersion of the soil sample, the time and the distance of vertical displacement of the particles through the aqueous suspension are fixed, so that only the clay particles remain in suspension at that depth. At the time t, a small subsample is taken from the suspension at depth h, according to equation 2. After oven-drying and subtracting the dispersant weight (blank test), the clay mass of the soil sample is determined. To determine the sand fraction, the soil suspension is passed either through a set of two sieves, to separate the coarse from the fine sand fractions (ISSS), or through a set of five sieves, to separate the sand in very coarse, coarse, medium, fine and very fine (USDA). Then, the sand fractions are oven-dried and weighed for content determinations. After determining the sand and the clay fractions, the silt fraction is calculated by the difference (Camargo et al., 1986; Embrapa, 1997). The pipette method is often used as a standard method and the results of the particle-size analysis are expressed in g kg-1 by theInternational System.
Eq. 1
Eq. 2
b) Analytical procedure
For soils with less than 5 % of organic matter (OM) (< 50 g kg-1), 10 g of the < 2mm fraction of air-dried
soil was weighed and transferred to a 500 mL glass pot with 50 mL of dispersant solution* (a mixture of 20 g of hydroxide PA and 50 g of Na-hexametaphosphate in 5 L of distilled water, stirred with magnetic stirrer until the reagents were dissolved). After closing, the glass pot was placed on the low-speed reciprocal shaker (RSh) for mechanical stirring at 130 rpm for 14-16 h (Figure 1).
The stirring velocity was determined based on preliminary tests at different speeds, which demonstrated that 130 rpm was the ideal rotation speed to promote an effective movement of the suspension within the glass pot. For soils containing more than 5 % of organic matter (> 50 g kg-1), a
pre-treatment was required to eliminate OM as follows: fill 10 g of the < 2mm fraction of air-dried fine earth into a 800 mL beaker, add 200 mL of Na-pyrophosphate 0.1 mol L-1 and 50 mL of hydrogen
peroxide (H2O2 ~30 %), and let it stand overnight.
The next day, maintain at 40 oC in water bath for 8
h, and stir with a glass rod every 2 h. To remove the excess of H2O2, raise the temperature to 80 °C, until
After the stirring period, the suspension was sieved through a 0.053 mm (270 mesh) into a 0.5 L sedimentation cylinder for sand separation. The material retained on the sieve (sand) was transferred to a 0.4 L beaker, and oven-dried at 105 °C. Then the
dried sands were transferred to a set of two sieves: 0.21 mm (coarse sand) and 0.05 mm (fine sand), and shaken for 30 min on a sieve vibrator. The masses of the coarse sand and of the fine sand were weighed (precision 0.01 g).
The volume of the suspended material was completed to 0.5 L and the test tube placed in a water bath. The suspension was stirred for 30 s with a glass rod with a plunger slightly smaller than the cylinder diameter attached to its lower end. The settling time was defined according to the suspension temperature.
After the sedimentation period required for clay recovery only, 10 mL of the suspension were pipetted from a depth of 5 cm, transferred to a tared beaker (precision 0.0001 g), and dried at 105 0C for 24 h.
After drying, the beaker was placed in a desiccator until reaching room temperature, then weighed (precision 0.0001 g) and the weight of the clay + dispersing agents determined.
A blank test was performed to determine the weight of the dispersing agents by preparing a solution with the same concentration used in the analysis (50 mL of dispersing solution* in a sedimentation cylinder + water to complete 0.5 L). A 10 mL aliquot of the solution was transferred to a beaker and oven-dried at 105 0C for 24 h. After drying, the beaker was placed
in a desiccator until reaching room temperature; then it was weighed (precision 0.0001 g) to determine the mass of the dispersing agents contained in the 10 mL aliquot. This value was subtracted from the weight of clay + dispersing agents to determine the clay content only.
The silt fraction was calculated by the difference between the sum of the sand and the clay fractions in relation to 1000g, since the results should be expressed in g kg-1 (Camargo et al., 1986; Embrapa, 1997). For
each soil sample, particle-size analysis was performed in four replications.
c) Statistical analysis of the particle-size analysis results and performance evaluation of the reciprocal low speed shaker (RSh)
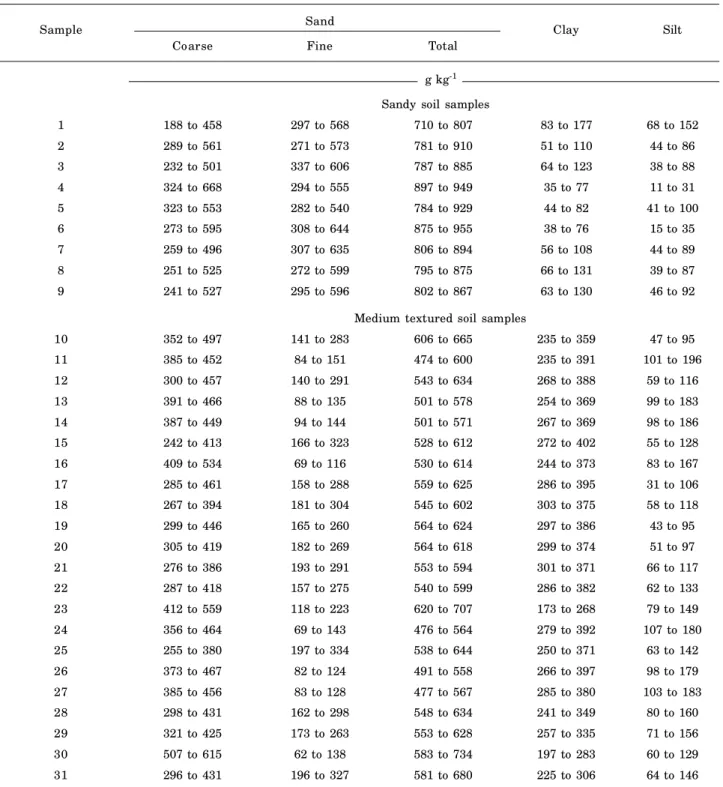
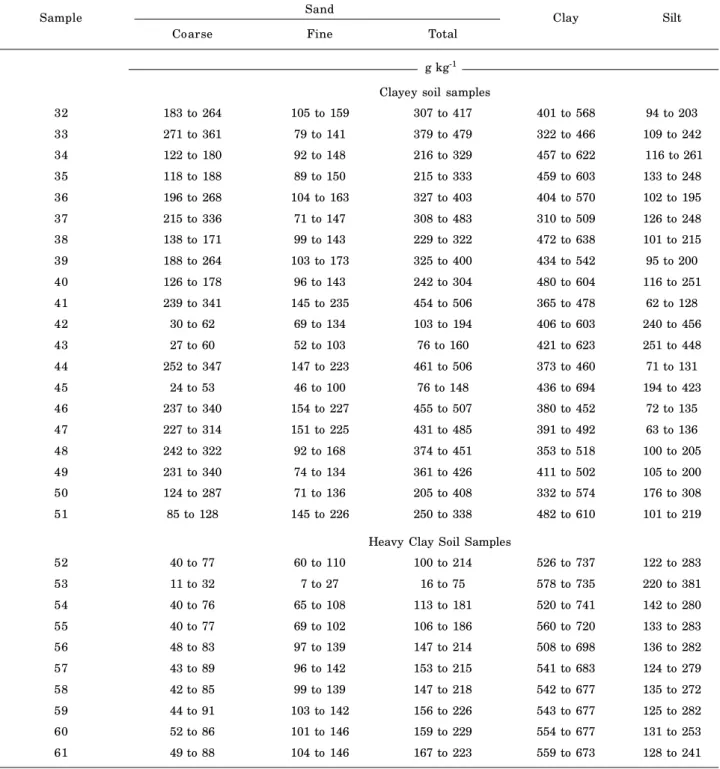
The results were subjected to descriptive analysis to determine the following values: mean, standard deviation, and the maximum, minimum and coefficient of variation, using the SAS statistical program. The data variability, expressed by the coefficient of variation (CV %), was evaluated according to the Warrick & Nielsen (1980) criteria, by which coefficients below 12 % indicate low variability; the coefficients varying between 12 and 60 % medium variability; and the coefficients > 60 % high variability. For a performance analysis and to validate the results obtained with the RSh, the data accuracy was analyzed (Fletcher et al., 1986), based on confidence intervals (IC) as the criteria of acceptance, as defined by the particle-size data of the analysis performed with the same samples by the laboratories of the Prolab/ IAC program (Tables 1 and 2). Graphic indicators were also used to compare the results, using the
ORIGINPROR 7.5 software, which visualized data
dispersion and the linear fit between the average content of a given particle-size fraction (sand, silt or clay) for each soil sample (reference data obtained from the Prolab/IAC program) and the value obtained using the RSh.
RESULTS AND DISCUSSION
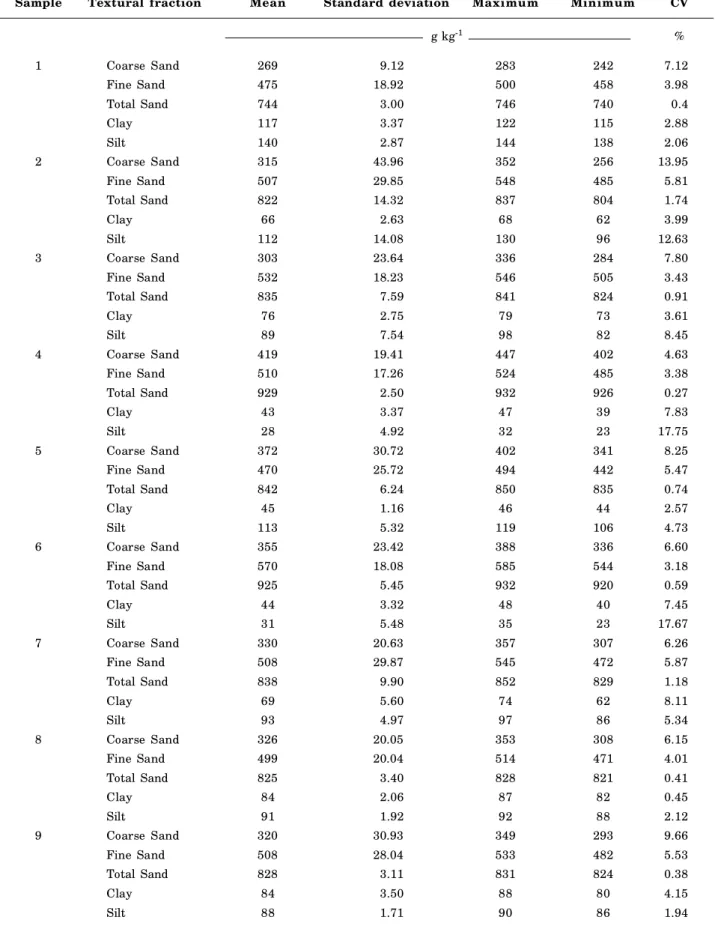
The results of the descriptive analysis for coarse sand, fine sand, total sand, clay and silt fractions for nine sandy soil samples (containing < 150 g kg-1 clay
and > 700 g kg-1 sand) are shown in Table 3. For all
sandy samples (9), the coefficients of variation (CV) of the results for fine sand, total sand and clay were lower than 12 %, indicating low variability. The variability in the results for coarse sand was also low, except for sample 2, for which the CV of 13.95 % indicated medium variability, according to the criteria of Warrick & Nielsen (1980). For silt, medium variability was observed for three samples (2, 4 and 6); however, for the remaining six samples, variability was also low. In general, low variability was characterized for 91 % of the results obtained for the sandy soil samples.
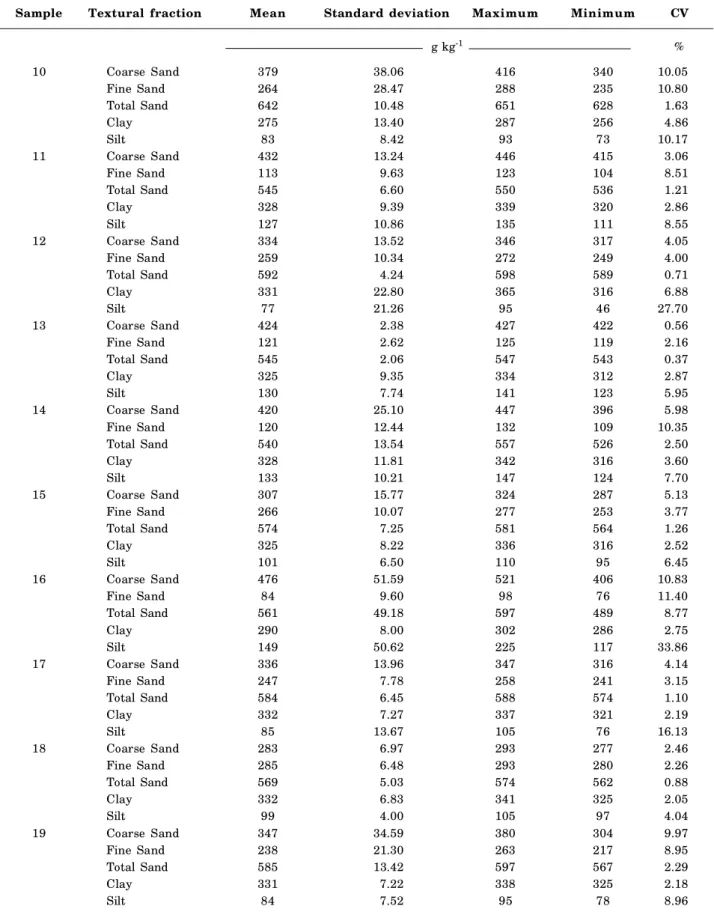
The results shown in table 4 were obtained from 21 medium-textured soil samples. For almost 92 % of the data, including coarse sand, total sand and clay fractions of all tested samples, variability was low Figure 1. A view of the reciprocal shaker (RSh) as
(CV 12 %); medium variability (12 CV 60 %) was only observed for fine sand (samples 22, 23 and 27) and silt (samples 12, 16, 17, 27 and 30).
For the set of 20 clayey soil samples, variability was low in 93 % of the results; for 15 samples, variability was low for all fractions: coarse sand, fine
Sample Sand Clay Silt
Coarse Fine Total
g kg-1 Sandy soil samples
1 188 to 458 297 to 568 710 to 807 83 to 177 68 to 152
2 289 to 561 271 to 573 781 to 910 51 to 110 44 to 86
3 232 to 501 337 to 606 787 to 885 64 to 123 38 to 88
4 324 to 668 294 to 555 897 to 949 35 to 77 11 to 31
5 323 to 553 282 to 540 784 to 929 44 to 82 41 to 100
6 273 to 595 308 to 644 875 to 955 38 to 76 15 to 35
7 259 to 496 307 to 635 806 to 894 56 to 108 44 to 89
8 251 to 525 272 to 599 795 to 875 66 to 131 39 to 87
9 241 to 527 295 to 596 802 to 867 63 to 130 46 to 92
Medium textured soil samples
10 352 to 497 141 to 283 606 to 665 235 to 359 47 to 95
11 385 to 452 84 to 151 474 to 600 235 to 391 101 to 196
12 300 to 457 140 to 291 543 to 634 268 to 388 59 to 116
13 391 to 466 88 to 135 501 to 578 254 to 369 99 to 183
14 387 to 449 94 to 144 501 to 571 267 to 369 98 to 186
15 242 to 413 166 to 323 528 to 612 272 to 402 55 to 128
16 409 to 534 69 to 116 530 to 614 244 to 373 83 to 167
17 285 to 461 158 to 288 559 to 625 286 to 395 31 to 106
18 267 to 394 181 to 304 545 to 602 303 to 375 58 to 118
19 299 to 446 165 to 260 564 to 624 297 to 386 43 to 95
20 305 to 419 182 to 269 564 to 618 299 to 374 51 to 97
21 276 to 386 193 to 291 553 to 594 301 to 371 66 to 117
22 287 to 418 157 to 275 540 to 599 286 to 382 62 to 133
23 412 to 559 118 to 223 620 to 707 173 to 268 79 to 149
24 356 to 464 69 to 143 476 to 564 279 to 392 107 to 180
25 255 to 380 197 to 334 538 to 644 250 to 371 63 to 142
26 373 to 467 82 to 124 491 to 558 266 to 397 98 to 179
27 385 to 456 83 to 128 477 to 567 285 to 380 103 to 183
28 298 to 431 162 to 298 548 to 634 241 to 349 80 to 160
29 321 to 425 173 to 263 553 to 628 257 to 335 71 to 156
30 507 to 615 62 to 138 583 to 734 197 to 283 60 to 129
31 296 to 431 196 to 327 581 to 680 225 to 306 64 to 146
Table 1. Confidence intervals for coarse, fine and total sand, and silt and Clay contents for nine sandy and 22 medium textured soil samples
Source: Values extracted from the Prolab/IAC reports.
sand, total sand, silt, and clay (Table 5). Medium variability was only inferred for fine sand (samples 37, 39 and 45), coarse sand (sample 43) and silt (samples 37, 41 and 45).
Sample Sand Clay Silt
Coarse Fine Total
g kg-1 Clayey soil samples
32 183 to 264 105 to 159 307 to 417 401 to 568 94 to 203
33 271 to 361 79 to 141 379 to 479 322 to 466 109 to 242
34 122 to 180 92 to 148 216 to 329 457 to 622 116 to 261
35 118 to 188 89 to 150 215 to 333 459 to 603 133 to 248
36 196 to 268 104 to 163 327 to 403 404 to 570 102 to 195
37 215 to 336 71 to 147 308 to 483 310 to 509 126 to 248
38 138 to 171 99 to 143 229 to 322 472 to 638 101 to 215
39 188 to 264 103 to 173 325 to 400 434 to 542 95 to 200
40 126 to 178 96 to 143 242 to 304 480 to 604 116 to 251
41 239 to 341 145 to 235 454 to 506 365 to 478 62 to 128
42 30 to 62 69 to 134 103 to 194 406 to 603 240 to 456
43 27 to 60 52 to 103 76 to 160 421 to 623 251 to 448
44 252 to 347 147 to 223 461 to 506 373 to 460 71 to 131
45 24 to 53 46 to 100 76 to 148 436 to 694 194 to 423
46 237 to 340 154 to 227 455 to 507 380 to 452 72 to 135
47 227 to 314 151 to 225 431 to 485 391 to 492 63 to 136
48 242 to 322 92 to 168 374 to 451 353 to 518 100 to 205
49 231 to 340 74 to 134 361 to 426 411 to 502 105 to 200
50 124 to 287 71 to 136 205 to 408 332 to 574 176 to 308
51 85 to 128 145 to 226 250 to 338 482 to 610 101 to 219
Heavy Clay Soil Samples
52 40 to 77 60 to 110 100 to 214 526 to 737 122 to 283
53 11 to 32 7 to 27 16 to 75 578 to 735 220 to 381
54 40 to 76 65 to 108 113 to 181 520 to 741 142 to 280
55 40 to 77 69 to 102 106 to 186 560 to 720 133 to 283
56 48 to 83 97 to 139 147 to 214 508 to 698 136 to 282
57 43 to 89 96 to 142 153 to 215 541 to 683 124 to 279
58 42 to 85 99 to 139 147 to 218 542 to 677 135 to 272
59 44 to 91 103 to 142 156 to 226 543 to 677 125 to 282
60 52 to 86 101 to 146 159 to 229 554 to 677 131 to 253
61 49 to 88 104 to 146 167 to 223 559 to 673 128 to 241
Table 2. Confidence intervals for coarse sand, fine sand, total sand, silt and clay contents for 20 Clayey soil samples and for 10 Heavy Clay soil samples
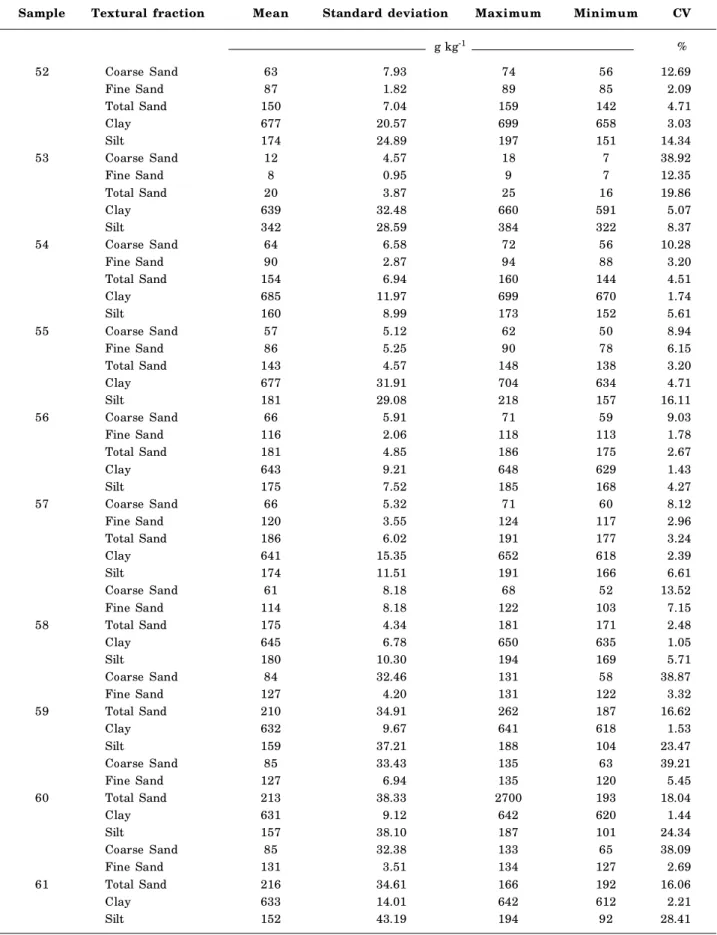
Source: Values extracted from the Prolab/IAC reports. including the clay fraction (all samples), coarse sand (samples 54, 55, 56, 57), fine sand (samples 52, 54, 55, 56, 57, 58, 59, 61), total sand (samples 52, 54, 55, 56, 57, 58) and silt (samples 53, 54, 56, 57, 58). Medium variability was inferred for coarse sand (samples 52, 53, 58, 59, 60, 61), fine sand (sample
53), total sand (samples 53, 59, 60, 61), and silt (samples 52, 55, 59, 60, 61).
Sample Textural fraction Mean Standard deviation Maximum Minimum CV
g kg-1 %
1 Coarse Sand 269 9.12 283 242 7.12
Fine Sand 475 18.92 500 458 3.98
Total Sand 744 3.00 746 740 0.4
Clay 117 3.37 122 115 2.88
Silt 140 2.87 144 138 2.06
2 Coarse Sand 315 43.96 352 256 13.95
Fine Sand 507 29.85 548 485 5.81
Total Sand 822 14.32 837 804 1.74
Clay 66 2.63 68 62 3.99
Silt 112 14.08 130 96 12.63
3 Coarse Sand 303 23.64 336 284 7.80
Fine Sand 532 18.23 546 505 3.43
Total Sand 835 7.59 841 824 0.91
Clay 76 2.75 79 73 3.61
Silt 89 7.54 98 82 8.45
4 Coarse Sand 419 19.41 447 402 4.63
Fine Sand 510 17.26 524 485 3.38
Total Sand 929 2.50 932 926 0.27
Clay 43 3.37 47 39 7.83
Silt 28 4.92 32 23 17.75
5 Coarse Sand 372 30.72 402 341 8.25
Fine Sand 470 25.72 494 442 5.47
Total Sand 842 6.24 850 835 0.74
Clay 45 1.16 46 44 2.57
Silt 113 5.32 119 106 4.73
6 Coarse Sand 355 23.42 388 336 6.60
Fine Sand 570 18.08 585 544 3.18
Total Sand 925 5.45 932 920 0.59
Clay 44 3.32 48 40 7.45
Silt 31 5.48 35 23 17.67
7 Coarse Sand 330 20.63 357 307 6.26
Fine Sand 508 29.87 545 472 5.87
Total Sand 838 9.90 852 829 1.18
Clay 69 5.60 74 62 8.11
Silt 93 4.97 97 86 5.34
8 Coarse Sand 326 20.05 353 308 6.15
Fine Sand 499 20.04 514 471 4.01
Total Sand 825 3.40 828 821 0.41
Clay 84 2.06 87 82 0.45
Silt 91 1.92 92 88 2.12
9 Coarse Sand 320 30.93 349 293 9.66
Fine Sand 508 28.04 533 482 5.53
Total Sand 828 3.11 831 824 0.38
Clay 84 3.50 88 80 4.15
Silt 88 1.71 90 86 1.94
Sample Textural fraction Mean Standard deviation Maximum Minimum CV
g kg-1 %
10 Coarse Sand 379 38.06 416 340 10.05
Fine Sand 264 28.47 288 235 10.80
Total Sand 642 10.48 651 628 1.63
Clay 275 13.40 287 256 4.86
Silt 83 8.42 93 73 10.17
11 Coarse Sand 432 13.24 446 415 3.06
Fine Sand 113 9.63 123 104 8.51
Total Sand 545 6.60 550 536 1.21
Clay 328 9.39 339 320 2.86
Silt 127 10.86 135 111 8.55
12 Coarse Sand 334 13.52 346 317 4.05
Fine Sand 259 10.34 272 249 4.00
Total Sand 592 4.24 598 589 0.71
Clay 331 22.80 365 316 6.88
Silt 77 21.26 95 46 27.70
13 Coarse Sand 424 2.38 427 422 0.56
Fine Sand 121 2.62 125 119 2.16
Total Sand 545 2.06 547 543 0.37
Clay 325 9.35 334 312 2.87
Silt 130 7.74 141 123 5.95
14 Coarse Sand 420 25.10 447 396 5.98
Fine Sand 120 12.44 132 109 10.35
Total Sand 540 13.54 557 526 2.50
Clay 328 11.81 342 316 3.60
Silt 133 10.21 147 124 7.70
15 Coarse Sand 307 15.77 324 287 5.13
Fine Sand 266 10.07 277 253 3.77
Total Sand 574 7.25 581 564 1.26
Clay 325 8.22 336 316 2.52
Silt 101 6.50 110 95 6.45
16 Coarse Sand 476 51.59 521 406 10.83
Fine Sand 84 9.60 98 76 11.40
Total Sand 561 49.18 597 489 8.77
Clay 290 8.00 302 286 2.75
Silt 149 50.62 225 117 33.86
17 Coarse Sand 336 13.96 347 316 4.14
Fine Sand 247 7.78 258 241 3.15
Total Sand 584 6.45 588 574 1.10
Clay 332 7.27 337 321 2.19
Silt 85 13.67 105 76 16.13
18 Coarse Sand 283 6.97 293 277 2.46
Fine Sand 285 6.48 293 280 2.26
Total Sand 569 5.03 574 562 0.88
Clay 332 6.83 341 325 2.05
Silt 99 4.00 105 97 4.04
19 Coarse Sand 347 34.59 380 304 9.97
Fine Sand 238 21.30 263 217 8.95
Total Sand 585 13.42 597 567 2.29
Clay 331 7.22 338 325 2.18
Silt 84 7.52 95 78 8.96
Table 4. Descriptive statistics of the results from particle-size analyses of 21 Medium textured soil samples (n = 4 replications)
Sample Textural fraction Mean Standard deviation Maximum Minimum CV
g kg-1 %
20 Coarse Sand 336 13.24 346 317 3.94
Fine Sand 245 10.47 255 231 4.28
Total Sand 581 7.23 587 572 1.24
Clay 336 13.42 354 324 3.99
Silt 83 6.50 89 74 7.80
21 Coarse Sand 340 16.87 363 326 4.96
Fine Sand 240 15.34 257 220 6.39
Total Sand 580 4.85 583 573 0.83
Clay 327 10.23 341 318 3.12
Silt 93 5.85 99 86 6.30
22 Coarse Sand 329 31.03 363 295 9.43
Fine Sand 248 36.76 289 210 14.82
Total Sand 577 6.05 584 571 1.04
Clay 326 10.47 336 312 3.21
Silt 98 4.65 104 93 4.77
23 Coarse Sand 489 26.21 508 450 5.36
Fine Sand 180 22.36 213 167 12.46
Total Sand 668 6.68 676 662 1.00
Clay 217 5.12 224 212 2.36
Silt 115 3.94 121 112 3.42
24 Coarse Sand 411 4.03 416 407 0.98
Fine Sand 107 4.57 114 104 4.26
Total Sand 519 4.04 522 513 0.77
Clay 346 3.77 349 342 1.09
Silt 136 5.88 144 130 4.32
25 Coarse Sand 292 23.36 305 257 8.00
Fine Sand 301 16.17 325 292 5.37
Total Sand 593 7.22 597 582 1.21
Clay 299 7.43 309 292 2.48
Silt 109 3.10 111 104 2.86
26 Coarse Sand 415 23.18 449 400 5.59
Fine Sand 111 13.22 120 91 11.97
Total Sand 525 11.16 540 516 2.12
Clay 337 12.01 349 325 3.56
Silt 138 4.71 145 135 3.41
27 Coarse Sand 428 10.62 436 413 2.48
Fine Sand 75 44.37 106 10 58.58
Total Sand 504 44.76 534 437 8.89
Clay 338 6.84 348 334 2.02
Silt 159 47.57 229 128 29.96
28 Coarse Sand 345 9.69 359 338 2.81
Fine Sand 262 11.72 273 245 4.47
Total Sand 607 2.62 611 605 0.43
Clay 297 3.41 301 293 1.15
Silt 96 2.06 99 94 2.14
29 Coarse Sand 353 14.27 368 336 4.04
Fine Sand 250 13.88 265 234 5.56
Total Sand 602 0.95 603 601 0.15
Clay 297 6.68 304 288 2.25
Silt 101 7.50 111 93 7.44
30 Coarse Sand 586 10.87 599 575 1.85
Fine Sand 83 4.69 88 79 5.65
Total Sand 669 6.65 678 663 0.99
Clay 229 22.54 262 213 9.85
Silt 103 18.44 114 75 17.99
Sample Textural fraction Mean Standard deviation Maximum Minimum CV
g kg-1 %
32 Coarse Sand 236 5.16 242 230 2.18
Fine Sand 133 4.65 138 127 3.51
Total Sand 369 0.57 369 368 0.15
Clay 493 7.14 498 482 1.45
Silt 139 6.78 149 134 4.87
33 Coarse Sand 296 11.23 309 283 3.79
Fine Sand 127 8.96 135 115 7.08
Total Sand 422 2.87 424 418 0.68
Clay 442 9.53 450 428 2.15
Silt 136 12.35 154 126 9.08
34 Coarse Sand 161 7.67 167 150 4.76
Fine Sand 115 8.50 128 111 7.37
Total Sand 277 1.91 278 274 0.69
Clay 566 9.67 574 554 1.70
Silt 157 8.13 168 150 5.17
35 Coarse Sand 156 9.57 168 148 6.15
Fine Sand 118 4.35 120 111 3.70
Total Sand 273 12.67 288 259 4.64
Clay 572 3.59 577 569 0.62
Silt 155 13.93 172 142 9.00
36 Coarse Sand 237 9.39 248 225 3.96
Fine Sand 132 5.56 138 125 4.22
Total Sand 369 7.18 375 359 1.95
Clay 499 12.50 508 481 2.50
Silt 133 7.88 144 126 5.92
37 Coarse Sand 253 27.42 291 226 10.86
Fine Sand 105 23.6 140 91 22.44
Total Sand 358 24.93 389 337 6.97
Clay 470 35.77 507 425 7.61
Silt 173 26.97 204 146 15.61
38 Coarse Sand 151 7.87 158 140 5.21
Fine Sand 116 9.60 125 104 8.24
Total Sand 267 5.19 274 262 1.94
Clay 578 8.13 585 567 1.40
Silt 155 9.27 168 147 5.98
39 Coarse Sand 244 9.83 256 233 4.02
Fine Sand 120 18.51 130 92 15.46
Total Sand 364 12.36 377 348 3.39
Clay 506 7.54 512 498 1.49
Silt 131 15.59 154 120 11.90
40 Coarse Sand 163 4.78 167 156 2.94
Fine Sand 113 2.58 116 110 2.28
Total Sand 276 4.11 281 272 1.49
Clay 565 12.60 575 547 2.23
Silt 159 14.94 181 148 9.39
41 Coarse Sand 299 20.96 324 276 7.01
Fine Sand 190 10.32 202 178 5.43
Total Sand 489 10.67 502 478 2.18
Clay 410 9.03 418 398 2.20
Silt 101 16.50 124 89 16.37
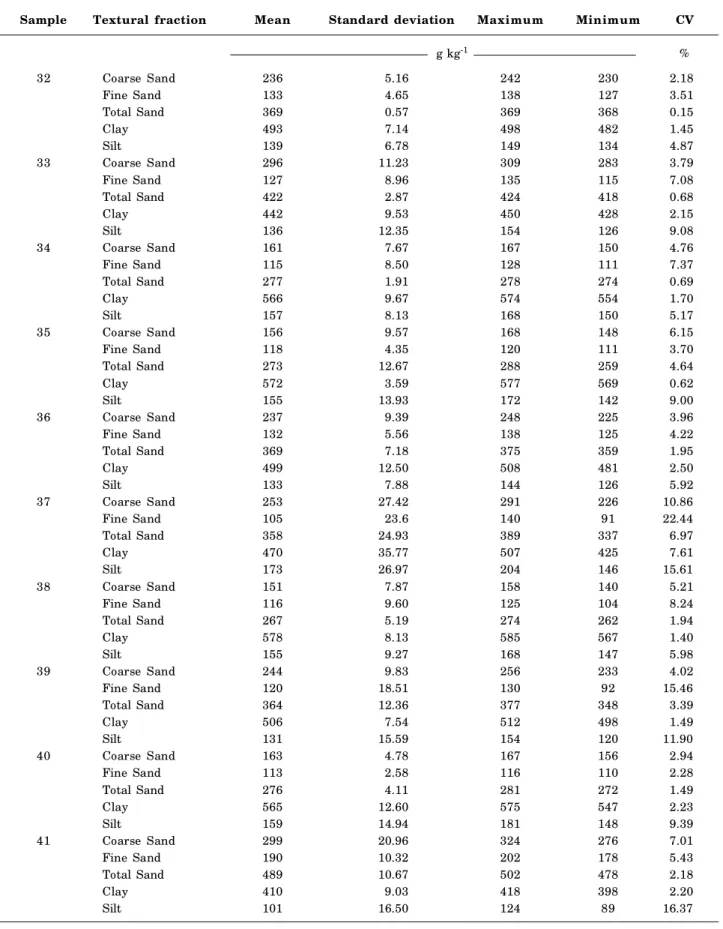
Table 5. Descriptive statistics of the results from particle-size analysis of 20 Clay soil samples (n = 4 replications)
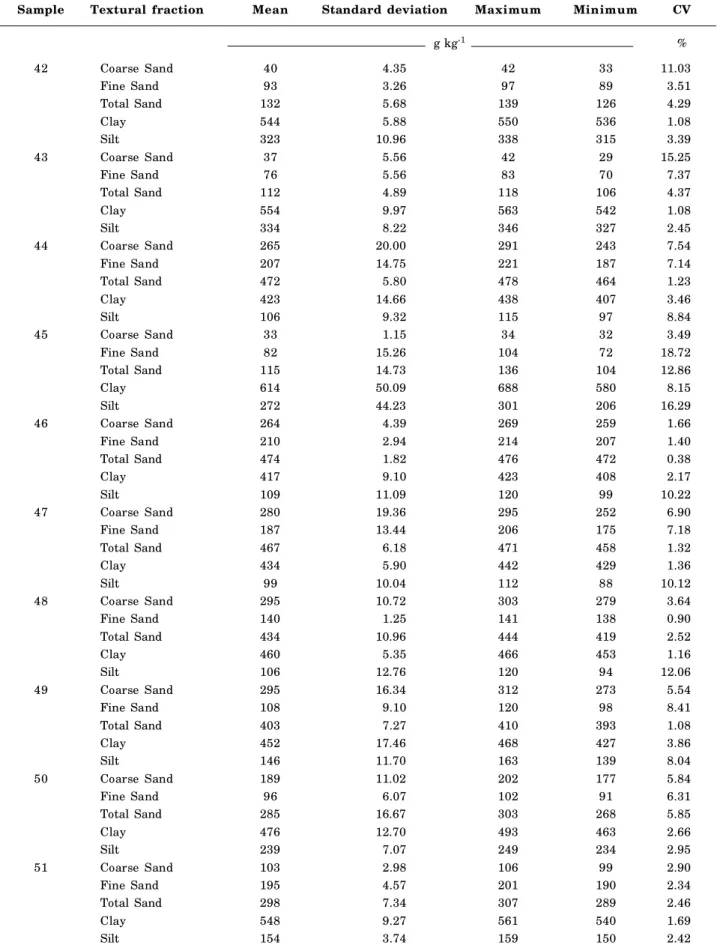
Table 5. Cont.
Sample Textural fraction Mean Standard deviation Maximum Minimum CV
g kg-1 %
42 Coarse Sand 40 4.35 42 33 11.03
Fine Sand 93 3.26 97 89 3.51
Total Sand 132 5.68 139 126 4.29
Clay 544 5.88 550 536 1.08
Silt 323 10.96 338 315 3.39
43 Coarse Sand 37 5.56 42 29 15.25
Fine Sand 76 5.56 83 70 7.37
Total Sand 112 4.89 118 106 4.37
Clay 554 9.97 563 542 1.08
Silt 334 8.22 346 327 2.45
44 Coarse Sand 265 20.00 291 243 7.54
Fine Sand 207 14.75 221 187 7.14
Total Sand 472 5.80 478 464 1.23
Clay 423 14.66 438 407 3.46
Silt 106 9.32 115 97 8.84
45 Coarse Sand 33 1.15 34 32 3.49
Fine Sand 82 15.26 104 72 18.72
Total Sand 115 14.73 136 104 12.86
Clay 614 50.09 688 580 8.15
Silt 272 44.23 301 206 16.29
46 Coarse Sand 264 4.39 269 259 1.66
Fine Sand 210 2.94 214 207 1.40
Total Sand 474 1.82 476 472 0.38
Clay 417 9.10 423 408 2.17
Silt 109 11.09 120 99 10.22
47 Coarse Sand 280 19.36 295 252 6.90
Fine Sand 187 13.44 206 175 7.18
Total Sand 467 6.18 471 458 1.32
Clay 434 5.90 442 429 1.36
Silt 99 10.04 112 88 10.12
48 Coarse Sand 295 10.72 303 279 3.64
Fine Sand 140 1.25 141 138 0.90
Total Sand 434 10.96 444 419 2.52
Clay 460 5.35 466 453 1.16
Silt 106 12.76 120 94 12.06
49 Coarse Sand 295 16.34 312 273 5.54
Fine Sand 108 9.10 120 98 8.41
Total Sand 403 7.27 410 393 1.08
Clay 452 17.46 468 427 3.86
Silt 146 11.70 163 139 8.04
50 Coarse Sand 189 11.02 202 177 5.84
Fine Sand 96 6.07 102 91 6.31
Total Sand 285 16.67 303 268 5.85
Clay 476 12.70 493 463 2.66
Silt 239 7.07 249 234 2.95
51 Coarse Sand 103 2.98 106 99 2.90
Fine Sand 195 4.57 201 190 2.34
Total Sand 298 7.34 307 289 2.46
Clay 548 9.27 561 540 1.69
Sample Textural fraction Mean Standard deviation Maximum Minimum CV
g kg-1 %
52 Coarse Sand 63 7.93 74 56 12.69
Fine Sand 87 1.82 89 85 2.09
Total Sand 150 7.04 159 142 4.71
Clay 677 20.57 699 658 3.03
Silt 174 24.89 197 151 14.34
53 Coarse Sand 12 4.57 18 7 38.92
Fine Sand 8 0.95 9 7 12.35
Total Sand 20 3.87 25 16 19.86
Clay 639 32.48 660 591 5.07
Silt 342 28.59 384 322 8.37
54 Coarse Sand 64 6.58 72 56 10.28
Fine Sand 90 2.87 94 88 3.20
Total Sand 154 6.94 160 144 4.51
Clay 685 11.97 699 670 1.74
Silt 160 8.99 173 152 5.61
55 Coarse Sand 57 5.12 62 50 8.94
Fine Sand 86 5.25 90 78 6.15
Total Sand 143 4.57 148 138 3.20
Clay 677 31.91 704 634 4.71
Silt 181 29.08 218 157 16.11
56 Coarse Sand 66 5.91 71 59 9.03
Fine Sand 116 2.06 118 113 1.78
Total Sand 181 4.85 186 175 2.67
Clay 643 9.21 648 629 1.43
Silt 175 7.52 185 168 4.27
57 Coarse Sand 66 5.32 71 60 8.12
Fine Sand 120 3.55 124 117 2.96
Total Sand 186 6.02 191 177 3.24
Clay 641 15.35 652 618 2.39
Silt 174 11.51 191 166 6.61
Coarse Sand 61 8.18 68 52 13.52
Fine Sand 114 8.18 122 103 7.15
58 Total Sand 175 4.34 181 171 2.48
Clay 645 6.78 650 635 1.05
Silt 180 10.30 194 169 5.71
Coarse Sand 84 32.46 131 58 38.87
Fine Sand 127 4.20 131 122 3.32
59 Total Sand 210 34.91 262 187 16.62
Clay 632 9.67 641 618 1.53
Silt 159 37.21 188 104 23.47
Coarse Sand 85 33.43 135 63 39.21
Fine Sand 127 6.94 135 120 5.45
60 Total Sand 213 38.33 2700 193 18.04
Clay 631 9.12 642 620 1.44
Silt 157 38.10 187 101 24.34
Coarse Sand 85 32.38 133 65 38.09
Fine Sand 131 3.51 134 127 2.69
61 Total Sand 216 34.61 166 192 16.06
Clay 633 14.01 642 612 2.21
Silt 152 43.19 194 92 28.41
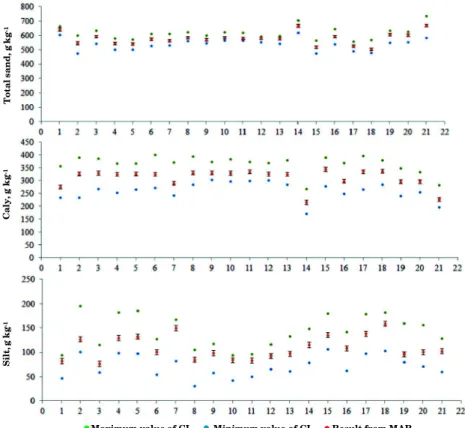
primarily for silt fraction, followed by fine sand, and also for the results for the Heavy Clay soil samples. The accuracy analysis for nine sandy soil samples showed that the estimations of sand and clay fractions using the RSh were 100 % accurate, once all obtained results were within the confidence intervals defined in table 1 and figure 2. For the silt fraction, the accuracy of the estimations dropped to 55.6 %, because the estimated values of four out of nine samples were not within the predefined confidence interval. However, the overall sensitivity or accuracy of the particle-size analysis using the RSh in the dispersion of the sandy soil samples was high, reaching 85.2 %. For the medium-textured soil samples, all values obtained using the RSh were within the confidence intervals defined in table 2, with 100 % accuracy for the three particle size fractions sand, clay and silt (Figure 3). The estimations of the three main textural fractions, sand, clay, and silt were also found to be 100 % accurate for the clayey soil samples (Figure 4) and for the Heavy Clay soil samples (Figure 5). In summary, considering all 61 soil samples of the different textural classes, the mean accuracy of the estimations using the RSh was approximately 96 %, a high value.
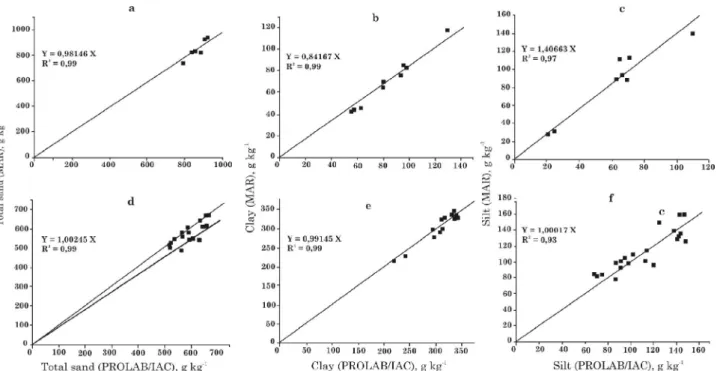
The dispersion charts for mean values of sand, clay and silt extracted from the reports of Prolab/ IAC (X axis) and those determined using the RSh (Y axis) are illustrated (Figure 6: Sandy and Medium textured soil samples; Figure 7: Clayey and Heavy Clay soil samples). The linear approximations indicate similarities between the two data sources, as evidenced by the proximity of the angular coefficient values (0.84 < m < 1.5) to the unit, which characterizes the straight line of perfect correlation. The values of the correlation coefficients were always greater than 0.93, thus confirming the high correlation between the Prolab/IAC values (reference) and the results obtained with RSh. Of the textural classes, total sand and clay provided the best results, with correlation coefficients greater than 0.98 and differences between the angular coefficients of the straight line and the unit value less than 0.16. Considering all textural classes tested, the largest discrepancies, not only in relation to the correlation coefficient values (> 0.93), but also to the deviations of the angular coefficients from unit (<0.5), were observed for the silt fraction estimations. This can be explained by the fact that the silt fraction was determined by difference, leading to cumulative errors in the estimations of this fraction. Ruiz (2005)
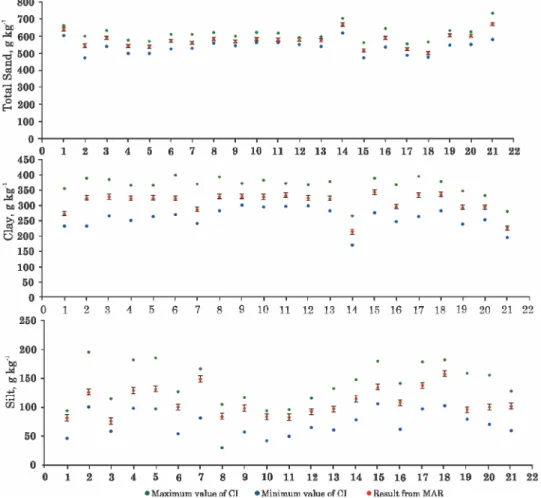
Figure 3. Accuracy analysis of 22 Medium-textured soil samples: representation of the minimum and maximum values of the confidence intervals (CI), means and average standard errors (bars) for total sand, silt and clay contents as determined by particle-size analysis using the reciprocal shaker (RSh).
Figure 4. Accuracy analysis for 21 Clayey soil samples: representation of the minimum and maximum values of the confidence intervals (CI), means and average standard errors (bars) for total sand, silt and clay contents as determined by particle-size analysis using the reciprocal shaker (RSh).
S
il
t,
g
k
g
-1
C
a
ly
,
g
k
g
-1
T
o
ta
l
s
a
n
d
,
g
k
g
-1
Maximum value of CI Minimum value of CI Result from MAR
S
il
t,
g
k
g
-1
C
a
ly
,
g
k
g
-1
T
o
ta
l
s
a
n
d
,
g
k
g
-1
Figure 5. Accuracy analysis for 11 soil samples of the Heavy clay soil textural class: representation of the minimum and maximum values of the confidence intervals (CI), means and average standard errors (bars) for total sand, silt and clay contents as determined by particle-size analysis using the reciprocal shaker (RSh).
Figure 6. Dispersion charts for mean values of total sand, clay and silt extracted from the data of the Prolab/ IAC and results determined using the RSh for 9 Sandy soil samples (a, b and c) and for 21 Medium-textured soil samples (d, e and f).
S
il
t,
g
k
g
-1
C
a
ly
,
g
k
g
-1
T
o
ta
l
s
a
n
d
,
g
k
g
-1
Figure 7. Dispersion charts for mean values of total sand, clay and silt extracted from the data of Prolab/IAC and results determined using the RSh for 20 clayey soil samples (a, b and c) and for 10 heavy clay soil samples (d, e and f).
demonstrated that the value of the silt fraction calculated by subtracting the other fractions is overestimated. To minimize this problem and possibly increase the accuracy of the determination, the author suggested that an additional volume of the silt and clay suspension should be sampled to estimate silt. However, the effect of this procedure on the accuracy of determinations was not discussed here.
In conclusion, the performance of the reciprocal shaker (RSh) was satisfactory enough to allow its recommendation as a suitable alternative to the conventional devices used for mechanical soil sample dispersion in particle-size analysis. Additional advantages of the equipment are its low cost, the possibility of simultaneous dispersion of up to 40 soil samples, and the option of using ordinary, cheap and easily replaceable glass pots.
CONCLUSIONS
1. The mechanical dispersion of soil samples from different textural classes, even of the Heavy Clay class by the reciprocal shaker was satisfactory.
2. The tested equipment is a viable alternative for the mechanical dispersion of soil samples for particle-size analysis.
LITERATURE CITED
BAVER, L.D.; GARDNER, W.H. & GARDNER, W.R. Soil physics. New York, John Wiley & Sons, 1972. p.1-53. CAMARGO, O.A; MONIZ, A.C.; JORGE, J.A. & VALADARES,
J.M.A.S. Métodos de análise química, mineralógica e física de solos do Instituto Agronômico de Campinas. Campinas, Instituto Agronômico de Campinas, 1986. 57p. (Boletim Técnico, 106).
DAY, P.R. Particle fractionation and particle-size analysis. In: BLACK, C.A. ed. Methods of soil analysis. Madison, ASA/ SSSA, 1965. Part 1. p.545-567. (Agronomy Monograph, 9)
EMPRESA BRASILEIRA DE PESQUISA AGROPECUÁRIA -EMBRAPA. Sistema Brasileiro de Classificação de Solos. 2.ed. Rio de Janeiro, EMBRAPA SOLOS, 2006. 306p. EMPRESA BRASILEIRA DE PESQUISA AGROPECUÁRIA
-EMBRAPA. Manual de métodos de análise de solo. 2.ed. Rio de Janeiro, Centro Nacional de Pesquisa de Solos, 1997. p.27-34.
FLETCHER, G.J.O.; DANILOVICS, P.; FERNANDEZ, G.; PETERSON, D. & REEDER, G.D. Attributional complexity: An individual diûerences measure. J. Personal. Soc. Psychol., 51:875-884, 1986.
GROHMANN, F. & RAIJ, B. van. Dispersão mecânica e pré-tratamento para análise granulométrica de Latossolos argilosos. R. Bras. Ci. Solo, 1:52-53, 1977.
QUAGGIO, J.A.; CANTARELLA, H. & RAIJ, B. van. Evolution of the analytical quality of soil testing laboratories integrated in a sample exchange program. Commun. Soil Sci. Plant Anal., 25:1007-1014, 1994.
HILLEL, D. Introduction to soil physics. San Diego, Academic Press, 1982. p.21-39.
NETO, E. L. DE S.; FIGUEIREDO, L. H. A. & BEUTLER, A. N. Dispersão da fração argila de um Latossolo sob diferentes sistemas de uso e dispersantes. R. Bras. Ci. Solo, 33:723-728, 2009.
RUIZ, H.A. Incremento da exatidão da análise granulométrica do solo por meio da coleta da suspensão (silte + argila). R. Bras. Ci. Solo, 29:297-300, 2005.
SILVA, A.P.; TORMENA, C.A.; FIDALSKI, J. & IMHOFF, S. Funções de pedotransferência para as curvas de retenção de água e de resistência do solo à penetração.R. Bras. Ci. Solo, 32:1-10, 2008.
TOMASELLA, J.; HODNETT, M.G. & ROSSATO, L. Pedotransfer functions for the estimation of soil water retention in Brazilian soils. Soil Sci. Soc. Am. J., 64:327-338, 2000. WARRICK, A.W. & NIELSEN, D.R. Spatial variability of soil