EVIDENCE OF MEASURES OF NORMALCY FOR
THICKNESS OF MASSETER MUSCLE EVALUATED
WITH ULTRASOUND: A REVIEW STUDY
Evidências de medidas de normalidade para a espessura do músculo
masseter avaliadas com ultrassonograia: estudo de revisão
Jabson Herber Proiro de Oliveira(1), Mário Genuíno Dourado Filho(2), Thais Myriam Aragão Melo(3),
Niedje Siqueira de Lima(4), Milton Marcelino Filho(5), Hilton Justino da Silva(6)
(1) Universidade Federal de Pernambuco – UFPE, Recife, PE,
Brasil.
(2) Hospital das Clínicas da Universidade Federal de
Pernam-buco- UFPE, Recife, PE, Brasil.
(3) FIR, Recife, PE, Brasil.
(4) Departamento de Odontologia da Universidade Federal de
Pernambuco – UFPE, Recife, PE, Brasil.
INTRODUCTION
One of the basics components of the temporo-madibular articulation is the jaw; it develops many movements1, assisted by the chewing muscles.
From these muscles, the masseter is one of the main ABSTRACT
The objective was to study measures of normality for the thickness of the masseter muscle, and the methods of measurement of thickness using ultrasound. Was conducted a review from databases MEDLINE, LILACS, JCR and PubMed. Publications were used until June 2013. Works
that involved young-adults individuals, healthy as the stomatognathic system – without the presence of signs and symptoms of temporomandibular joint disorders were included. 166 articles has been
found. By reading the titles, repeated articles were excluded, remaining 108 studies. After reading the title and the exclusion of articles that were not related to the theme, 54 papers were obtained.
Reading the abstracts allowed the acquisition of 22 studies. In the analysis of the measures t tests
were used for paired-sample and independent, veriied the conidence intervals and prepared forest
plot graphics to study the heterogeneity of the studies. It was observed that the masseter muscle in
males demonstrates to be thicker when compared to the women’s, both at rest and in contraction. A comparison of resting state between the genders revealed no signiicant difference. The same occurred in the contraction. Also was veriied the association of other methods with ultrasonography. The probability sample obtained revealed values for the state of contraction and rest in both sexes. Measurements demonstrated differences between the genders. Signiicant heterogeneity was found in the study’s data. The measurement of the thickness of the masseter muscle with ultrasonography is
presented in different studies as an objective method, precise and reproducible.
masseter muscle in healthy young adult individuals, studied by ultrasonography.
METHODS
The present work consists in a study of litera -ture’s review. To identify the publicized article that viewed the parameters in question, a revision of
the publicized works until 12 June 2013 has being
done in the following data bases: Medical Literature Analysis and Retrieval System Online (MEDLINE) and Literature and Latin American and Caribbean Health Sciences (LILACS)by Pubmed system and Journal of Citation Reports(JCR). The publications
done since 1990 were established for work inclusion.
The considered terms in search were: “Músculo
Masseter”, “Ultrassonograia” e “Morfologia” which
in English corresponds to “masseter muscle”,
“ultra-sonography” and “morphology”. The irst two used
describers are referenced on Sciences of Health Describers (DeCS). The search was done with combined English terms. The English word “AND” were associated to unite the terms. Thus, obtaining
the syntax “Ultrasonography AND morphology AND
masseter muscle”.
Original articles in Portuguese, Spanish, Chinese and English were included, studies involving young
adults individuals(aged ≥ 18 years old),healthy and
that included assessment of the masseter muscle
by ultrasound, and that showed results of thickness of this muscle. Were also considered as criteria inclusion the works involving in their methodology
some other means of assessment combined with the ultrasound evaluation. And yet, were considered the “controls” of studying type “case-control”. It was
considered as criteria exclusion works that have brought experimental studies with animal, studies with children, studies with older adults (age ≥ 60
years old) and reviewed articles of literature.
After the exclusion of articles by repetition
between databases or not corresponding to the subject, or yet, according to some other factor
deined in the criteria exclusion, we obtained a inal
amount of articles and these were studied in full.
Were excluded works that did not exhibit thickness of measurements of the masseter or did
not discriminate by gender in the results for
consid-ering that this variable could inluence the thickness of the muscle. Articles that exhibited data in centi -meters were converted in milli-meters. And to control
possible biases related to sexual dimorphism, works that didn’t show thickness data of the masseter considering gender, were excluded.
The works were detailed according to: Author
and year of publication, country of origin of the research; brief description of the method of analysis these muscles may help the clinical professional to
understand the myofunctional orofacial functions. The morphological characteristics of the stomatognathic system appear to be connected to the function the muscle has, as shown in a study2.
And the morphofunctional characterization of the stomatognathic system, most precisely of the
masseter muscle’s state, may involve multiple kinds
of analysis, since the morphological study of this muscle(ultrasonography)3, 5, 7, 10-12, passing by the
histomorphologic study13 until the bite’s strength2, 3
as well as the electrical activity2, 12-15.
To study the iber’s structure and the thickness of the muscle, the ultrasonography is conigured as
an effective method, with viability and documented applicability, low valued and easily accessible3, 11.
Besides, an ultrasonographic analysis allows an uncomplicated view of the musculature, hence his facial applicability, besides allowing a dynamic study of the muscle in the area9, 10.
The morphometry of the masseter muscle has
being studied by its thickness, volume, transversal
area and length4. It constitutes in objective
param-eters and allows comparisons.
Also in this sense, some authors have written a methodology for the ultrasonographic measurement of the orofacial area and supra-hyoid16. Which can
bring great beneits to the complementary clinical
evaluation for not being an invasive procedure and present precious quantitative values.
When changed, some variables may lead to
the compromising of the chewing apparatus, and, by quantitative methods, it’s possible to measure the morphological changes that determines the stomatognathic system.
The use of these data may be of great value to the study and treatment of the different pathologies in the stomatognathic system, as temporoman-dibular disfunctions and yet deposited illnesses and nutritional disturbs10. That is why the researches
in range are proclaimed favoring the creation of the approved clinical registrations and listed by measurement references.
The normality’s of measurements may be used as reference in studies with unhealthy populations in relation to the stomatognathic system and most
especially to the masseter muscle, by the existence of scientiic evidences of these measurements. And
complementary methods of diagnosis, especially the ultrosonography, may be used in clinical routine and various sectors, especially on Dentistry and Speech Language Pathology, and from there it becomes an aid to different therapeutic approach and or rehabilitation.
Therefore, the present study aimed to ind
The method of search revealed 23 articles,
where one study was excluded for being inacces -sible and unavailable in federal public libraries and Brazilian COMUT system (Program Bibliographic Commuting). Finally, leaving a total of 22 studies.
The detailing of the thickness of the masseter
muscle, by gender and muscular state (contraction
and relaxation), is presented in Table 1. Which is
the basis for statistical analysis. Also obtained the
means and conidence intervals (CI) for rest and
contraction (Table 2).
of the masseter thickness by ultrasound; sampling
and results obtained.
After the crossing of the terms, were found a total of 24 articles in MEDLINE, 02 LILACS, 50 in the JCR and 90 in Pubmed, a sum of 166 articles in the databases.
After exclusion of repeated articles, 108 works
has remained. And after reading the titles, also were
excluded articles which the theme was not related
to the purpose of this study been related to the
criteria exclusion, which resulted in the selection of
54 items.
Table 1 – Shows the thickness of the masseter muscle in study in situations of contraction and rest with results stratiied by gender.
MALE FEMALE
Article N RES DP CON SD Article N RES DP CON SD Kiliaridis; Kalebo, 1991 20 9,7 1,5 15,1 1,9 Kiliaridis; Kalebo, 1991 20 8,7 1,6 13,0 1,8
Raadsheer et al., 1994 15 13.7 2.6 16 2.4 Bakke et al.; 1992 29 11,6 2,7 13,1 3,2
Raadsheer et al., 1996 160 13,0 1,7 15,3 1,9 Bakke; Stoltze; Tuxen, 1993 13 10,4 1,4 11,3 1,9
Kubota et al., 1998 80 15,8 3,0 16,7 2,7 Bakke et al., 1996 14 10,4 2,5 12,2 2,8
Raadsheer et al., 1999 58 13,7 1,6 Raadsheer et al., 1996 169 10,6 1,7 13,4 2,0
Zhao; Dai; Lai, 2001 25 11,8 1,1 15,5 1,4 Raadsheer et al., 1999 63 12,1 1,8
Farella et al., 2003 30 13,7 0,9 Zhao; Dai; Lai, 2001 25 9,8 1,0 13,0 1,1
Koca-Ceylan et al., 2003 15 10,4 2,1 15,5 3,0 Che; Luo; Li, 2002 31 12,3 1,7 16,3 2,9
Raadsheer et al., 2004 57 13,7 1,7 Koca-Ceylan et al., 2003 15 9,6 1,2 13,4 1,4
Satiroglu; Arun; Isik, 2005 24 14,9 1,5 15,9 1,89 Ariji et al., 2004 30 9,7 2,1
Kuboet al., 2006 5 12,8 1,2 15,7 1,1 Raadsheer et al., 2004 64 12,1 1,9
Trawitzki et al., 2006 4 12,2 1,2 14,9 1,3 Satiroglu; Arun; Isik 2005 23 12,7 1,6 13,7 1,24
Palinkas et al., 2010 8 10,9 0,3 14,2 0,4 Trawitzki et al., 2006 11 10,0 1,6 11,7 1,7
Rani; Ravi, 2010 12 11,2 0,9 13,7 0,5 Georqiakaki et al., 2007 52 13,9 1,4
Rohila et al., 2012 10 13,1 1,0 14,4 1,23 Li et al., 2008 30 13,2 1,7 15,2 1,5
Palinkas et al., 2010 9 8,8 0,3 11,5 0,4
Rani; Ravi, 2010 12 9,6 1,1 11,9 0,8
Rohila et al., 2012 10 11,9 1,0 13,1 1,2
N Total 523 620
Legend: N (number of sample); RES (Measure at rest [mm]); SD (Standard Deviation); CON (Measure contraction in [mm]).
Table 2 – Shows the conidence interval, standard deviation and sample distribution for the thickness of the masseter muscle in the situations of contraction and rest according to results with gender.
STATISTICS
REST NT CONTRACTION NT
MALE CI: 12,65-IC95%(11,66-13,50) SD 1,7 *P=0,200 CI: 15,13-IC95%(14,58-15,68) SD 0,9 *P=0,200
FEMALE CI: 10,73-IC95%(9,97-11,48) SD 1,4 *P=0,200 CI: 13,07-IC95%(12,36-13,78) SD 1,3 *P=0,200
Legend: NT – Normality Test; CI-Conidence Interval; SD – Standard Deviation.
To elaboration, the forest plot graphic were
selected, only papers that contained the thickness measurements in contraction and relaxation, being excluded those that presented only one of these measures. Therefore, exclusively those graphs, it was necessary to exclude three articles for males
and four for female’s articles. As a measure of effect, the absolute difference between the means was used. Thus, it was possible to measure hetero-geneity of study data. The random effects model was chosen.
It was sought the comparison of studies that showed results of measures evaluated from the middle region of the muscle. Data were analyzed and studied statistically with SPSS v.20 software
(IBM SPSS Statistics v.20 – Statistical Product and
Service Solutions – Armonk, New York, USA).And exhibited in means, standard deviations, and coni -dence intervals.
On statistical analysis were also utilized the t test and Kolmogorov-Smirnov test and elaborated graphics model forest plots in software Stata/IC®
v.12.0software (College Station, Texas, USA).
Author/ Year of
Publication Country
Method of the Analysis ultrasonographic of the
masseter muscle Sampling Results
01º
Kiliaridis, S. Kalebo, P. ,
1991
Göteborg, Sweden
Bilateral assessment in
relaxation and maximal contraction; Thickest point.
Two measurements on separate occasions.
20 males, 20 females 21 years- 35 years Complete dentition
Men
rest – mean of 9.7 ± 1.5 mm; Contraction – mean of 15.1 ± 1.9 mm.
Women
rest – mean of 8.7 ± 1.6 mm; Contraction – mean of 13.0 ± 1.8 mm.
02º
Bakke et al.,
1992
Gentofte,
Denmark A line was drawn on the skin in parallel and 2 cm above the lower border of the mandible. Measurements were performed in three regions with 1 cm
of distance PMA (Next to
posterior mandible Ramus); MMA (Middle Region Ramus); AMA (Near Previous Edge). The evaluations were repeated
three times. The thickness was
considered as the average
of measurements at maximal
intercuspal and rest.
29 females, 20-31 years old (average 22 years).
Were presented averages for the
three different parts of the masseter to the right and left sides also the global average in the regions. Considering the Mean Area (MMA).
Rest: ± 2.74 mm 11.64 mm
Contraction:13.10 mm ± 3.25 mm
03º
Bakke; Stoltze; Tuxen, 1993
Copenhagen,
Denmark Bite force, electromyographic evaluation Immunohistochemical study, facial morphology.
Measuring of the thickness of
the masseter Rest and contraction.
13 female subjects without craniomandibular disorders 21-28 years old
Rest: 10,44mm ± 1,44
Contraction: 11,36mm ± 1,97
04º
Raadsheer et al 1994
Amsterdam, Netherlands
Assessing the thickness of
masseter muscle in contraction and rest.
Method of Comparison of ultrasonography with magnetic resonance.
15 men with an average age of 36 years old (25-51). During rest and contraction.
Considering the last evaluation and the middle region of the muscle. Contraction – Right: 15.7 mm (± 2.6) Contraction – Left: 16.3 mm (± 2.3)
Mean = 16.0 ± 2.45 mm
Rest – Right: 13.7 mm (± 2.8)
Rest – Left:13.8 mm (± 2.4)
Author/ Year of
Publication Country
Method of the Analysis ultrasonographic of the
masseter muscle Sampling Results
05º
Bakke et al.,
1996
Copenhagen,
Denmark Assessment of the thickness of the masseter muscle at rest and contraction.
Position of greater visualization of the anterior portion of the masseter.
Two sessions of measures.
14female subjects, 21-28 years, without symptoms of TMD.
Rest:10,4 mm ±2,5
Contraction: 12,2 mm ±2,8
06º
Raadsheer et al., 1996
Amsterdam, Netherlands
The image of the masseter was digitized bilaterally.
Measurements were made on
two conditions of relaxation
(light interocclusal contacts),
and contraction (maximal intercuspal position). The inal thickness was obtained from the
average of two measurements.
360 subjects of 7-49 years old. At rest and contraction.
Considering the age range of young adults
Women: 169 women over 20 years
Contraction: 13.4 mm ± 2.0 Rest 10,6mm ±1,7
Men: 160 men over 22 years
Contraction: 15.3 mm ± 1.9 Rest 13,0mm ±1,7
07º
Kubotaet al.,
1998
Iwate, Japan Measures calculated with 1.03% error – head parameter of dead animal (pig).
Average of 10 measurements spaced 2 mm apart. The reference line unites labial corner to intertragical ear incisure.
Rest and maximal contraction.
80 male subjects with a mean age of 23 years and 8 months ± 1yr 9 months.
Rest: 15,8mm ± 3,0
Contraction: 16,7mm ± 2,7
08º
Raadsheer et al., 1999
Amsterdam, Netherlands
Measure between the zygomatic arch and the mandibular angle, perpendicular to the anterior border of the muscle and the mandibular ramus.
Rest.
Two measurements.
121 subjects, 18-36 years, 58 men, 63 women. Healthy and without facial malformations.
Men:
Right-13.4mm ± 1.8; Left 14.0 ± 1.7 mm.
Mean for both sides – 13.7 mm ± 1.6
Women:
Right – Average 12.0 ± 1.9 mm; Left 12.2 ± 1.9 mm.
Mean for both sides – 12.1 mm ± 1.8
09º
Zhao; Dai; Lai, 2001
Beijing, China Measurement of the thickness
of the masseter muscle and study the facial type In contraction and rest.
50 young adults (25 men and 25 women)
Men:
Rest: 11.83 mm ±1.19 Contraction: 15.51mm±1.4
Women:
Rest: 9,84mm ±1,03 Contraction: 13.02mm ± 1.10
10º
Che; Luo; Li,
2002
Sichuan, China
Measurement of the thickness
of the masseter muscle in different mandibular positions.
Assessing the thickness of
muscle in contraction and rest.
31 women. Average of 21 years old
Rest: 12,3mm ±1,7
Author/ Year of
Publication Country
Method of the Analysis ultrasonographic of the
masseter muscle Sampling Results
11º
Farellaet al.,
2003
Naples, Italy Measure 2 cm above parallel the mandibular base, which
corresponds approximately to greater thickness.
Average of three consecutive measurements.
Assessment of the muscle
thickness in rest.
30 healthy men, with
full dentition except 3º
molars; division into two groups, 15 with face considered short (25.4 years) and 15 with normal/long face (23.6 years).
Overall mean age 24.6 years old.
Rest
Short face (n=15) – 14.3 mm ± 1.2
Long face (n=15) – 13.1 mm ± 0.7
Showed no values for a “normal” facial type (balanced). The mean values were effected between the groups:
Rest: 13.7 mm ± 0.95
12º
Koca-Ceylan et al., 2003
Samsun,
Turkey Measurement of the thickness of the masseter in rest and contraction
Treated group 30 individuals with unilateral partial edentulism
30 subjects, 15 men and 15 women (22-45).
Control group 30 subjects, 15 men and 15 women (22-45).
Control Group
Men (n = 15)
Right – contraction: 15.43 mm (± 1.7) rest: 10.78 mm (± 1.3)
Left – contraction: 14.55 mm (± 4.3) rest: 10.08 mm (± 2.9)
Average between the sides – Contraction: 15.5 ± 3.0 mm rest: 10.43 ± 2.1 mm
Women (n = 15)
Right – contraction: 13.67 mm (± 1.51) resting: 9.65 mm (± 1.3)
Left – contraction: 13.30 mm (± 1.4) resting: 9.57 mm (± 1.2)
Average between the sides – Contraction: 13.48 ± 1.4 mm rest: 9.61 ± 1.2 mm
13º
Arijiet al.,
2004
Nagoya, Japan
Assessing the thickness of the
masseter muscle in contraction and at rest into two groups (one TMD group and a control group).
35 women, 28.6 ± 5.6 (18-40 years) with TMD. And control group of 30 healthy women (24.0 ± 2.9 – 22 to 36 years)
Rest: 9.70mm ± 2.15
Contraction:showed no absolute values
14º
Raadsheer et al., 2004
Amsterdam, Netherlands
Assessment of bite force and
the thickness of the masseter
muscle contraction.
121 individuals without craniofacial disorders and without muscle diseases (57 males and 64 females) 18-36 years (mean of 23 years).
Female
right
Contraction: 12.0 mm (± 1.9) left
Contraction: 12.2 mm (± 1.9)
Average between the sides: 12.1 mm ± 1.9
Male
right
Contraction: 13.4 mm (± 1.8) left
Contraction: 14.0 mm (± 1.7)
Average between the sides: 13.7 mm ± 1.7
15º
Satiroglu; Arun; Isik
2005
Istanbul,
Turkey Measure in the thickest portion of the muscle, corresponding to half the distance of the
mediolateral ramus. With
minimal pressure possible.
Relaxation and maximal
contraction.
Three measurements with an interval of 05 minutes.
47 young adults
24 Men 23 Women
Mean age: 24.96 ± 3.57 years old.
Men (n = 8)
Rest: Normal 14.92 mm ± 1.59 Contraction: Normal 15.92 mm ± 1.89
Women (n = 8)
Author/ Year of
Publication Country
Method of the Analysis ultrasonographic of the
masseter muscle Sampling Results
16º
Kuboet al.,
2006
Sendai, Japan Evaluation of the right masseter Capture and record of successive images for subsequent measurement. The measurement was performed 5 times for the regions. An interval of 2 min was maintained between two successive records to avoid muscular fatigue.
5 men (25-28 years, mean 26.8 years old).
Rest –12,8 mm ± 1,2
Contraction –15,7 mm ± 1,1
17º Trawitzki et al., 2006
Ribeirão Preto, Brazil
Groups of surgical intervention (P1 and P2)
Control group (without craniofacial disorder)
Assessment of the thickness of
the masseter muscle at rest and contraction.
Control group (15 subjects) 11 women 21-29 (mean of 24.0) 4 men 19-25 (mean of 20.8)
Groups pre and post intervention (15 subjects)
Groups P1 and P2: 11 women 19-39 (mean 24.9) 4 men 17-27 (mean 21.2)
Control group Female
Right rest: 10,1 mm (± 1,7) contraction: 11.8 mm (± 1.7) Left rest: 9.9 mm (± 1.6) contraction: 11.6 mm (± 1.7)
Average between the sides: Rest: 10.0 mm ± 1.6 contraction: 11.7 mm ± 1.7
male:
Right rest: 12,4 mm (± 1,2) contraction: 15.0 mm (± 1.2)
Left rest: 12.1 mm (± 1.3) contraction: 14.8 mm (± 1.4)
Average between the sides: rest: 12.25 mm ± 1.2 contraction: 14.9 mm ± 1.3
18º
Georqiakaki et al., 2007
Thessaloniki,
Greece
Electromyographic evaluation
and thickness of the masseter
muscle in contraction.
52 women 23.7 ± 2.5 years
Contraction
Right – 13.9mm ± 1.5 Left – 13.9mm ± 1.4
Average between the sides: 13.9 mm ± 1.4
19º
Li et al.,
2008
Qingdao, China
Assessment of the thickness of
the masseter muscle at rest and
maximal intercuspal.
30 female subjects (18.96 years ± 1.57 years)
2 groups of healthy subjects, with full dentition and Class 1 molar relationship. Group 1-14 high angle
(SN-MP >40º, FH-MP >32º, FHI (SGo/Nme)
<62%;
Group 2 – 16 smaller
angle (SN-MP >29º, FH-MP >22º, FHI
(SGo/Nme) >68%;
Subjects with high angle:
Rest 12.36 mm ± 1.78 Contraction 1.79 mm ± 9.14
Subjects with short angle:
Rest 14.14 mm ± 1.70 Contraction 16.40 mm ± 1.22
Did not present values for a “normal” facial type (balanced). The mean values were effected between the groups:
Author/ Year of
Publication Country
Method of the Analysis ultrasonographic of the
masseter muscle Sampling Results
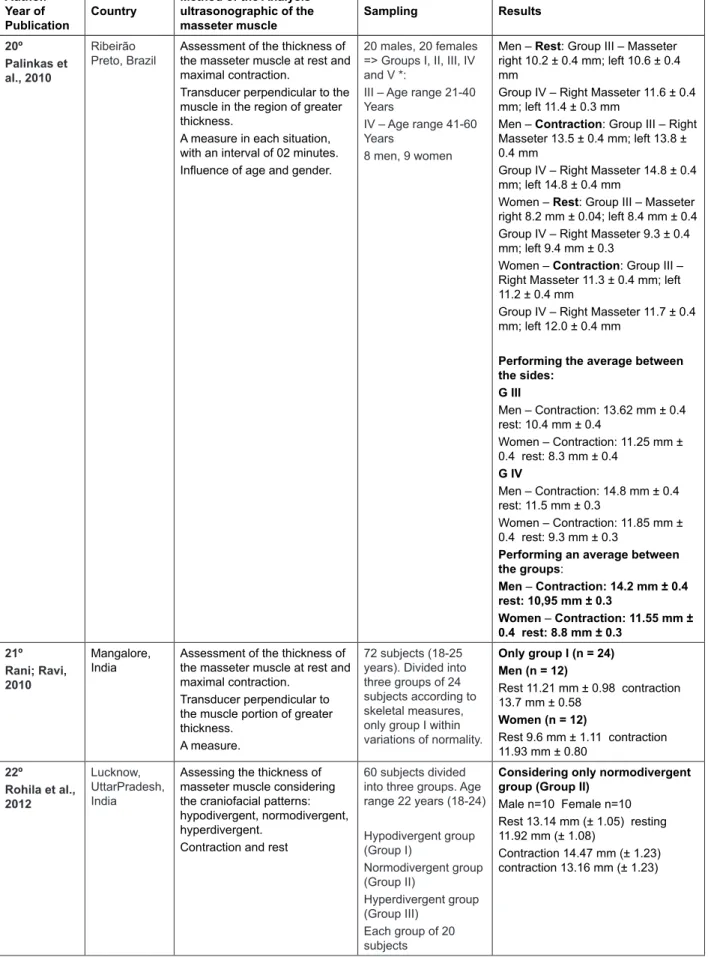
20º
Palinkas et al., 2010
Ribeirão Preto, Brazil
Assessment of the thickness of
the masseter muscle at rest and
maximal contraction.
Transducer perpendicular to the muscle in the region of greater
thickness.
A measure in each situation, with an interval of 02 minutes.
Inluence of age and gender.
20 males, 20 females => Groups I, II, III, IV and V *:
III – Age range 21-40
Years
IV – Age range 41-60
Years
8 men, 9 women
Men – Rest: Group III – Masseter right 10.2 ± 0.4 mm; left 10.6 ± 0.4 mm
Group IV – Right Masseter 11.6 ± 0.4 mm; left 11.4 ± 0.3 mm
Men – Contraction: Group III – Right Masseter 13.5 ± 0.4 mm; left 13.8 ± 0.4 mm
Group IV – Right Masseter 14.8 ± 0.4 mm; left 14.8 ± 0.4 mm
Women – Rest: Group III – Masseter
right 8.2 mm ± 0.04; left 8.4 mm ± 0.4 Group IV – Right Masseter 9.3 ± 0.4 mm; left 9.4 mm ± 0.3
Women – Contraction: Group III –
Right Masseter 11.3 ± 0.4 mm; left 11.2 ± 0.4 mm
Group IV – Right Masseter 11.7 ± 0.4 mm; left 12.0 ± 0.4 mm
Performing the average between the sides:
G III
Men – Contraction: 13.62 mm ± 0.4 rest: 10.4 mm ± 0.4
Women – Contraction: 11.25 mm ±
0.4 rest: 8.3 mm ± 0.4
G IV
Men – Contraction: 14.8 mm ± 0.4 rest: 11.5 mm ± 0.3
Women – Contraction: 11.85 mm ±
0.4 rest: 9.3 mm ± 0.3
Performing an average between the groups:
Men – Contraction: 14.2 mm ± 0.4
rest: 10,95 mm ± 0.3
Women – Contraction: 11.55 mm ±
0.4 rest: 8.8 mm ± 0.3
21º
Rani; Ravi,
2010
Mangalore, India
Assessment of the thickness of
the masseter muscle at rest and
maximal contraction.
Transducer perpendicular to the muscle portion of greater
thickness.
A measure.
72 subjects (18-25 years). Divided into three groups of 24 subjects according to
skeletal measures,
only group I within variations of normality.
Only group I (n = 24) Men (n = 12)
Rest 11.21 mm ± 0.98 contraction 13.7 mm ± 0.58
Women (n = 12)
Rest 9.6 mm ± 1.11 contraction 11.93 mm ± 0.80
22º
Rohila et al.,
2012
Lucknow,
UttarPradesh, India
Assessing the thickness of
masseter muscle considering the craniofacial patterns: hypodivergent, normodivergent, hyperdivergent.
Contraction and rest
60 subjects divided into three groups. Age range 22 years (18-24)
Hypodivergent group (Group I)
Normodivergent group (Group II)
Hyperdivergent group (Group III)
Each group of 20 subjects
Considering only normodivergent group (Group II)
Male n=10 Female n=10 Rest 13.14 mm (± 1.05) resting 11.92 mm (± 1.08)
Contraction 14.47 mm (± 1.23) contraction 13.16 mm (± 1.23)
is statistically signiicant difference between the
measures of contraction with the rest of the male individuals (p <0.05). The same also occurs with the female subjects.
LITERATURE REVIEW
The Kolmogorov-Smirnov test showed a normal distribution of samples for: gender and muscular state (table 2). And Table 3 demonstrates that there
Table 3 – Shows the average of the samples and compared with the Student’s t test.
GÊNDER/COMPARISON N SAMPLE X SAMPLE Y ONE-TAILED TEST
TWO-TAILED TEST MALE
REST – CONTRACTION* 12 12,48 15,25 0,000* 0,000*
FEMALE
REST – CONTRACTION** 14 12,4 15,2 0,000* 0,000*
MALE X FEMALE
REST – REST** 11a; 13b 12,73A 10,85B 0,000* 0,003*
CONTRACTION – CONTRACTION** 11a; 13b 15,26A 13,09B 0,000* 0,006*
aMale; bFemale
*T test for paired samples **T test for independent samples
Comparing measures of rest between genders
also was no statistically signiicant difference (p <0.05). What is also true for the comparison between
measurements of contraction.
One relevant aspect in many of these studies was the preoccupation with the measurement error, a common point between them is the application of minimum pressure possible. In all studies the standard deviation was presented, to minimize the error consecutive measurements were performed14, 15, 19, 23, 24, 26, 34, 35.
The use of multiple measurements in the same point2, 7, 15, 19, 26, 34, 36 or measures more than one
point2, 7, 14, 19, 36 shows a preoccupation with this type
of error.
It was observed that ultrasound measurements of the masseter have been measured both at rest
and at maximal contraction5, 7, 15, 24, 26. However,
there was variation in relation to the location of
measurement, having as reference the thickest
point of the masseter19.
It is also found the carrying of various measures in different parts of the muscle24, 26, 31, others studies
having standardized distances in relation to the zygomathic arch and mandible. However, there
is no consensus or trend about a speciic location for measurement. It was also possible to ind
a minimum rest period for voluntary during the muscular contractions to avoid fatigue15, 31.
About the results of studies, it can also comment on the hypothesis that the measurement of the resting muscle is less reliable than contracted,
because the muscle in rest would get more inlu -enced by the pressure of the hand of the evaluator, increasing, therefore the possibility of errors. This point yet needs further research that shows the variation intra and inter observer, not evaluated in these studies.
It was found a great variability of the measure-ments of muscle between ages and gender, and also the anatomical level of measurement, from 6.8 mm to 16.1 mm24. The best point of reliability
is considered the thickest, and most studies, despite variations conirm the reproducibility of the
method3, 7, 14, 19, 24-26, 31.
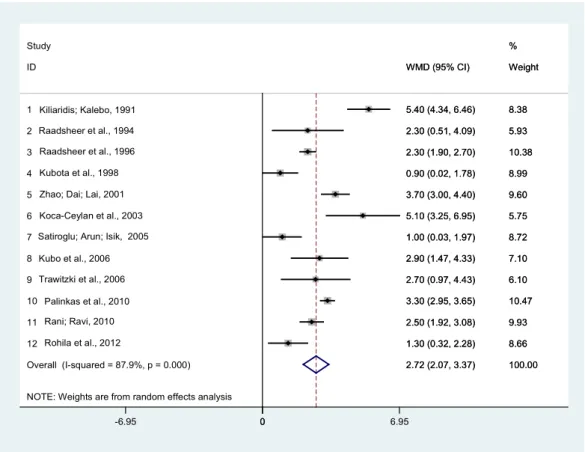
Data from the forest plot (igure 2) show that in
male individuals the comparison contraction with the rest showed p-value of the Cochran Q test (p-value = 0.00), meta-analytic measure = 2.721, I2 = 87.9%
and variability between studies = 1.01. The p-value of the test proved to have statistical evidence for the absolute difference between value measures between masseter muscle in contraction and at rest
revisions is suggested the consideration of facial morphology variable and or occlusion type.
Despite the variations in millimeter level, it is observed that this method is feasible, reproducible, perhaps requiring previous training for the evaluator. Especially because methods such as magnetic
resonance imaging is more expensive.
The quantiication of the thickness of the masseter muscle in different situations is the irst step as a parameter for evaluation of signiicant asymmetries and alterations in the muscular ibers
resulting from pathologies of the stomatognathic system.
For detailed analysis of the masseter, the subdi-vision of the muscle in segments or regions, as well as the number of measurements for morphometric study, also seems to be useful for minimizing the heterogeneity of the measures.
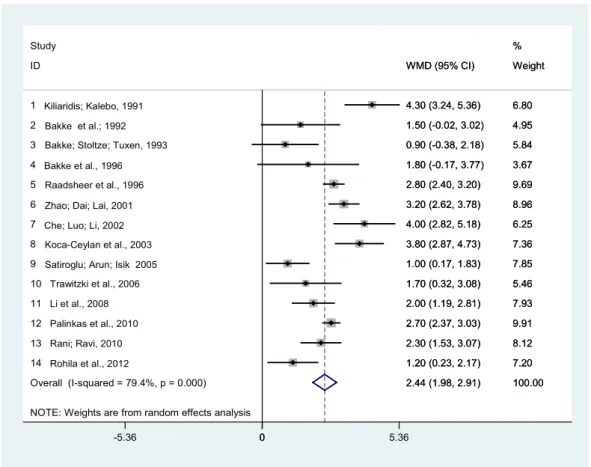
For female individuals, the forest plot (igure 3)
showed a p-value of the Cochran Q test (p-value = 0.00), meta-analytic measure = 2.444, I2 = 79.4%
and variability between studies = 1.01. The p-value of the test has proved absolute difference between value measures between the masseter muscle
in contraction and at rest (WMD – z = 24.10, p =
0.000).
One suggestion to be highlighted is that new studies may also consider the facial type and in the clinical evaluation in data analysis, in order to
make possible the exhibition of increasingly precise
measurements. It is also suggested that in future
revisions, may be considered, not only the thickness,
but also studies that evaluated the dimensions and area of the masseter muscle, gender and age.
A considerable amount of works has not being
included in the review because did not present the results considering the gender variable. For future
NOTE: Weights are from random effects analysis Overall (I-squared = 87.9%, p = 0.000) ID
10 11 3 4 1
7
9 6 2
8 Study
12 5
2.72 (2.07, 3.37) WMD (95% CI)
3.30 (2.95, 3.65) 2.50 (1.92, 3.08) 2.30 (1.90, 2.70) 0.90 (0.02, 1.78) 5.40 (4.34, 6.46)
1.00 (0.03, 1.97)
2.70 (0.97, 4.43) 5.10 (3.25, 6.95) 2.30 (0.51, 4.09)
2.90 (1.47, 4.33)
1.30 (0.32, 2.28) 3.70 (3.00, 4.40)
100.00 Weight
10.47 9.93 10.38 8.99 8.38
8.72
6.10 5.75 5.93
7.10 %
8.66 9.60
2.72 (2.07, 3.37) WMD (95% CI)
3.30 (2.95, 3.65) 2.50 (1.92, 3.08) 2.30 (1.90, 2.70) 0.90 (0.02, 1.78) 5.40 (4.34, 6.46)
1.00 (0.03, 1.97)
2.70 (0.97, 4.43) 5.10 (3.25, 6.95) 2.30 (0.51, 4.09)
2.90 (1.47, 4.33)
1.30 (0.32, 2.28) 3.70 (3.00, 4.40)
100.00 Weight
10.47 9.93 10.38 8.99 8.38
8.72
6.10 5.75 5.93
7.10 %
8.66 9.60 Kiliaridis; Kalebo, 1991
Raadsheer et al., 1994 Raadsheer et al., 1996 Kubota et al., 1998 Zhao; Dai; Lai, 2001 Koca-Ceylan et al., 2003 Satiroglu; Arun; Isik, 2005 Kubo et al., 2006 Trawitzki et al., 2006
Palinkas et al., 2010 Rani; Ravi, 2010 Rohila et al., 2012
0
-6.95 0 6.95
WMD = Weighted Mean Difference
other techniques with ultrasonography as orofacial anthropometry cephalometric or other methods7, 19, 25, 26, 31, the electromyography2, 15, bite force2, 19, heart
rate19, pressure blood19 and magnetic resonance
imaging23, 28.
Still on the relationship of the thickness with
the electromyography, in the studies obtained through of the search methodology and that involved surface electromyography, were not found
works that did analysis of the normalized signal or
median frequency of the power spectrum (EMG) or conduction velocity signal.
An interesting point to highlight is the fact that the
irst study selected is from 19917, although there are
no restrictions in respect to dates. This is probably related to low accuracy and availability of ultrasound equipment previously that year. Previously to this period, the accuracy was small, and practically did
DISCUSSION
A limitation in the analysis of the studies was the different methodologies applied to measurement of the masseter muscle as the consideration of different reference points for measurement. As well
as the exclusion of a work, by inaccessibility. The
articles found feature variability in the number of subjects studied and small differences in the method of measurement.
Despite of some of the articles did not consider
the assessment of the thickness of the masseter
muscle of the face according to type, was sought, in the articles that presented results according to
facial proile, to select the measures of craniofacial
features considered “balanced”. In studies that did comparisons between facial types, but did not present facial type with “balanced” characteristics,
NOTE: Weights are from random effects analysis Overall (I-squared = 79.4%, p = 0.000) 8
13 7 6
11 Study
14 ID
10 5 4 2 3
9 1
12
2.44 (1.98, 2.91) 3.80 (2.87, 4.73)
2.30 (1.53, 3.07) 4.00 (2.82, 5.18) 3.20 (2.62, 3.78)
2.00 (1.19, 2.81)
1.20 (0.23, 2.17) WMD (95% CI)
1.70 (0.32, 3.08) 2.80 (2.40, 3.20) 1.80 (-0.17, 3.77) 1.50 (-0.02, 3.02) 0.90 (-0.38, 2.18)
1.00 (0.17, 1.83) 4.30 (3.24, 5.36)
2.70 (2.37, 3.03)
100.00 7.36
8.12 6.25 8.96
7.93 %
7.20 Weight
5.46 9.69 3.67 4.95 5.84
7.85 6.80
9.91
2.44 (1.98, 2.91) 3.80 (2.87, 4.73)
2.30 (1.53, 3.07) 4.00 (2.82, 5.18) 3.20 (2.62, 3.78)
2.00 (1.19, 2.81)
1.20 (0.23, 2.17) WMD (95% CI)
1.70 (0.32, 3.08) 2.80 (2.40, 3.20) 1.80 (-0.17, 3.77) 1.50 (-0.02, 3.02) 0.90 (-0.38, 2.18)
1.00 (0.17, 1.83) 4.30 (3.24, 5.36)
2.70 (2.37, 3.03)
100.00 7.36
8.12 6.25 8.96
7.93 %
7.20 Weight
5.46 9.69 3.67 4.95 5.84
7.85 6.80
9.91 Kiliaridis; Kalebo, 1991
Bakke et al.; 1992 Bakke; Stoltze; Tuxen, 1993 Bakke et al., 1996 Raadsheer et al., 1996 Zhao; Dai; Lai, 2001 Che; Luo; Li, 2002 Koca-Ceylan et al., 2003 Satiroglu; Arun; Isik 2005
Trawitzki et al., 2006 Li et al., 2008 Palinkas et al., 2010 Rani; Ravi, 2010 Rohila et al., 2012
0
-5.36 0 5.36
WMD = Weighted Mean Difference
the limited capacity to generalization, due to the heterogeneity of the methodology and results of the studies found.
The removal of some studies that could be responsible for variation between measurements
did not cause signiicant changes in the inal result.
Therefore, was chose to present the forest plot without deleting these studies, since the presence
would not interfere in a signiicant way. For both
genders, can be attributed that the heterogeneity between the studies was related to the method of study and the variables of the sample, especially the facial features. Some studies did not control this variable, or controlled by different methods. These issues are seen as a limitation of this study, limited
to stricter comparisons. Thus, the inluence of facial
types emphasizes the necessity of considering this variable in future studies. However, evidence for the difference in the masseter state of contraction in comparison to rest was found.
CONCLUSION – FINAL COMMENTS
At the end of this review, is perceived the broad possibility of acquisition modes of ultrasound, as well as its relationship with other techniques. However,
was also observed the lack of standardization for
obtaining measurements of the orofacial muscles.
The measurement of the thickness of the masseter
muscle with ultrasonography is presented in several studies found as a relevant method for being non-invasive, objective, accurate and reproducible.
Were found values, for males and females,
which can be considered the normal range for the
thickness of the masseter muscle in adults, as well
as information on the statistical relationship of the muscle at rest and contraction. These informa5tions can be considered as a subsidy for the routine of the clinical practice. However, care is required in applying inferences and generalizations given
the inluence of variable craniofacial type. Which justiies the need for new studies that consider the
analysis of this variable.
The studies allowed to observe a evidence,
statis-tically signiicant difference in muscle comparing
the states of rest and contraction, both for male individuals gender, as for female subjects during rest and contraction. There was also a statistically
signiicant difference between the resting states
between genders. The same happened to the state of contraction between genders.
As to the method of evaluation, different conduits were observed to measure the masseter muscle which perhaps can justify the heterogeneity of the
muscle thickness measurements. However, based
on the studies found on the subject it is possible to with 03 studies2, 18, 19. For the method of selecting,
the countries that have given origin to publica-tions on the subject were: Netherlands with 04 studies3, 26-28, China with 0315, 20, 33, Japan with 0317, 23, 24,
Brazil with 0225, 32, India with 0229, 30 and Turkey, also
with 02 works22, 31.
Besides measuring the thickness of the masseter, has also been veriied the morphometry
of temporal22, 27 and digastric muscle27 in the same
job. Some studies have shown the relationship between the facial type, elongated or shortened,
with the thickness of the masticatory muscles3, 14, 31.
However, the comparison between the results of
different studies on facial type and thickness of the
masseter muscle is still complicated by the fact that studies have used different methodologies to study the samples. Studies with more uniform method-ologies are necessary, so that comparisons may be done.
It may raise also the hypothesis that the diet can
inluence the morphology of the masseter muscle.
Regions where more fat or diet composed of meats, tend to require more of the masseter muscle during the bite force and during mastication, in conse-quence there occurs a greater development of the
thickness of the muscle. And countries with lighter
and less fatty diet tend to provide the opposite situation in the masseter muscle. In other words, require less muscle strength, and in consequence the muscle develops less.
A Turkish study found a thickness of 12.7 mm
(± 1.6) at rest in women (n = 23) and contraction 13.76 mm (± 1.2), and men (n = 24) during the rest 14.9 mm (± 1.5) and contraction 15.9 mm (± 1.89)31.
Already a Swedish study found a thickness of 8.7
mm (± 1.6) at rest in women (n = 20) and contraction 13.0 mm (± 1.8). And in males (n = 20) at rest 9.7 mm (± 1.5) and contraction 15.1 mm (± 1.9)7. Further
studies are needed to ind more evidence on this
hypothesis.
Thus, it is possible that there is a relationship
between the thickness of the masseter muscle,
bite force, electrical activity by means of electro-myographic signal amplitude, facial morphology, and occlusal factors2, and also chewing. Since the
hypothesis of relevance of the individual’s diet is grounded in anatomical relationship of manner and muscle function.
Despite the focus of the study is geared to the
measure of the thickness of the masseter muscle,
one can also highlight that in the literature of measures muscle volume11 are also found. However,
studies are directed to this parameter in order to obtain the values of normality.
The main dificulty of the present study is related
morphofuncionality of the masseter muscle, but this
inluence of the diet has not been considered by the studies indicating that this ield needs to be studied to ill in this gap in knowledge morphological and
functional stomatognathic system. Is also presented a range of measure of normality according gender and muscle state (contraction and rest), and still,
methodology that exists for works published in the ultrasound measurement of the thickness of the
masseter muscle in young adults.
However, it is necessary that, in future revisions,
the data may also be exhibited and studied in new tests of hypothesis also taking into account the
heterogeneity of the studies, in order to provide greater value to the methodology and results of analysis. Thus, it is believed that the reference measurements have greater trustworthiness and support.
highlight for deining the methodology: (1) There is no consensus or justiication that deines the
position of the volunteer (if sitting or lying down). This protocol may depend on the purpose of the study
or relationship with other exams;(2) should have
care with hand pressure of the evaluator under the transducer, as this can may interfere in the value of
the measures; (3) whether to make an initial location
of the masseter muscle with palpation, contraction,
observing the deinition and image reproducibility; (4) It is important to perform the benchmarking at
least 3 times the measure of muscle and consider an average or mean value; (5) consider the value of the measurements in millimeters. Despite some studies have presented measurements in centimeters,
the most works were performed in millimeters and
this is a unit of measurement that can add greater precision.
The study also comes to comment the hypothesis
of the inluence of diet in the morphometry and
RESUMO
O objetivo foi estudar medidas de normalidade para espessura do músculo masseter, bem como os
métodos de mensuração da espessura por ultrassonograia. Foi realizada uma revisão a partir das
bases de dados MEDLINE, LILACS, JCR e PubMed. Foram utilizadas publicações até junho de 2013. Foram incluídos trabalhos que envolveram indivíduos adultos jovens considerados hígidos quanto ao sistema estomatognático – sem a presença de sinais e sintomas de distúrbios na articulação
temporomandibular. Foram encontrados 166 artigos. Pela leitura do titulo foram excluídos os artigos repetidos, restando 108 estudos. Após a leitura do titulo e a exclusão de artigos que não estavam
relacionados ao assunto, foram obtidos 54 trabalhos. A leitura dos resumos permitiu a obtenção de 22 estudos. Na análise das medidas foram utilizados os testes t para amostras pareadas e
indepen-dentes, veriicado os intervalos de coniança e confeccionados gráicos forest plot para estudar a heterogeneidade dos trabalhos. Constatou-se que o músculo masseter em homens demonstra ser mais espesso quando comparado ao das mulheres, tanto no repouso quanto em contração. A
com-paração do estado de repouso entre os gêneros não revelou diferença signiicante. O mesmo ocor
-reu em contração. Também veriicou-se a associação de outros métodos com a ultrassonograia. A
amostra probabilística obtida revelou valores para o estado de contração e repouso. Houve diferença
nas medidas entre os gêneros. Foi constatada signiicante heterogeneidade nos dados dos estudos. A mensuração da espessura do músculo masseter com a ultrassonograia apresenta-se nos diversos
estudos como um método objetivo, preciso e com reprodutibilidade.
compression: clinical outcomes. Int Jour Audiol. 2009;48(9):632-44.
15. Wolfe J, John A, Schafer E, Nyffeler M, Boretzki
M, Caraway T. Evaluation of nonlinear frequency compression for school-age children with moderate to moderately severe hearing loss. J Am Acad Audiol. 2010;21(10):618-28.
16. Baskent D, Shannon RV. Frequency transposition
around dead regions simulated with a noiseband vocoder. J Acoust Soc Am. 2006;119(2):1156-63. 17. Robinson JD, Baer T, Moore BC. J. Using transposition to improve consonante discrimination and detection for listeners with severe high frequency hearing loss. Int Journ Audiol. 2007;46(6):293-308. 18. Fraga FJ, Prates LPCS, Iorio MCM. Frequency Compression/Transposition of Fricative Consonants for the Hearing Impaired with High-Frequency Dead Regions. Proceedings of the 9th Annual Conference of the International Speech Communication Association (Interspeech); 2008 Sep 22-26; Bresbane, AUS. 2008.
19. Fullgrabe C, Baer C, Moore BCJ. Effect of linear and warped spectral transposition on
consonant identiication by normal-hearing listeners
with a simulated dead region. Int Journ Audiol. 2010;49(6):420-33.
20. Robinson JD, Stainsby TH, Baer T, Moore BCJ. Evaluation of a frequency transposition algorithm using wearable hearing aids. Int Journ Audiol. 2009;48(6):384-93.
21. Organização Mundial da Saúde (OMS/WHO).
[Homepage na Internet]. [acesso em: 2012 jun 11). Disponível em: http://www.who.int/en/.
22. Lloyd LL, Kaplan H. Audiometric interpretation: a manual of basic audiometry. Baltimore: University
Park Press, 1978.
23. Silman S, Silverman CA. Auditory diagnostics: principles and applications. San Diego: Singular, 1997.
24. Folstein MF, Folstein SE, Mchugh PR. Mini-mental state. A practical method for grading the cognitive state of patients for the clinician. J Psychiatr Res. 1975;12(3):189-98.
25. Moore BCJ. Dead region in the cochlea: diagnosis, perceptual consequences and
implications for the itting of hearing aids. Trends
amplif. 2001;5(1):34.
26. Costa MJ. Listas de sentenças em português: apresentação de estratégias de aplicação na audiologia. Santa Maria: Pallotti.1998.
27. Moore BCJ, Huss M, Vickers DA, Glasberg BR,
Alcantara JI. A test for diagnosis of dead regions in the cochlea. Br J Audiol. 2000;34(4):205-24.
28. Levitt H, Rabiner LR. Use of a sequential strategy in intelligibility testing. J Acoust Soc Am. 1967;42(3):609-12.
REFERENCES
1. Bonjardim LR, Gavião MBD, Pereira LJ, Castelo PM. Mandibular movements in children with and without signs and symptoms of temporomandibular disorders. Journal of Applied Oral Science. 2004;12:39-44.
2. Bakke M, Tuxen A, Vilmann P, Jensen BR, Vilmann
A, Toft M. Ultrasound image of human masseter muscle related to bite force, electromyography, facial morp
3. Moore BCJ, Glasberg BR. A model of loudness perception applied to cochlear hearing loss. Auditory Neuroscience. 1997;3:289-311.
4. Smith MW, Faulkner A. Perceptual adaptation by
normally hearing listeners to a simulated “hole” in hearing. J Acoust Soc Am. 2006;120(6):4019-30. 5. Vestergaard M. Dead regions in the cochlea: implication for speech recognition and applicability
of articulation index theory. Int J Audiol.
2003;42(5):249-61.
6. Moore BCJ, Vinay SN. Enhanced discrimination of low-frequency sounds for subjects with high-frequency dead regions. Brain. 2009;132(2):524-36.
7. Preminger JE, Carpenter R, Ziegler CH. A clinical perspective on cochlear dead regions: intelligibility
of speech and subjective hearing aid beneit. J Am
Ac Audiol. 2005;16(8):600-13.
8. Hornsby BWY, Dundas JA. Factors affecting
outcomes on the TEN (SPL) test in adults with hearing loss. J Am Ac Audiol. 1009;20(4):251-63.
9. Cox RM, Alexander GC, Johnson J, Rivera
I. Coclear dead regions in typical hearing aid candidates: prevalence and implications for use of high-frequency speech cues. Ear Hear. 2011;32(3):339-48.
10. Eguti EY. Identiicação das zonas mortas na
cóclea utilizando a técnica do mascaramento com ruído branco [tese]. São Paulo (SP): Universidade federal de São Paulo; 2002.
11. Ching TY, Dillon H, Byrne D. Speech recognition of
hearing-impaired listeners: predictions from audibility
and the limited role of high-frequency ampliication.
J Acoust Soc Am. 1998;103(2):1128-40.
12. Baer T, Moore BCJ, Kluk K. Effects of low pass iltering on the intelligibility of speech in quite
for people with and without dead regions at high frequencies. J Acoust Soc Am. 2002;110(2):1164-74.
13. Vickers DA, Moore BCJ, Baer T. Effects of lowpass iltering on the intelligibility of speech in
29. Costa MJ, Santos SN, Lessa AH, Mezzomo CL. Nova proposta de cálculo do índice percentual de reconhecimento de sentenças. CoDAS. No prelo 2014.
30. Henriques MO, Miranda EC, Costa MJ. Limiares de reconhecimento de sentenças no ruído, em campo livre: valores de referência para adultos normo-ouvintes. Rev Bras Otorrinolaringol. 2008;74(2):188-92.
31. Bohnert A, Nyffeler M, Kelmann A. Advantages of a non-linear frequency compression algorithm in noise. Eur Arc Otorhinolaryngol. 2010;267(7):1045-53.
32. Simpson A, Hersbach AA, Mcdermott HJ. Frequency-compression outcomes in listeners with steeply sloping audiograms. Int J Audiol. 2006;45(11):619-29.
33. Kuk F, Keenan D, Korhonen P, Lau CC. Eficacy
of linear frequency transposition on consonant
identiication in quiet and in noise. J Am Acad Audiol.
2009;20(8):465-79.
34. Wolfe J, John A, Schafer E, Nyffeler M, Boretzki
M, Caraway T et al. Long-term effects of non-linear
frequency compression for children with moderate hearing loss. Int J Audiol. 2011;50(6):396-404. 35. Janse E. Processing of fast speech by elderly listeners. J Acoust Soc Am. 2009;125(4):2361-73. 36. Gonçales AS, Cury MCL. Avaliação de dois
testes auditivos centrais em idosos sem queixas.
Braz J Otorhinolaryngol. 2011;77(1):24-32.
37. Mackersie CL, Crocker TL, Davis RA. Limiting
high-frequency hearing aid gain in listeners with and without suspected cochlear dead regions. J Am Acad Audiol. 2004; 15(7): 498-507.
38. Martin RL. How much do you amplify a severely damaged zone? Hear J. 2001;54(4):88-90.
39. Turner CW, Hurtig RR. Proportional frequency
compression of speech for listeners with sensorineural hearing loss. J Acoust Soc Am. 1999;106(2):877-86.
40. Allum-Mecklenburg D, Babighian G. Cochlear
performance as a indicator of auditory plasticity in humans. In: Salvi RJ, Henderson D, Fiorino F, Colletti V., editors. Auditory system plasticity and
regeneration. New York: Thieme Medical Publishers;
1996. p. 395-404.
Received on: January 15, 2014 Accepted on: March 17, 2014
Mailing address:
Jabson Herber Proiro de Oliveira