VOICE SELF-ASSESSMENT OF PROFESSORS
AT SANTA MARIA CITY/RS, BRAZIL
Autoavaliação vocal de professores de Santa Maria/RS
Carla Aparecida Cielo (1), Vanessa Veis Ribeiro (1)
(1) Universidade Federal de Santa Maria/UFSM, Santa Maria,
RS, Brasil.
Research grant agency: CAPES (Coordination for Improvement of Higher Education Personnel).
Conlict of interest: non-existent
Thus, some authors have been researching the quality of life related to the teacher’s voice8,11-17,
seen that self-perceived voice quality is a subjective parameter that has no direct relationship to the objective measures of vocal
Speech-Language-Pathology assessment, being extremely important
to obtain data on how relevant that vocal disorder for the patient8,10.
A recent study that analyzed the inluence of
aspects of quality of life related to voice in accession of voice therapy for teachers showed that teachers who had a less scores favorable to quality of life also had lower adherence to therapy8. Currently,
the protocols of vocal self-evaluation are the best
procedures to understand this complex relationship
between health/disease and the perception of the subject8,11-14,16,18.
Due to this, many protocols developed in other languages were translated and validated in Portuguese11-14,16,17,19. However, although difer
-ences are observed in the literature as to the
INTRODUCTION
The teaching profession involves many biopsy-chosocial risks for teachers, making them the professional of spoken voice with higher incidence of voice disorders1 and becoming the subject of
much research in recent years2-9. Most studies
conducted with teachers in the Voice area discusses the assessment and diagnosis of voice disorders3,
which leads to relection about the presence of the
same and the lack of demand for guidance and speech therapy to the voice6-10. However, the relation
between the voice, its disorders and its signiicance for the faculty is more complex, and needs to be best explored.
ABSTRACT
Purpose: to associate and to correlate the voice handicap index, quality of life, vocal symptoms,
sex, vocal complaints and professional characteristics of professors in Santa Maria city (RS/Brazil).
Methods: 114 individuals, aged 20 to 66 years, 102 women and 12 men, professors of elementary
school responded to the protocols: Voice Symptom Scale, Voice Handicap Index and Voice-Related Quality of Life, a questionnaire containing data identiication, the overall health, occupational and
vocal complaints. Results: professors worked on average 6,96 hours a day, there are on average 12,7 years, 72,8% had vocal complaints, 50% belonged to the private school network, 37,7% to the state network and 12,3% to the municipal network. There was an association between voice self-assessment scales and presence of vocal complaints, there was no correlation with age and professional characteristics. Had a higher occurrence of vocal symptoms in women. The Voice
Symptom Scale and the Voice Handicap Index showed positive correlation and negative correlation
of both protocols in relation to Voice-Related Quality of Life. Conclusion: professors with complaints
showed higher occurrence of vocal symptoms, greater voice handicap index and lower quality of life
in voice, with a higher occurrence of vocal symptoms in females. There was complementarity between the vocal self-assessment protocols.
For the sampling process, the urban area of city was divided into regions, each with their respective neighborhoods. Was held a survey of schools that composed each region in the three school systems (36 private, 44 municipal and 24 state), being made three numbered lists in increasing order for each
region. Sampling was performed by rale random
of the three school systems, by region. Each
listing has a school excluded every couple of list,
resulting in 27 private, 31 municipal and 19 state. These schools were randomized, numbered again
in increasing order and raled, comprising the inal
list, we had a school deleted every two, resulting in
51 schools. All schools in the inal list were invited
to participate, and of these, 15 schools joined the IAF. At schools that have joined the IAF, all teachers
who have qualiied for inclusion criteria were invited
to participate.
Inclusion criteria were: faculty of elementary schools (1st to 9th grade) of private, state and municipal networks, only in the urban area; age
greater than 19 years in order to exclude altera -tions of the period of changing voices in teenagers;
both sexes; adherence FICF. The total number of
teachers at this level was 208.
Exclusion criteria were: self-reported account of
neurological, metabolic, endocrine, syndromic and/ or psychiatric diseases; self-reported of gastric crises or hormonal dysfunction resulting from pregnancy or premenstrual or menstrual on the data collection period; has structural pathologies or laryngeal disorders, hearing disorders detected in the hearing screening; self-reported history of laryngeal surgery and/or any head and neck surgical procedure; have performed speech-language-pathology and/ or otorhinolaryngological treatment for voice. It is
considered that these factors could inluence the
vocal self-perception of subjects as quality of voice and laryngeal physical symptoms.
To make it possible to apply the exclusion criteria
of the study, teachers completed a questionnaire and hearing screening was performed by scanning of pure tones at frequencies of 500, 1000, 2000, 4000Hz by 25dB, only through air conduction,
with Amplivoxaudiometer, A260 model, 2011. The procedure was performed in a silent room provided
by the school, with noise level below of 50dB, veriied
by measuring of the sound pressure Instrutherm, Dec-480 model. The subjects who did not respond to pure tone of 25dB were retested. Subjects who
did not pass the retesting were excluded of research
and forwarded to complete audiological assessment.
Of the 208 teachers, 14 were excluded from
the hearing screening, three for presenting reports of neurological pathologies; 16 due reports of endocrine disorders; seven have performed
existence of a correlation between the vocal perception of professor and its inluence on quality
of life20,21, however, there is agreement that the lack
of an accurate self-perception and knowledge about their own voice characteristics are common among teachers and make that public is in a risk group for the development of vocal pathologies22-25.
Generally the proposed instruments are composed of scale quantitative analysis, which facilitate the tests, however, have advantages and disadvantages15,26, there are studies that questioned
their processes of elaboration26 and inconsistency
between the subscales that the protocols intend to analyze15. Due to such results15,26, in this study three
protocols were used.
It is believed that the joint application and analysis of the Voice Symptom Scale (VoiSS),
Voice Handicap Index (VHI) and Voice-Related
Quality of Life (VRQL), can provide a general and realistic perspective on the perception of symptoms, handicap and voice-related quality of life15, since
many teachers believe that vocal alterations are normal and inherent in the profession, not developing the appropriate care with the voice27,28. Considering
the importance of self-perception and the quality of life in search for attendance and adherence to therapy27-29, it is meant that such data are
funda-mentals to the compression of the complex process
of health and disease of the teacher, that takes into consideration the working conditions and quality of life8-10.
Based on the considerations presented, the present study aimed to associate and correlate
the voice handicap index, quality of life, vocal symptoms, sex, vocal complaints and professional
characteristics of teachers in Santa Maria city (RS/ Brazil).
METHODS
That study characterized by being cross-sectional observational analytic of quantitative character, contemporary and prospective, approved by the Ethics Committee in Research from the home insti-tution (23081.016945/2010-76). Those responsible for educational institutions were informed about the research and signed the Institutional Authorization Form (IAF). The subjects interested in participating
received the necessary explanations about the
study and signed a Free and Informed Consent Form (FICF).
zero to 100, as higher the score was, better the quality of life13,15.
The data referring to occupational characteristics
(average length of professional experience as a teacher and daily activities), identiication (sex and
age) and vocal complaints (presence or absence of vocal complaints) were obtained from the question-naire in the sample selection.
After the data collection, all teachers received individual feedback session, and those who presented vocal self-assessment outside of the
expected patterns of normality were instructed and
forwarded to individual vocal assessment.
The collected data were tabulated and the variables were analyzed statistically using the
non-parametric tests, signiicance level of 5%
was adopted. Pearson correlation test was used to correlate the scales of vocal self together, and quantitative variables age, daily use of voice (hours) and time of practice (years). The ANOVA test was used to associate vocal self-assessment protocols for qualitative variables gender and presence or absence of vocal complaints.
RESULTS
The group of the teachers worked on average 6,96 hours a day, there are on average 12,7 years, 57 belonged to the private school network (50%), 43 belonged to the state network (37,7%), and 14 (12,3%) to the municipal network, with no
signiicant diference. Of the 114 teachers studied,
72,8% (n=83) had vocal complaints and 27,2% did
not present (n=31), with a signiicant diference
(p=<0,001).
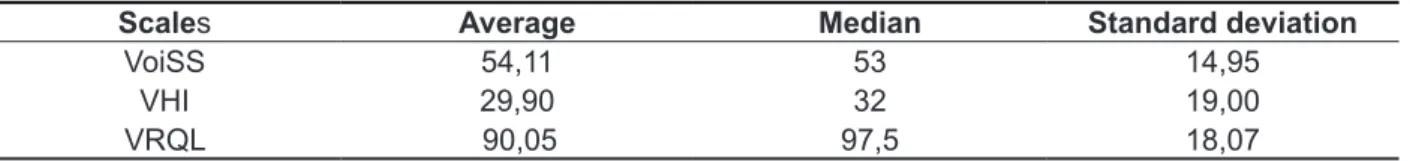
The Table 1 shows the descriptive results of vocal self-assessment scales, observing a total of
54,11 vocal symptoms, vocal handicap index of
29,90 points and a score of quality of life related to the voice of 90,05 points.
speech-language-pathology or otorhinolaryn-gological prior treatment for voice and 54 with incomplete data. Thus, the sample consisted by 114 individuals (aged 20 to 66 years with a mean of 37,76 years), 102 female and 12 male.
The data collection was composed by the appli-cation of vocal self-assessment protocols and quality of life related to voice: VoiSS, VHI and VRQL.
The VoiSS consists of thirty questions16,17. Each
question is scored according to the frequency of occurrence in: “never” (zero points), “rarely” (one point), “sometimes” (two points), “almost always” (three points) and “always” (four points)11,16.
The VHI protocol features 30 items14,18. Individuals
were instructed to mark on a graduated scale from
zero to four, the corresponding airmative, where
zero means “never” and four means “always”.
The VRQL questionnaire consists of ten questions that investigate the impact of a possible voice problem in the life of the subject. To answer the questionnaire, subjects were instructed to consider both the intensity of the problem, as their frequency of appearance, assessing each item on a scale
of one to ive, where one corresponds to “never happens and is not a problem” and ive corresponds
to “always happens and really is a bad problem”.
The faculties were instructed to ill out all data in
the header and the protocol, leaving the researchers
available to clarify possible questions while illing.
It was only analyzed the protocol’s total domain. The total VoiSS is also calculated by a simple summation of the value of each question indicates the general level of voice alteration and may have
a maximum of 120 points16,17. The calculation of the
VHI protocol was done by simple summation, in the other words, the higher the value, greater the voice handicap. The total summation of the VHI may vary from zero to 120 points14,18. For VRQL protocol was
used a standard algorithm, which may range from
Table 1 – Descriptive results of the scales of vocal self-assessment
Scales Average Median Standard deviation
VoiSS 54,11 53 14,95
VHI 29,90 32 19,00
VRQL 90,05 97,5 18,07
Descriptive analysis
At Table 4, show the results of the association between the scales of vocal self-assessment and the presence or absence of vocal complaints. The teachers with presence of voice complaints showed greater impairment in self-assessment scales.
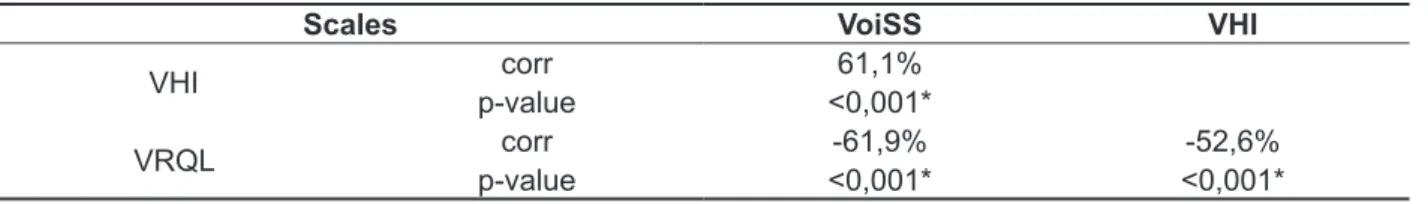
The Table 5 shows that there was a corre-lation between the total obtained in the vocal self-assessment scales.
In Table 2 shows the absence of correlation between the scales of vocal self-assessment and age, time of professional performance and daily use of the occupational voice.
The Table 3 shows the results of the association between vocal self-assessment scales and the
sex, with higher prevalence of vocal symptoms in
women.
Table 2 – Results of the correlation between the scales of vocal self-assessment and age, time of professional performance and daily use of the occupational voice
Scales Age
Time of Professional performance
Daily use of occupational voice (hours)
corr p-value corr p-value corr p-value
VoiSS VHI VRQL
8,4% 0,377 -8,9% 0,347 7,0% 0,459
5,5% 0,561 -7,8% 0,411 -6,3% 0,504
2,6% 0,787 -12,7% 0,177 4,7% 0,617
* Statistically signiicant values (p≤0,05) – Pearson Correlation Test
Legend: VoiSS=Voice Symptom Scale; VHI=Voice Handicap Index; VRQL=Voice-Related Quality of Life.
Table 3 – Results of the association between vocal self-assessment scales and sex
Scales Sex Average Median Standard
deviation p-value
VoiSS M
F 55,39 54,0 14,75
0,007*
43,17 39,0 12,31
VHI M
F 30,76 32,5 18,63
0,159
22,58 24,0 21,35
VRQL M
F 89,56 97,5 18,76
0,406
94,16 97,5 10,18
* Statistically signiicant values (p≤0,05) – ANOVA Test
Legend: VoiSS=Voice Symptom Scale; VHI=Voice Handicap Index; VRQL=Voice-Related Quality of Life; F=female; M=male.
Table 4 – Results of the association between vocal self-assessment scales and presence or absence of vocal complaints
Scales Vocal
complaints Average Median
Standard
deviation p-value
VoiSS PC
NC 43,39 41,0 10,30
<0,001*
58,11 56,0 14,47
VHI PC
NC 24,16 30,0 17,36
0,048*
32,05 33,0 19,24
VRQL PC
NC 96,53 97,5 6,63
0,018*
87,63 85,0 20,30
* Statistically signiicant values (p≤0,05) – ANOVA Test
Legend: VoiSS=Voice Symptom Scale; VHI=Voice Handicap Index; VRQL=Voice-Related Quality of Life; NC= no complaints; PC=
in Belgian research, where female teachers showed greater demand for professional assistance on vocal symptoms6.
In Brazil, a study that investigated the preva-lence of voice problems, the characteristics of the emergence of a dysphonia and its likely consequences in 3265 individuals, teachers and no-teachers, from 27 states showed that teachers reported a higher average of current symptoms (3,7) and past (3,6) and these symptoms related to work, and showing, also, that they anticipate limitations in their professional future35.
Even with the high index of dysphonia in these
workers, many teachers believe that vocal changes are normal and inherent in the profession, and despite vocal symptoms interfere in their
profes-sional practice, are generating necessity of modii -cations/adaptations of strategies in the classroom, they did not seem the interfere with interpersonal relations and their psychosocial welfare5,19. Study
with teachers of kindergarten and early elementary school grades reinforce such statements, because it shows that most teachers did not receive any information about vocal health in their training (72%), and despite relate to see a direct correlation
between voice and teaching exercise (77%), over
50% have remained voiceless in the past, and even then, only 32% looked for medical help28.
In this study, female teachers have signiicant
occurrence of vocal symptoms (Table 3), in agreement to researches which highest rates of voice disorders in teachers occurred in females by a ratio of 2,7:1, indicating predisposition of women to acquire a voice disorder, as much the
anatomical coniguration of the larynx, as the
biological aspects5,6,37. Moreover, the fact that the
fundamental frequency (f0) of the woman is close to f0 of children also creates the need for increased loudness in the classroom38. The female teachers
of elementary school not only actively participate in the labor market, as often also perform their domestic activities, performing “double journey” and accumulation of activities. This leads to physical and psychological stress, causing stress that can
DISCUSSION
The professional features found in the teachers of this study (average of 6,96h/class/day and an average of 12,7 years in the profession) were similar to the single search with similar thematic held in the same city ten years ago. This research was conducted with teachers of preschool and early elementary grades, where the majority of teachers worked eight hours daily (56,31%) and averaged
14,6 years of professional experience28. These data
show that independently of the school network and over time, teachers in the municipality of Rio Grande do Sul countryside seem to keep the professional features with discrete reduction in the working time and the time of profession.
In this work, a signiicant majority of teachers (72,8%) had vocal complaints, similar index to
that obtained in the study performed in the same county ten years ago, which was found 69%28;
results expected whereas teachers are the profes -sional class of higher incidence of voice disorders coming from occupational order, and studies show that the prevalence of some dysphonia degree the 17,15% to 80,7% of teachers 22,30-32. Despite the
large number of studies on teacher’s vocal health
in the scientiic literature, the literature shows that is complex the understanding of the health-disease process of the teacher, which extends from the lack
of information access during the training process, individual predisposition, the organizational and labor factors and the applicability of knowledge about vocal health in daily routine6,20,25,33,34.
The major complaints reported by Brazilian
teachers are tiredness or efort to speak, hoarseness
or persistent cough, voice failures; hoarseness; shortness of breath to speak; loss of voice or hoarseness; variation in vocal utterance; tightness; weight, pain, stinging, burning or dryness in the throat2,28,35. Brazilian study showed that although
vocal symptoms observed, the teachers do not seek professional help, only doing it when they have other symptoms associated as breathing problems or frame of aphonia36, diferent data to those found
Table 5 – Results of the correlation between the vocal self-assessment scales
Scales VoiSS VHI
VHI corr 61,1%
p-value <0,001*
VRQL corr -61,9% -52,6%
p-value <0,001* <0,001*
* Statistically signiicant values (p≤0,05) – Pearson Correlation Test
of vocal symptoms24, agreeing with the indings of
this study.
The literature indicates that individuals with symptoms or voice complaints, have lower levels of quality of life33,40, however, in respect to teachers,
despite being smaller, the indexes are still within expectations13,15,19, showing their lack of vocal
recog-nition and showing that this seems to be the reality
of teachers in Brazil, also veriied by this research.
The present analysis also showed, that as
expected, that there is coherence between the
protocols used regarding the proportionality of the
indings, since VoiSS and VHI showed signiicant positive correlation and there was a signiicant
negative correlation of both protocols in relation to VRQL (Table 5), evidencing that increased vocal symptoms goes in the same direction of greater
voice handicap index and lower quality of life related
to voice, teachers analyzed.
These results agree with research that applied VRQL, VHI and the Voice Activity and Participation
Proile in Brazilian dysphonic teachers and showed
that, despite the protocols not containing the same information in dysphonic teachers and there is
no equivalence between its subscales, they ofer
similar results in total scores15. This research also
shows that although a study has pointed out laws
in the patterns of development of VHI and VRQL, questioning their use26, joint implementation of the
VoiSS, VHI and VRQL protocols by analyzing only the total score proved relevant for understanding adequately the perception of voice-related quality of life of individuals.
In addition to the fundamental information about the vocal complaints predominance, the higher occurrence of symptoms in women and the relationship between the presence of complaints with higher amounts of symptoms, lower quality of life and greater voice handicap, the results of the study are of clinical interest by show to work with VRQL, VHI and VoiSS protocols, analyzing the total scores, provides consistent data, complementary and consistent about the population. It is suggested that such protocols be part of speech-language-pathology clinical diagnosis because the importance of vocal self-assessment in adherence of teachers to the therapeutic process.
It is suggested to perform longitudinal research that accompany from training teachers that seeking to better understand the vocal health-disease
process and ascertain the external factors that might be inluencing the high index of vocal complaints
present in this category contribute to the development of voice disorders7,39.
Other Brazilian studies show similar results to those found in the present study20,21,33.
Even with the high index quality of life and low
voice handicap (Table 1), showing good quality of life related to voice, it was observed that teachers with voice complaints had increased incidence
vocal symptoms, greater Voice Handicap Index and
lowest Voice-Related Quality of Life, with a signif-icant relationship between between these variables (Table 4).
This is conirmed the research that applied VRQL
in 120 elementary school teachers from municipal and state schools where most teachers rated themselves with good quality of life related to voice (average of 84,2 points in the total score), showing that the impact of voice on quality of life and work is still not very noticed by teachers20. Another study
that investigated the quality of life of 2.133 municipal elementary school teachers, through the application of VRQL and sociodemographic questions, of work organization and vocal health, general and mental, also got higher scores on VRQL in all areas (average of 90,6 in the socioemotional domain, 84,2 total domain and 79,4 in the physical domain)21.
Research that was analysis of vocal handicap of 36 teachers with vocal complaint from a public school found predominantly low degree of vocal handicap, within normal standards (77,8%), despite complaints related to voice40. However, diferent from
what occurred in this study, research that applied the VHI in undergraduate students in Pedagogy and the general population found a higher occurrence of vocal complaints in students (17,2%) than in the reference group (9,7%) with predominance of vocal handicap, among those reporting voice complaints when compared to students who did not complain, suggesting link between vocal complaints and the perception of quality of life33.
The association between teacher’s quality of
life, voice and vocal health issues was veriied in a
study of 128 high school teachers in state schools in work situation. The results showed that the majority of teachers rated their voice as good (42,2%), and mean total score VRQL questionnaire was 66 points.
Although reasonably satisied with the voice and quality of life, the teachers showed diiculties in the
perception of the health-disease process. Evidence disadvantaged aspects of quality of life and health needs that may have implications for vocal health in faculty23. The relationship between voice and quality
of life of teachers was also investigated in university professors, observing reports of voice satisfaction
females), greater voice handicap index and lowest
voice-related quality of life, there was complemen-tarity between the vocal self-assessment protocols used in research.
CONCLUSION
Teachers with voice complaints had increased incidence of vocal symptoms (higher occurrence in
RESUMO
Objetivo: associar e correlacionar índice de desvantagem vocal, qualidade de vida e sintomas vocais
com sexo, presença de queixas vocais e características proissionais de professores de Santa Maria
(RS/Brasil). Métodos: 114 indivíduos, entre 20 e 66 anos, 102 mulheres e 12 homens, professores do ensino fundamental das redes de ensino estadual, municipal e particular, que responderam aos instrumentos: Escala de Sintomas Vocais, Índice de Desvantagem Vocal e Qualidade de Vida em Voz,
um questionário, elaborado pelos pesquisadores, contendo dados de identiicação, de saúde geral, ocupacionais e presença ou ausência de queixas vocais. Resultados: os professores atuavam em
média 6,96h por dia, há, em média, 12,7 anos; 72,8% apresentavam queixas vocais; 50% pertenciam à rede de ensino particular, 37,7% à rede estadual e 12,3% à rede municipal. Houve associação entre as escalas de autoavaliação vocal e a presença de queixas vocais, não havendo correlação com idade e características proissionais. Houve maior ocorrência de sintomas vocais em mulheres. A Escala de Sintomas Vocais e o Índice de Desvantagem Vocal mostraram correlação positiva e houve correlação negativa de ambos os protocolos em relação ao Qualidade de Vida em Voz. Conclusão: professores
com queixas apresentaram maior ocorrência de sintomas vocais, maior índice de desvantagem vocal e menor de qualidade de vida relacionada a voz, havendo maior ocorrência de sintomas vocais no sexo feminino. Houve complementaridade entre os instrumentos de autoavaliação vocal.
DESCRITORES: Docentes; Qualidade de Vida; Questionários; Saúde do Trabalhador; Voz
REFERENCES
1. Smolander S, Huttunen K. Voice problems
experienced by innish comprehensive school
teachers and realization of occupational health care. Logoped Phoniatr Vocol. 2006;31(4):166-71. 2. Caporossi C, Ferreira LP. Sintomas vocais e fatores relativos ao estilo de vida em professores. Rev CEFAC. 2011;13(1):132-9.
3. Dragone ML, Ferreira LP, Giannini SPP, Simões-Zenari M, Vieira VP, Behlau M. Voz do professor: uma
revisão de 15 anos de contribuição fonoaudiológica.
Rev Soc Bras Fonoaudiol. 2010;15(2):289-96. 4. Choi-Cardim K, Behlau M, Zambon F. Sintomas
vocais e peril de professores em um programa de saúde vocal. Rev CEFAC. 2010;12(5):811-9.
5. Musial PL, Dassie-Leite AP, Zaboroski AP,
Casagrande RC. Interferência dos sintomas vocais na atuação proissional de professores. Distúrb
Comun. 2011;23(3): 335-41.
6. Van-Houtte E, Claeys S, Wuyts F, Van-Lierde K. The impact of voice disorders among teachers: vocal complaints, treatment-seeking behavior, knowledge
of vocal care, and voice-related absenteeism. J Voice. 2011;25(5):570-5.
7. Rocha LMR, Souza LDM. Voice Handicap
Index Associated With Common Mental Disorders
in Elementary School Teachers. J Voice. 2013;27(5):595-602.
8. Almeida LD, Santos LR, Bassi IB, Teixeira LC,
Gama ACC. Relationship between adherence to speech therapy in patients with dysphonia and quality of life. J Voice. 2013;27(5):617-21.
9. Pizolato RA, Rehder MIBC, Dias CTS, Meneghim MC, Ambrosano GMB, Mialhe FL et al. Evaluation
of the efectiveness of a voice training program for
teachers. J Voice. 2013;27(5):603-10.
10. Kasama ST, Brasolotto AG. Percepção vocal e qualidade de vida. Pró-Fono R Atual Cient.
2007;19(1):19-28.
11. Deary IJ, Wilson JA, Carding PN, Mackenzie K. VoiSS: a patient-derived voice symptom scale. J Psychosom Res. 2003;54(3):483-9.
12. Wilson JA, Webb A, Carding PN, Steen IN, Mackenzie K, Dearly IJ. The Voice Symptom
27. Park K, Behlau M. Sinais e sintomas da
disfunção autônoma em indivíduos disfônicos. J
Soc Bras Fonoaudiol. 2011;23(2):164-9.
28. Tomazzetti CT. A voz do professor: instrumento
de trabalho ou problema no trabalho [Dissertação].
Santa Maria (RS): Universidade Federal de Santa Maria; 2003.
29. Rogerson J, Dodd B. Is there an efect of
dysphonic teachers’ voices on children’s processing of spoken language? J Voice. 2005;19(1):47-60.
30. Simões M, Latorre MRDO. Prevalência de alteração vocal em educadoras e sua relação com a autopercepção. Rev Saúde Pública.
2006;40(6):1013-8.
31. Sliwinska-Kowalska M, Niebudek-Bogusz E, Fiszer M, Los-Spychalska T, Kotylo P, Sznurowska-Przygocka B. The prevalence and risk factors for occupational voice disorders in teachers. Folia Phoniatr Logop. 2006;58(2):85-101.
32. Jardim R, Barreto SM, Assunção AA. Disfonia: deinição de caso e prevalência em professores.
Rev Bras Epidemiol. 2007b;10(4):625-36.
33. Thomas G, Kooijman PG, Cremers CW, De-Jong FI. A comparative study of voice complains and risk factors for voice complaints in female student teachers and practicing teachers early in their career. Eur Arch Otorrinolaryngol. 2006;263(4):370-80.
34. Santana MCCP, Goulart BNG, Chiari BM.
Distúrbios da voz em docentes: revisão crítica
da literatura sobre a prática da vigilância em
saúde do trabalhador. J Soc Bras Fonoaudiol.
2012;24(3):288-95.
35. Behlau M, Zambon F, Guerrieri AC, Roy N. Epidemiology of voice disorders in teachers and nonteachers in Brazil: prevalence and adverse
efects. J Voice. 2012;26(5):665-9.
36. Medeiros AM, Assunção AA, Barreto SM. Alterações vocais e cuidados de saúde em
professores. Rev CEFAC. 2012;14(4):697-704.
37. Ziegler A, Gillespie AI, Abbott KV. Behavioral treatment of voice disorders in teachers. Folia Phoniatr Logop. 2010;62(1):9-23.
38. Souza CL. Distúrbio vocal em professores da educação básica da cidade de Salvador- BA [Dissertação]. Salvador (BH): Universidade Federal
da Bahia; 2008.
39. Holmqvist S, Santilla P, Lindstrom E, Sala E, Simberg S. The association between possible stress markers and vocal symptoms. J Voice. 2013
[no prelo].
(VHI): a comparison of structure and content. Clin Otolaryngol Allied Sci. 2004;29(2):169-74.
13. Gasparini G, Behlau M. Quality of Life: Validation of the Brazilian version of the Voice-Related Quality of Life (V-RQOL) Measure. J Voice. 2009;23(1):76-81.
14. Behlau M, Oliveira G, Santos LMA, Ricarte A.
Validação no Brasil de protocolos de auto-avaliação do impacto de uma disfonia. Pró-Fono R Atual
Cient. 2009;21(4):326-32.
15. Tutya AS, Zambon F, Oliveira G, Behlau M.
Comparação dos escores dos protocolos QVV, IDV
e PPAV em professores. Rev Soc Bras Fonoaudiol. 2011;16(3):273-81.
16. Moreti F, Zambon F, Oliveira G, Behlau M.
Adaptação transcultural da versão brasileira da
escala de sintomas de voz: VoiSS. J Soc Bras Fonoaudiol. 2011;23(4):398-400.
17. Moreti FTG. Validação da versão brasileira da Voice Symptom Scale – VoiSS. Rev Soc Bras
Fonoaudiol. 2012;17(2):238.
18. Behlau M, Santos LMA, Oliveira G. Cross Cultural adaptation and validation of the voice
handicap index into Brazilian Portuguese. J Voice.
2009;25(3):354-9.
19. Hogikyan ND, Sethuraman G. Validation of an instrument to measure Voice-Related Quality of Life (V-RQOL). J Voice. 1999;13(4):557-69.
20. Grillo MHMM, Penteado RZP. Impacto da voz na qualidade de vida de professore(a)s do
ensino fundamental. Pró-Fono R Atual Cient.
2005;17(3):321-30.
21. Jardim R, Barreto SM, Assunção AA. Condições de trabalho, qualidade de vida e disfonia entre docentes. Cad Saúde Pública.
2007a;23(10):2439-61.
22. Munier C, Kinsella R. The prevalence and impact of voice problems in primary school teachers. Occup Med. 2008;58(1):74-6.
23. Penteado RZ, Pereira IMTB. Qualidade de vida
e saúde vocal de professores. Rev Saúde Pública.
2007;41(2):236-43.
24. Fabricio MZ, Kasama ST, Martinez EZ. Qualidade de vida relacionada à voz de professores universitários. Rev CEFAC. 2010;12(2):280-7.
25. Morais EPG, Azevedo RR, Chiari BM.
Correlação entre voz, autoavaliação vocal e
qualidade de vida em voz de professoras. Rev CEFAC. 2012;14(5):892-900.
Católica de Campinas. Disponível em: http://www.
puc-campinas.edu.br/websist/portal/pesquisa/ic/ pic2010/resumos/2010924_185248_502028297_ resl%C3%A1v.pdf. Acesso em 20 de maio de 2013. 40. Puccini FRS, Servilha EAM. Voz e qualidade
de vida: avaliação da desvantagem vocal em professores. Encontro de Iniciação Cientíica da PUC-Campinas. 2010. Pontíice Universidade
Received on: February 25, 2014 Accepted on: July 17, 2014
Mailing address: Carla Aparecida Cielo
UFSM – Av. Roraima nº 1000 – Cidade Universitária – Bairro Camobi Prédio 26 – 4º andar – Departamento de
Fonoaudiologia
Santa Maria – RS – Brasil
CEP: 97105-900