Effect of salt intake and potassium
supplementation on brachial-ankle pulse
wave velocity in Chinese subjects:
an interventional study
Y. Wang
1,2, J.J. Mu
1,2, L.K. Geng
1, D. Wang
1,2, K.Y. Ren
1,2, T.S. Guo
1,2, C. Chu
1, B.Q. Xie
1,2,
F.Q. Liu
1,2and Z.Y. Yuan
1,2 1Cardiovascular Department, First Affiliated Hospital of Medical College, Xi’an Jiaotong University, Xi’an, P. R. China 2Key Laboratory of Environment and Genes Related to Diseases, Ministry of Education, Xi’an, P. R. ChinaAbstract
Accumulating evidence has suggested that high salt and potassium might be associated with vascular function. The aim of this study was to investigate the effect of salt intake and potassium supplementation on brachial-ankle pulse wave velocity (PWV) in Chinese subjects. Forty-nine subjects (28-65 years of age) were selected from a rural community of northern China. All subjects were sequentially maintained on a low-salt diet for 7 days (3.0 g/day NaCl), a high-salt diet for an additional 7 days (18.0 g/day NaCl), and a high-salt diet with potassium supplementation for a final 7 days (18.0 g/day NaCl++4.5 g/day KCl). Brachial-ankle PWV was measured at baseline and on the last day of each intervention. Blood pressure levels were significantly increased from the low-salt to high-salt diet, and decreased from the high-salt diet to high-salt plus potassium supplementation. Baseline brachial-ankle PWV in salt-sensitive subjects was significantly higher than in salt-resistant subjects. There was no significant change in brachial-ankle PWV among the 3 intervention periods in salt-sensitive, salt-resistant, or total subjects. No significant correlations were found between brachial-ankle PWV and 24-h sodium and potassium excretions. Our study indicates that dietary salt intake and potassium supplementation, at least in the short term, had no significant effect on brachial-ankle PWV in Chinese subjects.
Key words: Pulse wave velocity; Salt; Potassium; Interventional study
Introduction
Excess dietary salt has been considered to be a contributing factor to the development of hypertension. Several human studies have shown a causal link between high salt intake, high blood pressure (BP), and cardiovas-cular disease (1). Similarly, the reduction of dietary salt intake has been shown to decrease BP (1). In addition to increasing BP, high dietary salt may independently damage vascular function. This can lead to hypertrophy of arterial walls and vascular smooth muscle, increasing arterial stiffness, and affecting arterial vessel contractility (2,3), especially in salt-sensitive (SS) individuals (4). Salt sensitivity, a phenomenon for heterogeneous BP responses to changes in dietary sodium intake, is observed in hypertensive and normotensive individuals (5).
A number of studies have suggested that potassium is strongly correlated with hypertension (6), and the role of dietary potassium in the pathogenesis of related vascular
disease is recognized (7). Potassium intake helps to downregulate BP and inhibits neointimal proliferation in animals (8,9). Increasing evidence also suggests that a higher potassium intake may have beneficial effects on arterial compliance and arterial stiffness (10). However, most previous trials were cross-sectional and animal studies. Few interventional trials have studied the effect of high salt intake and potassium supplementation on arterial stiffness.
Pulse wave velocity (PWV) is the most widely used measure of arterial stiffness in a wide variety of clinical fields (11). The measurement of the carotid-femoral PWV has been used as a conventional and common procedure (12). Brachial-ankle PWV measurements have recently been widely applied using a procedure in which pressure cuffs are wrapped around the brachial artery. In compar-ison with carotid-femoral PWV, brachial-ankle PWV can
Correspondence: Jian-Jun Mu:,[email protected].
be widely applied during routine medical examinations because its measurement is simple and does not require specialized and highly technical equipment and expertise (13). The measurements have been reported to be valid and reproducible and easier to perform than other noninvasive automatic procedures (14,15). More impor-tantly, brachial-ankle PWV is a significant and independ-ent predictor of cardiovascular morbidity and mortality in patients on hemodialysis and with acute coronary syndrome (16,17). However, the relationship between brachial-ankle PWV and high salt or potassium has not been fully established.
The present study was designed to examine the effect of excessive salt intake and potassium supplementation on brachial-ankle PWV in Chinese subjects. We also aimed to examine whether brachial-ankle PWV is differentially modified in SS and salt-resistant (SR) individuals.
Material and Methods
Study population
Forty-nine subjects with similar dietary habits from a rural community of northern China were enrolled in the present study. Data on demographic characteristics (age, gender, education, occupation, physical activity, cardio-vascular disease-related history, and physical examination findings) were collected using a standard questionnaire. Hypertension was defined as a mean BP>140 mmHg for systolic BP (SBP) and/or >90 mmHg for diastolic BP (DBP). Because BP levels could increase after dietary intervention, we excluded those with Stage 2 hypertension, for safety concerns. The other exclusion criteria were a history of clinical cardiovascular disease, chronic kidney disease, or diabetes, use of antihypertensive medication, and high alcohol intake.
The institutional ethics committee of Xi’an Jiaotong University Medical School approved the study protocol, and each subject provided written informed consent to participate. This study adhered to the principles of the Declaration of Helsinki, and all study procedures were performed in accordance with institutional guidelines.
Dietary intervention
The protocol for chronic salt loading and potassium supplementation intervention was performed as described previously (18,19). The protocol consisted of a series of investigations, including a questionnaire survey and physical examination (height, weight, waist circumfer-ence, and BP measurements) during a 3-day baseline observation period, a low-salt diet for 7 days (3 g salt or 51.3 mmol sodium per day), a high-salt diet for 7 days (18 g salt or 307.8 mmol sodium per day), and a high-salt diet with potassium supplementation for 7 days (18 g salt or 307.8 mmol sodium ++ 4.5 g/day potassium or 60 mmol potassium per day). During the baseline period, each subject was given detailed dietary instructions to
avoid table salt, cooking salt, and high-salt foods for the 21-day study duration. To ensure study participants’ compliance with the intervention program, they were required to have their breakfast, lunch, and dinner at the study kitchen under supervision of the study staff during the entire study period. All foods were cooked without salt. On-site study staff members added prepackaged salt to the individual subjects’ meals as indicated by the study protocol.
BP measurement and definition of salt sensitivity BP was measured by 3 trained staff members using a standard mercury sphygmomanometer, with the subjects in the sitting position after a >5-min rest. BP was measured 3 times at 1-min intervals during the 3-day baseline observation period as well as on days 6 and 7 of each of the three 7-day intervention periods. BP obser-vers were blinded to the participants’ dietary interventions. The subjects were instructed to avoid alcohol, cigarette smoking, coffee/tea, and exercise for at least 30 min prior to their BP measurement. SBP and DBP were determined as the first and fifth Korotkoff sounds, respectively. The pulse pressure was calculated as SBP minus DBP. Mean arterial pressure (MAP) was calculated as DBP++ (1/36pulse pressure). Because of the lack of universal consensus on the definition of salt sensitivity of BP, subjects with a>10 mmHg increase in MAP going from a low- to a high-salt diet were classified as SS, and those with a,10 mmHg increase as SR (19,20).
Brachial-ankle PWV measurement and definition of brachial-ankle PWV response to dietary intervention
Brachial-ankle PWV was measured using a volume-plethymographic apparatus (BP-203RPEII; Nihon Colin, Japan). Details of the methodology are described else-where (14). In brief, the subjects were examined while resting in the supine position. This device simultaneously records right and left brachial and tibial arterial pressure wave forms. Electrocardiographic electrodes were attached to both wrists, and cuffs were wrapped around both upper arms and ankles. The pulse-volume wave form in the upper arm and ankle were recorded using a semiconductor pressure sensor after the subject had rested for at least 5 min. Brachial-ankle PWV is usually represented in units of centimeters per second. Brachial-ankle PWV responses were defined as follows: response to low-salt equals brachial-ankle PWV on a low-salt diet minus brachial-ankle PWV at baseline; response to high salt equals brachial-ankle PWV on a high-salt diet minus brachial-ankle PWV on a low-salt diet; and response to potassium supplement equals brachial-ankle PWV on a high-salt diet with potassium supplementation minus brachial-ankle PWV on a high-salt diet.
Biochemical analyses
puncture, immediately centrifuged at 3000g for 10 min, and stored at ––806C until analyzed. The total cholesterol, triglyceride, low-density lipoprotein cholesterol (LDL-C), high-density lipoprotein cholesterol (HDL-C), serum creat-inine, and fasting plasma blood glucose levels were measured using an automatic biochemical analyzer (model 7600; Hitachi, Ltd., Japan).
Twenty-four-hour urinary salt and potassium determination
Twenty-four-hour urine samples were collected at baseline and on day 7 of each intervention period. The samples were kept frozen at ––406C until analysis. Urinary concentrations of salt and potassium were determined using ion-selective electrodes (Hitachi, Ltd.). The 24-h urinary excretion of sodium and potassium was calculated by multiplying the concentration of sodium and potassium, respectively, by the 24-h total urine volume.
Statistical analyses
Continuous data are reported as means±SD. Categorical data are reported as frequency and percen-tage. Differences in baseline characteristics between SS and SR groups were detected by an independentt-test for continuous variables and chi-square test for categorical variables. Differences in repeated measures were ana-lyzed by repeated-measures analysis of variance. Correlations were determined with Pearson’s correlation coefficient, if the residuals were normally distributed, and with Spearman’s correlation coefficient, if not. Statistical analyses were performed with SPSS for Windows, version 16.0 (SPSS Inc., USA). A two-tailed P value of
,0.05 was considered to be statistically significant.
Results
Profiles of studied subjects
Of the 54 volunteers, 49 subjects met the inclusion criteria and commenced the study. One participant with-drew after completing two interventions due to hospitali-zation of her relative. Ten subjects, who showed a response of an increase in MAP of >10 mmHg from low-salt to high-salt periods, were considered SS. The remaining 38 subjects were considered SR. Baseline characteristics were evenly distributed, except for bra-chial-ankle PWV, which was significantly higher in the SS group than in the SR group (P,0.05, Table 1).
Effects of salt intake and potassium supplementation on BP and 24-h urinary sodium and potassium excretion
Overall, BP levels increased from the low-salt inter-vention to the high-salt interinter-vention, and decreased from the high-salt intervention to the high-salt plus potassium supplementation intervention. In addition, BP levels in SS subjects after salt intake were significantly higher than in
SR subjects. Potassium supplementation reduced the BP in SS subjects on a high-salt diet (P,0.05; Table 2).
The urinary 24-h sodium and potassium excretions were calculated at the end of each intervention period to ensure the subjects’ compliance with the study protocol. As shown in Table 2, urinary sodium excretion signifi-cantly increased with the change from the low-salt to the high-salt diet (P,0.05). Potassium supplementation resulted in an increase in urinary potassium excretion and a slight increase in urinary sodium excretion in the 3 groups. These results confirmed the subjects’ compliance with the dietary intervention protocol.
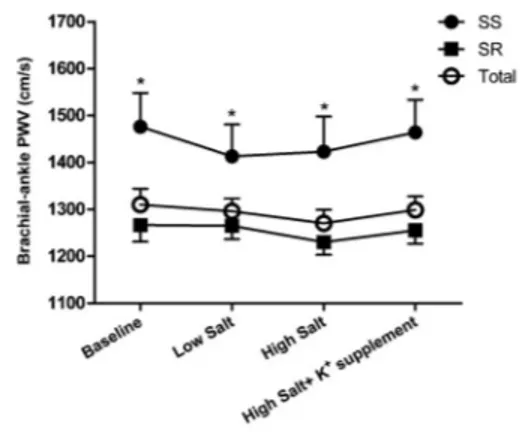
Effects of salt intake and potassium supplementation on brachial-ankle PWV
Figure 1 shows brachial-ankle PWV levels during the low-salt, high-salt, and high-salt plus potassium supple-mentation interventions. Compared with the SR group, brachial-ankle PWV was significantly higher in SS subjects at baseline and during dietary interventions (P,0.05). However, there were no statistical differences in brachial-ankle PWV among the 3 intervention periods in SS, SR, and total groups (P.0.05). To further increase the statistical power of the study, we also made a comparison of brachial-ankle PWV responses to salt intake and potassium supplementation between the SS and SR groups, but we still found no significant differences (Table 3).
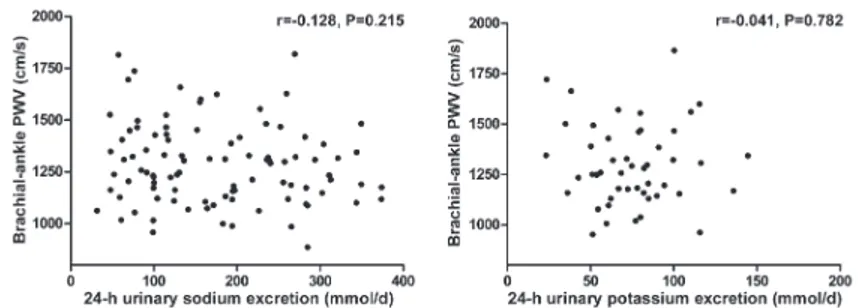
Further analyses showed that brachial-ankle PWV was not correlated with 24-h urinary sodium excretion during the low-salt and high-salt diet intervention periods (r=––0.128, P=0.215; Figure 2), and was not related to 24-h urinary potassium excretion during the high-salt diet plus potassium supplementation intervention period (r=––0.041, P=0.782; Figure 2).
Discussion
In the present study, we found that high salt intake for 7 days could increase BP, but it did not enhance brachial-ankle PWV. In addition, no significant correlation between 24-h urinary sodium excretion and brachial-ankle PWV was demonstrated in these Chinese subjects. These data indicate that dietary salt intake, at least within a short period, did not significantly influence brachial-ankle PWV levels.
Table 1. Baseline demographic and clinical characteristics.
Parameters Total SS SR P
Age (years) 49.0 ± 7.9 50.8 ± 5.3 48.5 ± 8.4 0.422
Gender (M/F) 23/25 6/4 17/21 0.487
Body mass index (kg/m2) 23.6 ± 2.9 22.8 ± 2.5 23.8 ± 3.0 0.378
Alcohol 4 (8.3) 0 (0) 4 (10.5) 0.566
Smoking 19 (39.6) 5 (50) 14 (36.8) 0.487
Hypertension 5 (10.4) 2 (20) 3 (7.9) 0.569
Systolic blood pressure (mmHg) 110.5 ± 14.6 118.0 ± 17.8 108.5 ± 13.2 0.065 Diastolic blood pressure (mmHg) 72.7 ± 8.6 73.7 ± 7.8 72.4 ± 8.8 0.688 Mean arterial pressure (mmHg) 85.3 ± 10.0 88.5 ± 10.5 84.5 ± 9.9 0.265 Brachial-ankle PWV (cm/s) 1310 ± 234 1476 ± 227 1266 ± 218 0.01
Glucose (mM) 3.87 ± 0.68 3.72 ± 0.43 3.91 ± 0.73 0.429
Total cholesterol (mM) 4.08 ± 0.88 4.05 ± 0.89 4.09 ± 0.89 0.894 Triglycerides (mM) 1.31 ± 0.66 1.36 ± 1.03 1.30 ± 0.54 0.795 LDL-cholesterol (mM) 2.28 ± 0.72 2.26 ± 0.69 2.28 ± 0.74 0.931 HDL-cholesterol (mM) 1.19 ± 0.23 1.16 ± 0.30 1.2 ± 0.22 0.696 Serum creatinine (mM) 56.3 ± 8.6 58.2 ± 6.7 55.8 ± 9.1 0.452
24-h urinary sodium (mmol/d) 173.9 ± 67.1 175.3 ± 51.3 173.5 ± 71.3 0.941 24-h urinary potassium (mmol/d) 47.4 ± 20.1 40.4 ± 21.2 49.2 ± 19.6 0.223
Data are reported as means±SD or number with percent in parentheses. SS: salt-sensitive subjects; SR: salt-resistant subjects; PWV: pulse wave velocity; LDL: low-density lipoprotein; HDL: high-density lipoprotein. The independentt-test and chi-square test were used for statistical analyses.
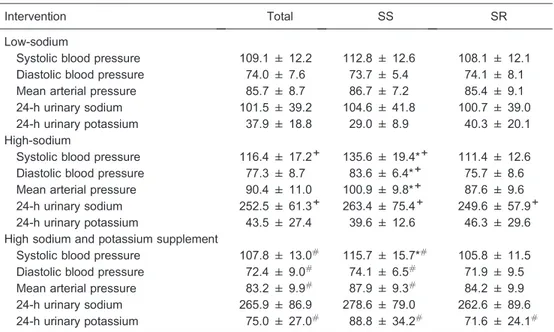
Table 2. Influence of dietary intervention on blood pressure levels (mmHg) and 24-h urinary sodium and potassium excretions (mmol/d).
Intervention Total SS SR
Low-sodium
Systolic blood pressure 109.1 ± 12.2 112.8 ± 12.6 108.1 ± 12.1 Diastolic blood pressure 74.0 ± 7.6 73.7 ± 5.4 74.1 ± 8.1
Mean arterial pressure 85.7 ± 8.7 86.7 ± 7.2 85.4 ± 9.1
24-h urinary sodium 101.5 ± 39.2 104.6 ± 41.8 100.7 ± 39.0 24-h urinary potassium 37.9 ± 18.8 29.0 ± 8.9 40.3 ± 20.1 High-sodium
Systolic blood pressure 116.4 ± 17.2+ 135.6 ± 19.4*+ 111.4 ± 12.6 Diastolic blood pressure 77.3 ± 8.7 83.6 ± 6.4*+ 75.7 ± 8.6 Mean arterial pressure 90.4 ± 11.0 100.9 ± 9.8*+ 87.6 ± 9.6 24-h urinary sodium 252.5 ± 61.3+ 263.4 ± 75.4+ 249.6 ± 57.9+ 24-h urinary potassium 43.5 ± 27.4 39.6 ± 12.6 46.3 ± 29.6 High sodium and potassium supplement
Systolic blood pressure 107.8 ± 13.0# 115.7 ± 15.7*# 105.8 ± 11.5 Diastolic blood pressure 72.4 ± 9.0# 74.1 ± 6.5# 71.9 ± 9.5 Mean arterial pressure 83.2 ± 9.9# 87.9 ± 9.3# 84.2 ± 9.9 24-h urinary sodium 265.9 ± 86.9 278.6 ± 79.0 262.6 ± 89.6 24-h urinary potassium 75.0 ± 27.0# 88.8 ± 34.2# 71.6 ± 24.1#
Data are reported as means±SD. BP: blood pressure; SS: salt-sensitive subjects; SR: salt-resistant subjects. * P,0.05 vs SR,+P
,0.05 vs low-salt diet, #P
changes in PWV in the context of dietary salt alterations, and results are conflicting. Todd et al. (22) reported that carotid-femoral PWV increased significantly from baseline after 4 weeks on high-salt diets in hypertensive patients. In contrast, the same group found no differences in carotid-femoral PWV or BP in 23 normotensive subjects who followed a low-sodium diet for 2 weeks and then high-salt diets for 4 weeks (23). Recently, Liu et al. (24) demonstrated that high-salt intake not only elevated BP, but also increased arterial stiffness. However, in that study, they used ambulatory arterial stiffness index (AASI) and symmetric AASI (s-AASI) as indicators of arterial stiffness, rather than classic techniques such as PWV. AASI is calculated based on data of 24-hour ambulatory blood pressure, and it is seriously limited due to the strong relationship with nocturnal BP fall, heart rate, and its ambulatory monitoring technique (25,26). In the present study, when brachial-ankle PWV was used as a measure-ment of arterial stiffness, we were unable to confirm a significant effect of high-salt intake on arterial stiffness.
Potassium intake helps to lower BP by increasing sodium excretion (19,27). A study in normotensive Blacks found that salt sensitivity occurred when dietary potassium intake was just marginally deficient and that it was dose-dependently suppressed when potassium intake was increased, suggesting that the potassium supplementation
might prevent or delay the occurrence of hypertension (28). Our previous study demonstrated that a moderate increase in the potassium intake in children could significantly downregulate BP in children with salt sensitivity but not in SR subjects (27). The results of our study, in which potassium supplementation substantially reduced BP in SS individuals, are in agreement with the above observations. Furthermore, high levels of dietary potassium tend to be associated with better vascular reactivity. In a cross-sectional study, the relationship between potassium intake and vascular structure and function is not linear, but rather resembles a J-shaped curve when adjusted for age, gender, and related variables (29). He et al. (10) observed that an increase in potassium intake significantly increased arterial compliance in mildly hypertensive patients, even in individuals already on relatively low-salt and high-potassium diets. A recent randomized trial in 155 subjects indicated that increased dietary potassium produced improved arterial compliance (24). In contrast, in a randomized controlled trial, potassium intake showed no benefit in terms of BP and arterial stiffness in early-stage hypertensive patients (30). In agreement with that study, our study provided no evidence for the beneficial effects of potassium intake on arterial stiffness, measured by changes in brachial-ankle PWV.
There are a number of possible explanations for these discrepant results. First, due to the short 7-day dietary interventions, changes in brachial-ankle PWV may not have been obvious nor had sufficient time to fully develop. Second, the difference between the selected populations may also explain the inconsistent and sometimes para-doxical findings. For example, 89.6% of subjects in our study were normotensive, and as reported, dietary salt loading in normotensive volunteers did not increase carotid-femoral PWV after high-salt diets for 4 weeks (23). However, the same group also demonstrated that high salt could produce significant increases in carotid-femoral PWV in hypertensive subjects (22). In addition, measurements of only one arterial bed may not result in differences among different interventions. Finally, various measurements of arterial stiffness and the intervention method among these various studies may also affect the outcomes. Thus, larger studies are required to test these possibilities.
An interesting observation in this study was that Figure 1.Brachial-ankle pulse wave velocity (PWV) at baseline
and during the low-salt, high-salt, and high-salt plus potassium supplementation intervention periods in total, salt-sensitive (SS), and salt-resistant (SR) subjects. *P,0.05 vs SR subjects (repeated-measures analysis of variance).
Table 3. Brachial-ankle pulse wave velocity (cm/s) response to salt and potassium supplementation of participants.
Response to Total SS SR
Low salt ––14.4 ± 103.4 ––63.3 ± 66.1 ––1.6 ± 17.5 High salt ––25.2 ± 103.0 10.0 ± 124.6 ––34.5 ± 96.4 Potassium supplement 28.2 ± 104.8 41.1 ± 145.3 24.8 ± 93.6
baseline brachial-ankle PWV in SS individuals was significantly higher than in SR individuals. Although the molecular mechanisms for this are unclear now, there may be some possibilities. Because arterial stiffness is driven by age and systolic blood pressure, brachial-ankle PWV shows a higher trend with the increase in age and BP levels (31). However, we could eliminate this effect because no differences were found in terms of age and BP levels between SS and SR subjects at baseline. This study and our previous survey showed that the dietary pattern of northern Chinese people is characterized by high sodium intake and insufficient intake of potassium (19,27). It has been shown that levels of plasma insulin and vascular endothelial growth factor C are significantly increased in SS compared with SR subjects on a high-salt diet (32,33). In addition, anin vitro study demonstrated that insulin could promote vascular smooth muscle cell proliferation and migration, which might contribute to the progression of arterial stiffness (34). In addition, inflam-matory factors are important mediators of arterial stiff-ness. Larrousse et al. (35) reported that hypertensive SS patients exhibited higher levels of proinflammatory cyto-kines, such as monocyte chemoattractant protein-1, E-selectin, and p-E-selectin, than hypertensive SR patients. Furthermore, transforming growth factor-band endothelial dysfunction may play a role in mediating vascular stiffness related to salt intake in SS individuals (36,37). Our previous study demonstrated that flow-mediated dilatation measurements were significantly lower in SS subjects than in SR subjects and correlated negatively with the
degree of salt sensitivity (37). However, further studies are needed to prove these hypotheses.
The present study has some limitations that should be acknowledged. First, the study population was relatively small and restricted to northern Chinese individuals. Therefore, our results will require replication in other cohorts to determine generalizability to other ethnicities and to populations with different backgrounds. Additionally, because the duration of different dietary interventions in this study was 7 days, the long-term effects of sodium and potassium on brachial-ankle PWV should be determined in the future studies.
In summary, the present study has shown that excess salt and potassium supplementation, at least within the short period, might have no significant effect on brachial-ankle PWV in Chinese subjects. These findings may contribute to a better understanding of the roles of salt and potassium in vascular stiffness and may have potential clinical and public health implications.
Acknowledgments
We are indebted to the participants in the study for their outstanding commitment and cooperation. Research supported by the National Program on Key Basic Research Project of China grant #2012CB517804 (973 Program) and grants#81200512 (F.Q. Liu), #81070218 and #81370357 (J.J. Mu) from the Natural Science Foundation of China.
References
1. Meneton P, Jeunemaitre X, de Wardener HE, MacGregor GA. Links between dietary salt intake, renal salt handling, blood pressure, and cardiovascular diseases.Physiol Rev 2005; 85: 679-715, doi: 10.1152/physrev.00056.2003. 2. Sanders PW. Dietary salt intake, salt sensitivity, and
cardiovascular health. Hypertension 2009; 53: 442-445, doi: 10.1161/HYPERTENSIONAHA.108.120303.
3. Polonia J, Maldonado J, Ramos R, Bertoquini S, Duro M, Almeida C, et al. Estimation of salt intake by urinary sodium excretion in a Portuguese adult population and its relation-ship to arterial stiffness.Rev Port Cardiol2006; 25: 801-817. 4. Avolio A. Salt sensitivity and arterial structure and function.
J Hypertens 2003; 21: 251-253, doi: 10.1097/00004872-200302000-00009.
5. Weinberger MH. Salt sensitivity of blood pressure in humans.Hypertension1996; 27: 481-490, doi: 10.1161/01. HYP.27.3.481.
6. Adrogue HJ, Madias NE. Sodium and potassium in the pathogenesis of hypertension.N Engl J Med 2007; 356: 1966-1978.
7. Kanbay M, Chen Y, Solak Y, Sanders PW. Mechanisms and consequences of salt sensitivity and dietary salt intake.Curr Opin Nephrol Hypertens2011; 20: 37-43, doi: 10.1097/MNH. 0b013e32834122f1.
8. Khaw KT, Thom S. Randomised double-blind cross-over trial of potassium on blood-pressure in normal subjects. Lancet1982; 2: 1127-1129, doi: 10.1016/S0140-6736(82) 92787-8.
9. Ma G, Srivastava NT, Anderson PG, Grady AW, Skelton TN, Lyle K, et al. Elevated potassium intake inhibits neointimal proliferation in the swine coronary artery.Am J Hypertens2001; 14: 879-886.
10. He FJ, Marciniak M, Carney C, Markandu ND, Anand V, Fraser WD, et al. Effects of potassium chloride and potassium bicarbonate on endothelial function, cardiovas-cular risk factors, and bone turnover in mild hypertensives. Hypertension2010; 55: 681-688, doi: 10.1161/HYPERTEN SIONAHA.109.147488.
11. Benetos A, Waeber B, Izzo J, Mitchell G, Resnick L, Asmar R, et al. Influence of age, risk factors, and cardiovascular and renal disease on arterial stiffness: clinical applications. Am J Hypertens2002; 15: 1101-1108.
12. Davies JI, Struthers AD. Pulse wave analysis and pulse wave velocity: a critical review of their strengths and weaknesses.J Hypertens2003; 21: 463-472, doi: 10.1097/ 00004872-200303000-00004.
13. Satoh H, Saijo Y, Kishi R, Tsutsui H. Brachial-ankle pulse wave velocity is an independent predictor of incident hypertension in Japanese normotensive male subjects. Environ Health Prev Med2011; 16: 217-223, doi: 10.1007/ s12199-010-0189-3.
14. Yamashina A, Tomiyama H, Takeda K, Tsuda H, Arai T, Hirose K, et al. Validity, reproducibility, and clinical significance of noninvasive brachial-ankle pulse wave velocity measurement. Hypertens Res2002; 25: 359-364, doi: 10.1291/hypres.25.359.
15. Munakata M, Nunokawa T, Yoshinaga K, Toyota T. Brachial-ankle pulse wave velocity is an independent risk factor for microalbuminuria in patients with essential hypertension - a Japanese trial on the prognostic implication of pulse wave velocity (J-TOPP).Hypertens Res2006; 29: 515-521, doi: 10.1291/hypres.29.515.
16. Kitahara T, Ono K, Tsuchida A, Kawai H, Shinohara M, Ishii Y, et al. Impact of brachial-ankle pulse wave velocity and ankle-brachial blood pressure index on mortality in hemo-dialysis patients.Am J Kidney Dis2005; 46: 688-696. 17. Tomiyama H, Koji Y, Yambe M, Shiina K, Motobe K,
Yamada J, et al. Brachial-ankle pulse wave velocity is a simple and independent predictor of prognosis in patients with acute coronary syndrome.Circ J2005; 69: 815-822. 18. Zhao Q, Hixson JE, Rao DC, Gu D, Jaquish CE, Rice T,
et al. Genetic variants in the apelin system and blood pressure responses to dietary sodium interventions: a family-based association study. J Hypertens 2010; 28: 756-763, doi: 10.1097/HJH.0b013e3283370d32.
19. Fang Y, Mu JJ, He LC, Wang SC, Liu ZQ. Salt loading on plasma asymmetrical dimethylarginine and the protective role of potassium supplement in normotensive salt-sensitive asians. Hypertension 2006; 48: 724-729, doi: 10.1161/ 01.HYP.0000238159.19614.ce.
20. Wright JT Jr, Rahman M, Scarpa A, Fatholahi M, Griffin V, Jean-Baptiste R, et al. Determinants of salt sensitivity in black and white normotensive and hypertensive women. Hypertension 2003; 42: 1087-1092, doi: 10.1161/01.HYP. 0000101687.89160.19.
21. Sonoda H, Takase H, Dohi Y, Kimura G. Factors associated with brachial-ankle pulse wave velocity in the general population. J Hum Hypertens 2012; 26: 701-705, doi: 10.1038/jhh.2011.100.
22. Todd AS, Macginley RJ, Schollum JB, Johnson RJ, Williams SM, Sutherland WH, et al. Dietary salt loading impairs arterial vascular reactivity.Am J Clin Nutr2010; 91: 557-564. 23. Todd AS, Macginley RJ, Schollum JB, Williams SM,
Sutherland WH, Mann JI, et al. Dietary sodium loading in normotensive healthy volunteers does not increase arterial vascular reactivity or blood pressure.Nephrology2012; 17: 249-256, doi: 10.1111/j.1440-1797.2011.01550.x.
24. Liu Z, Peng J, Lu F, Zhao Y, Wang S, Sun S, et al. Salt loading and potassium supplementation: effects on ambu-latory arterial stiffness index and endothelin-1 levels in normotensive and mild hypertensive patients. J Clin Hypertens2013; 15: 485-496, doi: 10.1111/jch.12109. 25. Kips JG, Vermeersch SJ, Reymond P, Boutouyrie P,
Stergiopulos N, Laurent S, et al. Ambulatory arterial stiffness index does not accurately assess arterial stiffness. J Hypertens 2012; 30: 574-580, doi: 10.1097/HJH. 0b013e32834fca18.
26. Dechering DG, Adiyaman A, van der Steen M, Thien T. Interstudy variability in the ambulatory arterial stiffness index.Hypertension2007; 50: e65, doi: 10.1161/HYPERTE NSIONAHA.107.096065.
27. Mu JJ, Liu ZQ, Liu WM, Liang YM, Yang DY, Zhu DJ, et al. Reduction of blood pressure with calcium and potassium supplementation in children with salt sensitivity: a 2-year double-blinded placebo-controlled trial. J Hum Hypertens 2005; 19: 479-483, doi: 10.1038/sj.jhh.1001854.
28. Morris RC Jr, Sebastian A, Forman A, Tanaka M, Schmidlin O. Normotensive salt sensitivity: effects of race and dietary potassium.Hypertension1999; 33: 18-23, doi: 10.1161/01. HYP.33.1.18.
29. Garcia-Ortiz L, Recio-Rodriguez JI, Rodriguez-Sanchez E, Patino-Alonso MC, Agudo-Conde C, Rodriguez-Martin C, et al. Sodium and potassium intake present a J-shaped relationship with arterial stiffness and carotid intima-media thickness. Atherosclerosis 2012; 225: 497-503, doi: 10. 1016/j.atherosclerosis.2012.09.038.
30. Berry SE, Mulla UZ, Chowienczyk PJ, Sanders TA. Increased potassium intake from fruit and vegetables or supplements does not lower blood pressure or improve vascular function in UK men and women with early hypertension: a randomised controlled trial. Br J Nutr 2010; 104: 1839-1847.
31. Choi SY, Oh BH, Bae PJ, Choi DJ, Rhee MY, Park S. Age-associated increase in arterial stiffness measured according to the cardio-ankle vascular index without blood pressure changes in healthy adults.J Atheroscler Thromb2013; 20: 911-923, doi: 10.5551/jat.18267.
32. Liu F, Mu J, Yuan Z, Lian Q, Zheng S, Wu G, et al. Involvement of the lymphatic system in salt-sensitive hyper-tension in humans.Med Sci Monit2011; 17: CR542-CR546. 33. Sharma AM, Ruland K, Spies KP, Distler A. Salt sensitivity in young normotensive subjects is associated with a hyperinsulinemic response to oral glucose. J Hypertens 1991; 9: 329-335, doi: 10.1097/00004872-199104000-00004.
et al. Insulin promotes vascular smooth muscle cell proliferation via microRNA-208-mediated downregulation of p21. J Hypertens 2011; 29: 1560-1568, doi: 10.1097/ HJH.0b013e328348ef8e.
35. Larrousse M, Bragulat E, Segarra M, Sierra C, Coca A, de La Sierra A. Increased levels of atherosclerosis markers in salt-sensitive hypertension.Am J Hypertens2006; 19: 87-93.