ISSN 0100-879X
CLINICAL INVESTIGATION
www.bjournal.com.br
www.bjournal.com.br
Volume 42 (8) 692-775 August 2009
Institutional Sponsors
The Brazilian Journal of Medical and Biological Research is partially financed by
Braz J Med Biol Res, August 2009, Volume 42(8) 738-743
Salt and insulin sensitivity after short and prolonged high salt
intake in elderly subjects
Salt and insulin sensitivity after short and
prolonged high salt intake in elderly subjects
N.K.C. Lima, D.J.O. Tozetto, L.G. Lima, F. Nobre, J.C. Moriguti,
E. Ferriolli and M.C. Foss
Departamento de Clínica Médica, Faculdade de Medicina de Ribeirão Preto, Universidade de São Paulo, Ribeirão Preto, SP, Brasil
Abstract
Salt sensitivity and insulin resistance are correlated with higher cardiovascular risk. There is no information about changes in salt sensitivity (SS) and insulin sensitivity (IS) after a chronic salt overload in humans.The aim of this study was to evaluate these parameters in the elderly. Seventeen volunteers aged 70.5 ± 5.9 years followed a low-salt diet (LSD) for 1 week and a high-salt diet (HSD) for 13 weeks. We evaluated SS after one week (HSD1) and after 13 weeks (HSD13), and subjects’ IS and lipids on their usual diet (UD) at HSD1, and at HSD13. Blood pressure (BP) was measured at each visit and ambulatory blood pressure monitoring (ABPM) was performed twice. SS was the same at HSD1 and HSD13. Systolic BP was lower on LSD than on UD (P = 0.01), HSD1 (P < 0.01) and HSD13 (P < 0.01). When systolic and diastolic BP were evaluated by ABPM, they were higher at HSD13 during the 24-h period (P = 0.03 and P < 0.01) and during the wakefulness period (P = 0.02 and P < 0.01) compared to the UD. Total cholesterol was higher (P = 0.04) at HSD13 than at HSD1. Glucose and homeostasis model assessment (HOMA) were lower at HSD1 (P = 0.02 and P = 0.01) than at HSD13. Concluding, the extension of HSD did not change the SS in an elderly group. The higher IS found at HSD1 did not persist after a longer HSD. A chronic HSD increased BP as assessed by ABPM.
Key words: Salt sensitivity; Insulin sensitivity; Elderly; Ambulatory blood pressure monitoring; Blood pressure
Introduction
Correspondence: N.K.C. Lima, Departamento de Clínica Médica, Hospital das Clínicas, FMRP, USP, Av. Bandeirantes, 3900, 14048-900 Ribeirão Preto, SP, Brasil. Fax: +55-16-3633-6695. E-mail: [email protected]
Research supported byFAEPA, Hospital das Clínicas, Faculdade de Medicina de Ribeirão Preto, Universidade de São Paulo.
Received November 28, 2008. Accepted May 13, 2009.
ranges from 9 (9) to 70 mEq (10) of sodium per day, and salt overload from 150 (11) to 345 mEq (10). There are also
different classifications of salt sensitivity. Some investiga -tors consider it necessary to have a mean BP increase of 5% (12), others of 10% (13) from LSD to HSD to clas-sify someone as being salt sensitive. Other investigators prefer to consider absolute values, for example, a mean BP increase of 3 mmHg between diets (14). Finally, some investigators classify salt sensitivity in steps, ranging from the lowest to the highest (15).
In addition to all of these differences among protocols, one important question remains unanswered: is one week of
salt overload sufficient to evaluate the salt effect? If a longer
period of salt overload was provided, would the individual’s
classification or the test result be changed?
Salt intake is clearly associated with high blood pressure (BP) in epidemiologic studies (1,2). However, individuals are not homogeneous in their BP response to high salt intake. Salt overload increases (salt-sensitive individuals), maintains or sometimes even decreases BP (salt-resistant individuals) (3). It is known that salt sensitivity is correlated with higher cardiovascular risk (4,5) and that it is more prevalent with increasing age (6,7).
Salt and insulin sensitivity in the elderly 739
HSD can change the metabolic status of animals and humans. Some previous studies have shown increased insulin sensitivity when salt overload is performed. Chronic HSD has been associated with higher insulin sensitivity in young (16,17) and old Wistar rats (18). One week of salt overload in healthy humans was also associated with higher insulin sensitivity when compared to salt restriction (19). On the other hand, studies on animals and humans have found lower insulin sensitivity during the use of HSD (20,21).
These conflicting results can be attributed to differences in
protocols and to associated diseases.
To the best of our knowledge, no previous study has evaluated the metabolic effect of prolonged salt overload in elderly humans.
Therefore, the aims of this study were to compare salt sensitivity measured after 1 week (the standard method) and after a prolonged salt overload in elderly people, and to evaluate the insulin sensitivity and lipid levels of these subjects on their usual diet and after 1 and 13 weeks of salt overload.
Subjects and Methods
The study was performed in accordance with the Dec-laration of Helsinki (1989) and was approved by the Ethics Committee of the Hospital das Clínicas, Faculdade de Me-dicina de Ribeirão Preto, Universidade de São Paulo, Brazil. Written informed consent was obtained from all subjects. Twenty elderly individuals (60 years or older) with no previ-ous use of anti-hypertensive or anti-diabetic drugs, selected from the Geriatric Service of the Hospital das Clínicas, Faculdade de Medicina de Ribeirão Preto, Universidade de São Paulo, Brazil, were evaluated. Exclusion criteria were: mean blood pressure higher than 160 (systolic) and 100 mmHg (diastolic), evidence of secondary hypertension, the diagnosis of cancer or other states of disability, use of drugs that potentially increase BP (non-steroidal and
steroidal anti-inflammatory drugs, tricyclic antidepressants,
vasoconstrictor drugs, etc.) and intake of more than 105 g of alcohol per week. Other medications in regular use were maintained until the end of the study. During the protocol, 3 patients dropped out of the study because of epigastric pain with the intake of the salt capsules. The symptoms stopped immediately after interruption. Seventeen patients concluded the protocol. The volunteers were aged 70.5 ± 5.9 years, 10 women, white, 4 with untreated hypertension (3 of them with white coat hypertension), 10 with high-normal BP and 3 normotensives.
Mean basal BP was obtained with an automatic device (Dixtal 2710, Brazil) in the Clinician’s office. Three measure
-ments were obtained at the first visit (Visit 1) and three after
1 week (Visit 2). The diagnosis of hypertension (systolic BP
of 140 mmHg or higher and/or diastolic BP of 90 mmHg or higher) and high-normal BP (systolic BP of 120 mmHg or higher and/or diastolic BP of 80 mmHg or higher) was made on the basis of the mean of these six measurements with the subjects on their usual diet. Body weight was measured at
the first visit. A blood sample was drawn for the determina -tion of fasting blood glucose (Glicose HK Liquiform, Labtest, Brazil), HDL-cholesterol (HDL Cholesterol monophase AA plus, Wiener Lab., Argentina), total cholesterol (Colestat, Wiener Lab.), triglycerides (TG Color GPO/PAP AA, Wiener Lab.), and serum insulin (Coat-A-Count Insulin, Siemens, USA). Three 24-h urine specimens were collected for the
determination of urinary sodium excretion (UNaV).
Twenty-four-hour ambulatory blood pressure monitoring (ABPM) was performed on the non-dominant limb (Spacelabs-90207, USA) (22). The device was programmed to take measure-ments every 15 min from 7:00 am to 11:00 pm (awake period), and every 20 min from 11:00 pm to 7:00 am (asleep period). Recordings were accepted only if at least 80% of the readings could be successfully obtained. Data from the monitors were downloaded into a computer and rejected if systolic BP was lower than 80 mmHg or higher than 250 mmHg and if diastolic BP was lower than 40 mmHg or higher than 140 mmHg.
After Visit 2, LSD was started. Patients were instructed
to use no salt for cooking and to add no salt to cooked or raw food. They were also asked to avoid industrialized food. During this period, volunteers received capsules of placebo to be taken three times a day, two capsules at each time, after breakfast, lunch and dinner. A 24-h urine specimen was collected on the 7th day and volunteers returned to
the office to have their BP measured (six measurements at each visit, from Visit 3) and to be weighed. A volunteer was considered to have followed the LSD when the UNaV dropped at least 100 mmol from usual diet UNaV or became
lower than 100 mmol/day. Fifteen volunteers reached that goal and only their results were considered to evaluate salt sensitivity at this point in the study. At that time, the volun-teers were asked to continue preparing the diet as before but now with 6 g of salt added per day (two packages of 3 g each) and to take 6 capsules of 1 g of salt each following the same regimen employed with the placebo (total increase of 200 mmol sodium/day).
One week later, 24-h urine was collected, a second blood sample was drawn (biochemistry was repeated), and
BP and body weight were determined (Visit 4).
High salt intake was maintained until the end of the study. Twenty-four-hour urine was collected every 14 days
capsules was counted so that the researcher could also check compliance by counting the capsules. At the last visit, after 13 weeks of salt overload, a second ABPM was performed, body weight was measured and a third blood sample was drawn for biochemical tests.
If systolic BP increased at least 10 mmHg from LSD to HSD, patients were considered to be salt sensitive.
The homeostasis model assessment (HOMA) was deter-mined by the following formula: insulin resistance = plasma insulin (pmol/L) x blood glucose (mmol/L) / 135 (23).
Statistical analysis
The results obtained with the patients on their usual diet, LSD, after 1 week of HSD (HSD1), and after 13 weeks of
HSD (HSD13) were compared with a unified approach to
mixed linear models (24,25) (SAS/STAT®, Version 9, USA: SAS Institute Inc., 2002-2003). The mean BPs obtained by ABPM during the basal period and after 13 weeks of HSD were compared by the Student paired test. The McNemar test was used to compare salt sensitivity after 1 week and after 13 weeks of salt overload (26). Results are reported as means ± SD.
Results
The usual UNaV was 215.24 ± 133.08 mmol/day (N = 17). After 1 week of LSD, UNaV was 70.03 ± 57.97 mmol/
day (N = 15; P < 0.01, LSD vs usual, HSD1 and HSD13).
After 1 week of salt overload, UNaV was 297.75 ± 112.75
mmol/day (N = 17; P = 0.01 vs usual), and these levels were maintained up to the 13th week (294.71 ± 104.83 mmol/ day, N = 17; P = 0.01 vs usual).
Ten of 15 subjects were classified as salt sensitive after
1 week and 13 weeks of salt overload. Three volunteers
classified as salt resistant after 1 week of salt overload were classified as salt sensitive after 13 weeks and three volunteers initially classified as salt sensitive were classified
as salt resistant after 13 weeks. The group salt sensitivity was the same after one or 13 weeks of salt overload (P > 0.05).
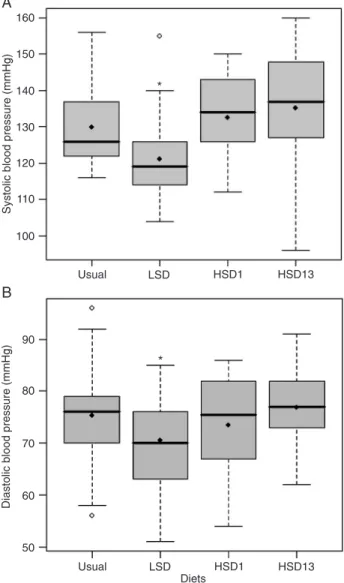
Systolic BP was lower on LSD than on the usual diet (P = 0.01), HSD1 (P < 0.01) and HSD13 (P < 0.01; Figure 1A). There was no difference (P = 0.13) between usual diet systolic BP and HSD13 BP. However, when systolic BP was evaluated by ABPM, it was higher after 13 weeks of salt overload during the 24-h period (P = 0.03) and during the awake period only (P = 0.02) compared with the usual diet (Table 1).
Diastolic BP was lower on LSD than on the usual diet (P = 0.03) and HSD13 (P = 0.01; Figure 1B). There was no difference (P = 0.51) between usual diet diastolic BP
and HSD13, though diastolic BP assessed by ABPM was higher during the 24-h period (P < 0.01) and during the awake period (P < 0.01) after chronic overload than on the usual diet (Table 1).
Body weight did not differ among usual diet (66 ± 15
Figure 1. Systolic (A) and diastolic (B) blood pressures of sub-jects on different salt diets. Box plots indicating the median (thick
line), the mean (filled lozenges), and range of blood pressure of
subjects on their usual diet (215.24 ± 133.08 mmol sodium/day), on a low-salt diet (LSD, 70.03 ± 57.97 mmol sodium/day), and after 1 week (HSD1, 297.75 ± 112.75 mmol sodium/day) and 13 weeks (HSD13, 294.71 ± 104.83 mmol sodium/day) on a high-salt diet. The boundaries of the box indicate the lower and upper quartiles. Open lozenges: Outliers with values between 1.5 and 3 box lengths from the boundaries of the box. A: *P = 0.01 vs
Salt and insulin sensitivity in the elderly 741
kg), LSD (65 ± 17 kg), HSD1 (67 ± 17 kg), and HSD13 (67 ± 15 kg; P > 0.05).
Total cholesterol was higher (P = 0.04) at HSD13 than at HSD1. HDL-cholesterol and triglycerides were similar on all diets (Table 2).
Glucose and HOMA were lower (P = 0.02 and P = 0.01, respectively) at HSD1 than at HSD13 (Table 2). There was no difference in insulin sensitivity (P = 0.3) between usual diet and HSD13.
Discussion
It is known that changes in salt intake can modify BP
in animals (18,27) and humans (28). Recently, Elliott et al. (29)reported a three-year study with chimpanzees in
which BP fell significantly after a sodium intake reduction of
100 mmol/day. Kojuri and Rahimi (30) showed that even a modest reduction of sodium intake (37 mmol/day) reduced the ABPM of untreated hypertensive patients. The present
study also found lower Clinician’s office BP in volunteers
on LSD than on their usual or high-salt diet. Using ABPM, which has prognostic superiority over conventional BP measurements (31), higher 24-h BP and BP during the wakefulness period were detected after a long period of high salt intake compared with the usual diet. The mean difference between urinary sodium on the usual diet and after 13 weeks on HSD was about 80 mmol per day. To the
best of our knowledge, this is the first time that a prolonged
HSD was administered to humans.
Because the study population was elderly, we decided to employ systolic BP to evaluate salt sensitivity, since mean BP, more frequently used in salt-sensitivity studies, is
influenced by the lower diastolic BP in elderly patients, as -sociated with their increased arterial stiffness (32). Patients had substantial salt sensitivity, with a mean increase of 14 ± 7 mmHg from LSD to HSD1, similar to the results reported by Sowers et al. (33) who reported a systolic BP increase of 12 ± 0.3 mmHg in African-American patients.
In order to evaluate salt sensitivity it would be ideal to have achieved a lower salt consumption during the LSD week, since some individuals had mean urinary sodium excretion of about 100 mmol/day, which could be considered as a normal salt diet. On the other hand, there was a great difference between salt consumption during the LSD and the HSD in this study.
The analysis of a longer period of HSD intake did not affect the overall result of the salt-sensitivity test, although,
individually, a few cases would be classified differently after
a longer period on the HSD.
The HOMA method was chosen to evaluate insulin sensitivity in this study because it is simple, easily applied, and has good reproducibility (34). The HOMA estimate of
insulin sensitivity significantly correlates with data derived
from forearm metabolic studies involving direct measure-ments of insulin action on muscle glucose metabolism (35).
The finding of higher insulin sensitivity after 1 week of HSD
than after 13 weeks, with no changes in body weight, ap-pears to indicate that the positive effect of salt on insulin sensitivity is transitory, at least in the elderly volunteers studied. After 13 weeks of salt overload, insulin sensitivity was the same as that determined at the beginning of the study, when the subjects were on their usual diet. Prob-ably, different species have distinct characteristics, since Okamoto et al. (36), studying Wistar rats after 9 weeks of
Table 2. Comparison of metabolic factors for subjects on differ-ent diets.
Usual diet High-salt diet for 1 week
High-salt diet for 13 weeks
T-Chol (mmol/L) 5.4 ± 0.8 5.3 ± 1.0 5.6 ± 0.8* HDL (mmol/L) 1.5 ± 0.4 1.4 ± 0.4 1.5 ± 0.4 Triglycerides (mmol/L) 1.3 ± 0.6 1.3 ± 0.6 1.4 ± 0.6 Glucose (mmol/L) 5.4 ± 0.8 5.1 ± 0.4 5.6 ± 0.9* Insulin (pmol/L) 69.5 ± 41.7 55.6 ± 34.7 62.5 ± 34.7 HOMA (pmol/L·mmol/L) 2.72 ± 1.73 1.87 ± 1.27 3.06 ± 1.89*
Data are reported as means ± SD for N = 17 subjects. T-Chol = total cholesterol; HDL = high-density lipoprotein; HOMA = ho-meostasis model assessment. Usual diet: 215.24 ± 133.08 mmol sodium/day; high-salt diet: 297.75 ± 112.75 mmol sodium/day (after 1 week) and 294.71 ± 104.83 mmol sodium/day (after 13 weeks). *P < 0.05 compared to high-salt diet for 1 week (mixed linear models).
Table 1. Ambulatory 24-h blood pressure monitoring during the awake and asleep periods of elderly subjects on their usual diet and after a long-term (13 weeks) high-salt diet.
Period Usual diet High-salt diet
24-h
Systolic 120 ± 12 127 ± 11* Diastolic 70 ± 8 74 ± 7* Awake
Systolic 121 ± 13 128 ± 11* Diastolic 71 ± 8 75 ± 7* Asleep
Systolic 116 ± 12 123 ± 12 Diastolic 65 ± 10 70 ± 9
a normal-salt diet (0.5% sodium), of LSD (0.06% sodium) or HSD (3.12% sodium), found that insulin sensitivity was higher in rats on HSD than on a normal-salt diet, with higher insulin-regulated glucose transporter (GLUT4) expression, enhanced insulin signaling, and GLUT4 translocation.
Severe salt restriction (20 to 60 mmol sodium/day) has been associated with higher cholesterol levels (37,38); however, moderate salt restriction of 85 mmol sodium/ day does not modify lipid concentration (37). The present study showed a modest increase of cholesterol levels after prolonged high salt intake. A salt-rich diet for 4 or 5 weeks also increased cholesterol levels in lean and obese Zucker rats (39) but the mechanism responsible for this effect has not been elucidated.
As the extension of salt overload period after one week of low-salt diet did not change the salt sensitivity in this group, we can determine it using the traditional shorter method. Since there was no higher insulin sensitivity after
a prolonged salt overload, which was previously shown in animal models, and higher BP and cholesterol levels were detected, the results point to a potential harmful effect of an increase in sodium intake, even though the usual diet
already had a high salt content. The findings of the pres -ent study may not be applicable to young or middle-aged individuals, since these groups were not submitted to pro-longed high-salt diet before and the numerous differences between groups, with higher salt sensitivity and lower insulin sensitivity being characteristic of the elderly.
Acknowledgments
The authors are indebted to Roberto Molina de Souza and Professor Edson Zangiacomi Martinez, Centro de Mé-todos Quantitativos (CEMEQ), Faculdade de Medicina de Ribeirão Preto, Universidade de São Paulo, for assistance with the statistical analysis.
References
1. Intersalt: an international study of electrolyte excretion and blood pressure. Results for 24 hour urinary sodium and potassium excretion. Intersalt Cooperative Research Group.
BMJ 1988; 297: 319-328.
2. Elliott P, Stamler J, Nichols R, Dyer AR, Stamler R, Kesteloot H, et al. Intersalt revisited: further analyses of 24 hour so-Intersalt revisited: further analyses of 24 hour so-dium excretion and blood pressure within and across popu-lations. Intersalt Cooperative Research Group. BMJ 1996; 312: 1249-1253.
3. Luft FC, Weinberger MH. Heterogeneous responses to changes in dietary salt intake: the salt-sensitivity paradigm.
Am J Clin Nutr 1997; 65: 612S-617S.
4. Heimann JC, Drumond S, Alves AT, Barbato AJ,
Dichtchek-enian V, Marcondes M. Left ventricular hypertrophy is more
marked in salt-sensitive than in salt-resistant hypertensive patients. J Cardiovasc Pharmacol 1991; 17 (Suppl 2): S122-S124.
5. Barba G, Galletti F, Cappuccio FP, Siani A, Venezia A, Ver -siero M, et al. Incidence of hypertension in individuals with different blood pressure salt-sensitivity: results of a 15-year follow-up study. J Hypertens 2007; 25: 1465-1471.
6. Dengel DR, Hogikyan RV, Brown MD, Glickman SG, Supia -no MA. Insulin sensitivity is associated with blood pressure response to sodium in older hypertensives. Am J Physiol
1998; 274: E403-E409.
7. Weinberger MH, Fineberg NS. Sodium and volume sensitiv-ity of blood pressure. Age and pressure change over time.
Hypertension 1991; 18: 67-71.
8. de la Sierra A, Giner V, Bragulat E, Coca A. Lack of cor -relation between two methods for the assessment of salt sensitivity in essential hypertension. J Hum Hypertens 2002; 16: 255-260.
9. Kawasaki T, Delea CS, Bartter FC, Smith H. The effect of high-sodium and low-sodium intakes on blood pressure and other related variables in human subjects with idiopathic hypertension. Am J Med 1978; 64: 193-198.
10. Takeshita A, Imaizumi T, Ashihara T, Nakamura M. Char-acteristics of responses to salt loading and deprivation in hypertensive subjects. Circ Res 1982; 51: 457-464. 11. Dustan HP, Kirk KA. Relationship of sodium balance to
arte-rial pressure in black hypertensive patients. Am J Med Sci
1988; 295: 378-383.
12. Sullivan JM, Ratts TE, Taylor JC, Kraus DH, Barton BR, Patrick DR, et al. Hemodynamic effects of dietary sodium in man: a preliminary report. Hypertension 1980; 2: 506-514. 13. Zavaroni I, Coruzzi P, Bonini L, Mossini GL, Musiari L,
Gasparini P, et al. Association between salt sensitivity and insulin concentrations in patients with hypertension. Am J Hypertens 1995; 8: 855-858.
14. Sharma AM, Schattenfroh S, Kribben A, Distler A. Reliabil-ity of salt-sensitivReliabil-ity testing in normotensive subjects. Klin Wochenschr 1989; 67: 632-634.
15. Santello JL, Dichtchekenian V, Heimann JC. Effect of
long-term blood pressure control on salt sensitivity. J Med 1997; 28: 147-158.
16. Prada P, Okamoto MM, Furukawa LN, Machado UF, Hei-mann JC, Dolnikoff MS. High- or low-salt diet from weaning to adulthood: effect on insulin sensitivity in Wistar rats.
Hypertension 2000; 35: 424-429.
17. Ruivo GF, Leandro SM, do Nascimento CA, Catanozi S, Ro-cha JC, Furukawa LN, et al. Insulin resistance due to chronic salt restriction is corrected by alpha and beta blockade and by L-arginine. Physiol Behav 2006; 88: 364-370.
18. Lima NK, Lima FB, dos Santos EA, Okamoto MM, Sumida DH, Hell NS, et al. Effect of lifelong high- or low-salt intake on blood pressure, left ventricular mass and plasma insulin in Wistar rats. Am J Med Sci 2006; 331: 309-314.
19. Townsend RR, Kapoor S, McFadden CB. Salt intake and in-sulin sensitivity in healthy human volunteers. Clin Sci 2007; 113: 141-148.
Salt and insulin sensitivity in the elderly 743
2003; 73: 509-523.
21. Donovan DS, Solomon CG, Seely EW, Williams GH, Simon-son DC. Effect of sodium intake on insulin sensitivity. Am J Physiol 1993; 264: E730-E734.
22. Iqbal P, Fotherby MD, Potter JF. Validation of the SpaceLabs
90207 automatic non-invasive blood pressure monitor in elderly subjects. Blood Press Monit 1996; 1: 367-373. 23. Stumvoll M, Mitrakou A, Pimenta W, Jenssen T, Yki-Jarvinen
H, Van Haeften T, et al. Use of the oral glucose tolerance
test to assess insulin release and insulin sensitivity. Diabetes Care 2000; 23: 295-301.
24. Mclean RA, Sanders WL, Stroup WW. A unified approach to
mixed linear models. Am Stat 1991; 45: 54-64.
25. Littel RC, Milliken GA, Stroup WW, Wolfinger RD. SAS system for mixed models. Cary: SAS Institute Inc.; 1996. 26. Siegel S, Castellan NJ. Nonparametric statistics for the
be-havioral sciences. 2nd edn. New York: McGraw-Hill College; 1998.
27. da Costa Lima NK, Lima FB, dos Santos EA, Okamoto MM, Matsushita DH, Hell NS, et al. Chronic salt overload increases blood pressure and improves glucose metabolism without changing insulin sensitivity. Am J Hypertens 1997; 10: 720-727.
28. Fuchs FD, Wannmacher CM, Wannmacher L, Guimaraes FS, Rosito GA, Gastaldo G, et al. Effect of sodium intake on blood pressure, serum levels and renal excretion of sodium and potassium in normotensives with and without familial predisposition to hypertension. Braz J Med Biol Res 1987; 20: 25-34.
29. Elliott P, Walker LL, Little MP, Blair-West JR, Shade RE, Lee DR, et al. Change in salt intake affects blood pressure of chimpanzees: implications for human populations. Circula-tion 2007; 116: 1563-1568.
30. Kojuri J, Rahimi R. Effect of “no added salt diet” on blood pressure control and 24 hour urinary sodium excretion in mild to moderate hypertension. BMC Cardiovasc Disord
2007; 7: 34.
31. Hansen TW, Kikuya M, Thijs L, Bjorklund-Bodegard K,
Kuz-netsova T, Ohkubo T, et al. Prognostic superiority of daytime ambulatory over conventional blood pressure in four popu-lations: a meta-analysis of 7,030 individuals. J Hypertens
2007; 25: 1554-1564.
32. Franklin SS. Hypertension in older people: part 1. J Clin Hypertens 2006; 8: 444-449.
33. Sowers JR, Zemel MB, Zemel P, Beck FW, Walsh MF, Zawada ET. Salt sensitivity in blacks. Salt intake and natri-uretic substances. Hypertension 1988; 12: 485-490.
34. Sarafidis PA, Lasaridis AN, Nilsson PM, Pikilidou MI, Stafilas PC, Kanaki A, et al. Validity and reproducibility of HOMA-IR,
1/HOMA-IR, QUICKI and McAuley’s indices in patients with hypertension and type II diabetes. J Hum Hypertens 2007; 21: 709-716.
35. Foss-Freitas MC, Foss MC. Comparison of the homeostasis model assessment and quantitative insulin sensitivity check index with data from forearm metabolic studies for the in vivo
assessment of insulin sensitivity. Braz J Med Biol Res 2004; 37: 663-668.
36. Okamoto MM, Sumida DH, Carvalho CR, Vargas AM,
Heimann JC, Schaan BD, et al. Changes in dietary sodium consumption modulate GLUT4 gene expression and early steps of insulin signaling. Am J Physiol Regul Integr Comp Physiol 2004; 286: R779-R785.
37. Ruppert M, Overlack A, Kolloch R, Kraft K, Lennarz M, Stumpe KO. Effects of severe and moderate salt restriction on serum lipids in nonobese normotensive adults. Am J Med Sci 1994; 307 (Suppl 1): S87-S90.
38. Nakandakare ER, Charf AM, Santos FC, Nunes VS, Ortega
K, Lottenberg AM, et al. Dietary salt restriction increases
plasma lipoprotein and inflammatory marker concentrations
in hypertensive patients. Atherosclerosis 2008; 200: 410-416.