Wheat seedling emergence estimated from seed analysis
Alexandra Augusti Boligon
1; Alessandro Dal’Col Lúcio
2*; Sidinei José Lopes
2; Alberto Cargnelutti
Filho
2; Danton Camacho Garcia
21
UNIPAMPA – Campus São Gabriel, Av. Antonio Trilha, 1847 – 97300-000 – São Gabriel, RS – Brasil. 2
UFSM/CCR – Depto. de Fitotecnia, Av. Roraima, 1000 – 97105-900 – Santa Maria, RS – Brasil. *Corresponding author <[email protected]>
ABSTRACT: There are various vigor tests for the evaluation of seeds physiological quality, however, few studies correlate this tests with plants emergency. This study aimed at identifying wheat (Triticum aestivum L.) seed analysis variables that best predict seedling emergence. Wheat seeds (CEP 30 cultivar) were divided into two batches, one initially subjected to the accelerated ageing process and forming the low-quality batch, and the other, without application of the accelerated ageing process, to compose a high-quality batch. The following seed test variables were evaluated: (i) percentage of normal seedlings in the germination tests, (ii) initial germination counting, (iii) accelerated ageing, (iv) cold test without soil, (v) germination speed index, and (vi) emergence of seedlings in sand after seven and 15 days. The following seedling characteristics were evaluated: root and shoot lengths, total length, and dry mass of the root and shoot. The characteristics evaluated for the seedlings were subjected to path analysis and the seed tests variables to stepwise multiple regression analysis, taking seedling emergence at seven days as the response variable. Factor analysis was also carried out on all variables. Dry mass of the shoot and root length presented the best correlation with seedling emergence for the high-quality batch, but this behavior was not observed for any variable in the low-quality batch. Accelerated ageing was the best seedling emergence estimator for both batches of the used cultivar.
Key words: stepwise multiple regression analysis, path analysis, factor analysis, seed quality
Emergência de plântulas de trigo estimadas a partir da análise de sementes
RESUMO: Existem inúmeros testes de vigor que podem ser utilizados na avaliação da qualidade fisiológica das sementes, porém, são poucos os estudos que relacionam estes testes com a emergência de plântulas das culturas. Identificaram-se variáveis da análise de sementes de trigo (Triticum aestivum L.) que mais bem predizem a emergência de plântulas dessa cultura. Um lote de sementes de trigo do cultivar CEP 30 foi dividido em dois sublotes, sendo um submetido preliminarmente ao processo de envelhecimento acelerado, compondo o sublote de baixa qualidade, e outro, sem aplicação do processo de envelhecimento acelerado, compondo o sublote de alta qualidade. Foram realizados os testes de sementes: (i) percentagem de plântulas normais nos testes de germinação, (ii) primeira contagem de germinação, (iii) envelhecimento acelerado, (iv) teste de frio sem solo, (v) índice de velocidade de germinação, e (vi) emergência de plântulas em areia aos sete e aos 15 dias. As características das plântulas foram os comprimentos de raiz, de parte aérea e total e as massas secas de raiz e de parte aérea. As características das plântulas foram submetidas à análise de trilha e as variáveis dos testes de sementes, à análise de regressão múltipla stepwise, com a emergência de plântulas aos sete dias como variável resposta. Foi realizada também a análise de fatores com todas as variáveis avaliadas. A massa seca de parte aérea e o comprimento de raiz apresentaram as melhores relações com a emergência de plântulas, para o sublote de alta qualidade, não sendo observado esse comportamento para nenhuma variável no sublote de baixa qualidade. O envelhecimento acelerado foi o melhor estimador da emergência de plântulas, para ambos os sublotes utilizados.
Palavras-chave: análise de regressão múltipla stepwise, análise de trilha, análise de fatores, qualidade de sementes
Introduction
Good quality seeds are a fundamental requirement for production purposes, including the wheat (Triticum aestivum
L.). Quality is defined as a set of genetic, physical, physiologi-cal and health-related attributes that influence the capacity of a seed batch to produce a uniform crop consisting of vigor-ous plants, representative of the cultivar, and free of inva-sive or undesirable plants (Popinigis, 1985). The physiological quality of the seeds, for commercial purposes, is determined by germination testing, as described by Amaral and Peske (2000). Although this type of testing is widely used, their results do not normally predict the emergence potential and
the behavior of seedlings in the field, where conditions are almost always unfavorable (Barros et al., 2002). Some fac-tors inherent to the conditions of the actual test, such as the quality and moisture of the substrate and the tempera-ture, can cause undesirable variations. Thus, it is necessary to evaluate seed vigor by means of other tests than the ger-mination test, which can estimate seed performance when sown in the field, where they are exposed to various adverse factors.
related to the time required and easiness with which these tests can be run, the material required and training of tech-nicians. It is not therefore practical to run all the tests to de-termine the quality of seed batches, and those that correlate more closely to seedling emergence must be selected.
There are statistical techniques that can be used to evalu-ate the relationship between the laboratorial tests and seed-ling emergence in the field. These particularly include path analysis, multiple regression and factor analysis. Path analy-sis enables the researcher to understand the causes involved in the way that variables relate among themselves and to break down the existing correlation into direct and indirect effects, whereas multiple regression provides a way of select-ing the variables based on an initial set of explanatory vari-ables (Kurek et al., 2001). Conversely, factor analysis is aimed at structuring and simplifying the original data, representing a large number of variables by a smaller number, expressed in linear combinations of the original data (Cruz and Carneiro, 2003). Using these techniques, it is possible to se-lect the vigor test or tests most appropriate for each crop. This procedure results in greater confidence in seed analysis, in addition to speeding up the production of results and minimizing the cost/benefit ratio in terms of labor and ma-terials used in the laboratory. Thus, this study aimed at iden-tifying the seed analysis tests and wheat seedling characteris-tics with the closest correlation to crop seedling emergence.
Material and Methods
This study was carried out in a greenhouse in Santa Maria, state of Rio Grande do Sul, Brazil (29º45’ S; 53º42’ W). CEP 30 cultivar seeds were used, divided into two batches of 1.0 kg each. Prior to carrying out seed analysis, one of the batches was subjected to accelerated ageing to form the low-quality batch. The accelerated ageing test was carried out following the method proposed by AOSA (1983), which involves the use of gearbox-type adapted plastic boxes which serve as mini ageing chambers. Each box was incubated in a cham-ber at 41ºC for 48 h. The batch was called as low physiologi-cal quality based on the assumption that wheat is a winter crop and that heat stress applied in this process is one of the most damaging to seed quality. The second batch was kept under the original conditions to compose the high-qual-ity batch.
After subdividing and batch characterizing, seed analysis tests were carried out by determining the percentage of nor-mal seedlings. Nornor-mal seedlings are those that reveal a po-tential to continue their development and give origin to nor-mal plants when growing under favourable conditions (Brasil, 2009). The germination test was carried out accord-ing to the Seed Analysis Rules (Brasil, 2009). A germinator set to a constant temperature of 25ºC was used and the per-centage of normal seedlings was evaluated at four (initial ger-mination count) and eight days after starting the test.
The germination speed index was calculated on the basis of four replications of 50 seeds, with daily counts of the number of germinated normal seedlings, until a constant number of seedlings was obtained. For each replication, the germination speed index was calculated summing the
num-ber of seedlings germinated on each day and dividing by the number of days elapsed since sowing the seeds on paper. The accelerated ageing test was carried out according to the method described above, and after 48 h of ageing, two samples of 50 seeds were subjected to germination, deter-mining the percentage of normal seedlings six days after. Thus, seeds in the low-quality batch were subjected to two ageing processes, the first to characterize the batch and the second to evaluate the quality of the seeds using the acceler-ated ageing test. The cold test without soil was carried out in four replications of 50 seeds, sown on rolls of filter pa-per moistened with distilled water in a proportion of 2.5 times the mass of the dry paper. Next, the rolls were packed in plastic bags sealed with adhesive tape and transferred to a germinator set to a temperature of 10°C for seven days. Then the rolls were placed in a germinator at 25ºC for seven days, and the evaluation was based on the percentage of normal seedlings. Seedling emergence took place in a greenhouse, with seeds sown on trays of sand in 1-m rows spaced 60 mm and the seeds placed at a depth of 30 mm. Counts were taken at seven and 15 days after sowing and the results were expressed as the percentage of emerged seedlings. The ex-perimental design was fully randomized with three replicates. For seedling characterization, the aerial part length, root length and total seedling length were determined in four rep-lications of ten seeds, sown in a row plotted on the top third of the paper towel, moistened with distilled in a pro-portion of 2.5 times the mass of dry paper. The rolls, placed in sealed plastic bags, were kept in a germinator at a con-stant temperature of 25ºC for five days. Evaluations were carried out by measuring the normal seedlings using a rule. After determining the length of the aerial part, root length and total seedling length, the dry mass of the root and aerial part were determined, which involved transferring the seed-lings to paper bags and placing them in an oven at 80ºC for 48 h. After this period, they were placed in a desiccator for 15 min and the mass of the dry matter was determined.
The data were used for multicollinearity diagnosis for each set of explanatory variables (seedling characteristics and the seed test variables), for both batches. Variables were removed from each set (seedlings and seed tests) for each batch to ana-lyze the condition number, always kept below 100 (weak multicollinearity). The variables removed were chosen based on the relationships between them, excluding those obtained by similar methods. Then, the remaining seedling character-istics were subjected to Pearson correlation analysis and path analysis, taking seedling emergence at seven days as the main variable. The remaining seed test variables were subjected to stepwise multiple regression, taking seedling emergence at seven days as the dependent variable, with the aim of iden-tifying the relationship of these variables to wheat seedling emergence.
The multicollinearity diagnosis, Pearson correlation, path analysis and factor analysis were carried out using the Genes software package (Cruz, 2001), and stepwise regression us-ing the NTIA software package (EMBRAPA, 1997). A prob-ability of 5% was used for all statistical analysis.
Results and Discussion
Using the multicollinearity diagnosis, the sets of explana-tory seedling characteristics from both batches presented a condition number between 100 and 1,000 (weak to moder-ate multicollinearity). Therefore, root dry mass and total seed-ling length were removed from analyses of the characteris-tics seedling set, resulting a data set with weak multicollinearity.
For path analysis, the high-quality batch showed that the root length and shoot dry mass presented similar behavior, with significant correlation coefficients with seedling emer-gence and a high direct effect on emeremer-gence (Table 1). Shoot length had a lower correlation coefficient with seedling emer-gence, with a high indirect effect through shoot dry mass. For the low-quality batch, no variable had a significant corre-lation coefficient with seedling emergence (Table 1). Thus, for the seedling characteristics, shoot dry mass was closely correlated with wheat seedling emergence only for the high physiological quality batch. Furthermore, a high degree of association was observed for root length in the high physi-ological batch, and shoot length in the low-quality batch, this last variable having a negative correlation coefficient, making it difficult to understand in practical terms.
For the high-quality batch, the used variables explained 54.1% of the data variation, whereas for the low-quality
batch, this figure was only 25.6%. This could be due to the higher degree of heterogeneity within the low-quality batch, that is, the different levels of deterioration between the com-posing seeds of the batch do not allow the relationships be-tween the variables to be fully differentiated. The negative correlation coefficients for shoot and root lengths could also reflect this heterogeneity. The efficiency of the accelerated age-ing test applied to the low-quality batch before carryage-ing out the tests can be evaluated by the difference in sensitivity to age seeds in a given batch (Maia et al., 2007). Thus, within a given batch, the most vigorous seeds retain their capacity to produce normal seedlings and are more likely to germinate after being subjected to accelerated ageing, whereas the vi-ability of low-vigor seeds suffers greater impairment (Marcos-Filho, 1994).
Using the stepwise multiple regression analysis on both batches, only the variable for percentage of normal seedlings obtained after accelerated ageing was included in the wheat seedling emergence prediction model (Table 2). Taking into account the R-square, the data gave a good match for the selected model, considering that only one variable resulted in determination coefficients higher than 60% for both batches. Selecting the percentage of normal seedlings ob-tained after the accelerated ageing test in the emergence pre-diction model showed that the stress caused by the heat se-verely affected wheat seedling emergence. Sowing time in each region according to the soil and air temperatures is one of the factors that will determine crop seedling emergence in a uniform way, contributing decisively to the success of the crop.
The use of the accelerated ageing test to evaluate the physiological quality of seeds is promising for extensive crops,
Table 1– Direct and indirect effects of shoot dry mass, total root length and shoot length variables on the emergence of seedlings at seven days for wheat seed batches of low and high physiological quality.
*p < 0.05.
High physiologic quality Low physiologic quality
Variable Aerial part dry mass
Direct effect on the emergence at seven days 0.5899 0.4396
Indirect effect through total root length 0.1219 -0.0066
Indirect effect through aerial part length -0.1639 -0.2491
Pearson correlation coefficient 0.5479* 0.1839
Variable Total root length
Direct effect on the emergence at seven days 0.5194 0.0382
Indirect effect through aerial part dry mass 0.1386 -0.0759
Indirect effect through aerial part length -0.0738 -0.2061
Pearson correlation coefficient 0.5841* -0.2437
Variable Aerial part length
Direct effect on the emergence at seven days -0.2216 -0.5497
Indirect effect through aerial part dry mass 0.4366 0.1992
Indirect effect through root total length 0.1730 0.0143
Pearson correlation coefficient 0.3881 -0.3362
R-square 0.5407 0.2564
such as soybean (Glycine max (L.) Merril) (Hampton and Tekrony, 1995), maize (Zea mays L.) (Bittencourt and Vieira, 2007) and wheat (Lima et al., 2006; Fanan et al., 2006). These results point to the use of the accelerated ageing test for some summer crops as well, showing that this is one of the most important indicators of seed quality for various crops.
For wheat seed batches, Fanan et al. (2006) concluded that accelerated ageing was adequate to evaluate seed vigor. Heat stress is one of the main limiting factors on wheat crops, especially in hotter regions (Cargnin et al., 2006). Heat tolerance of the adult plant is associated with its tolerance at the seedling stage (Blum and Sinmena, 1994). Thus, batches
of seeds which show lower quality after accelerated ageing would be most damaged when this type of stress occurs in the field in any phase of crop development.
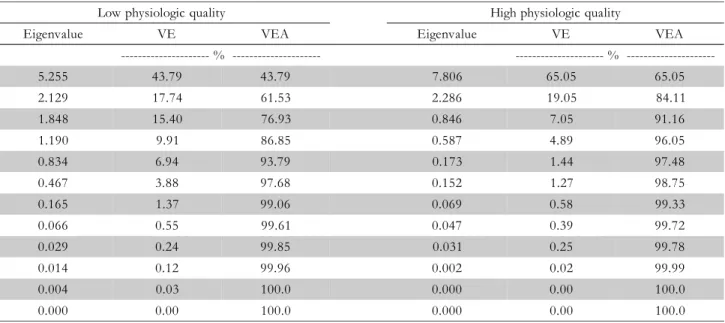
The factor analysis on the low-quality batch showed that the first three components were sufficient to explain 76.93% of the variance (Table 3). For the high-quality batch, the first two components explained 84.11% of total variance. The loads obtained in factor analysis for the analyzed variables in the low-quality batch showed that the accelerated ageing test, total seedling length and seedling emergence at seven days are the variables that best explain the total existing variation. The high-quality seeds showed higher differentiation
be-High physiologic quality
Source Degrees of freedom Sum of squares Mean squares F value Prob.
Accelerated ageing 1 31.988 31.988 39.542 0.00001
Deviation 18 14.562 0.809 ---
---Total 19 46.549 --- ---
---Model EM7 = 5.71171 + 0.13833EA
R-square 0.6872
Low physiologic quality
Accelerated ageing 1 31.991 31.991 28.495 0.00005
Deviation 18 20.208 1.123 ---
---Total 19 52.200 --- ---
---Model EM7 = 4.60281 + 0.14601EA
R-square 0.613
Table 2 – Analysis of variance and stepwise regression equation coefficients for the germination test percentage of normal seedlings, cold test and accelerated ageing (EA) explanatory variable and the seedling emergence at seven days (EM7) main variable for wheat seed batches of high and low physiological quality.
Low physiologic quality High physiologic quality
Eigenvalue VE VEA Eigenvalue VE VEA
--- % --- %
---5.255 43.79 43.79 7.806 65.05 65.05
2.129 17.74 61.53 2.286 19.05 84.11
1.848 15.40 76.93 0.846 7.05 91.16
1.190 9.91 86.85 0.587 4.89 96.05
0.834 6.94 93.79 0.173 1.44 97.48
0.467 3.88 97.68 0.152 1.27 98.75
0.165 1.37 99.06 0.069 0.58 99.33
0.066 0.55 99.61 0.047 0.39 99.72
0.029 0.24 99.85 0.031 0.25 99.78
0.014 0.12 99.96 0.002 0.02 99.99
0.004 0.03 100.0 0.000 0.00 100.0
0.000 0.00 100.0 0.000 0.00 100.0
tween the vigor tests, making it easier to choose the test to be used. This is proven by the explanation of total varia-tion, in which the high-quality batch showed higher explained variation with fewer factors (Table 3).
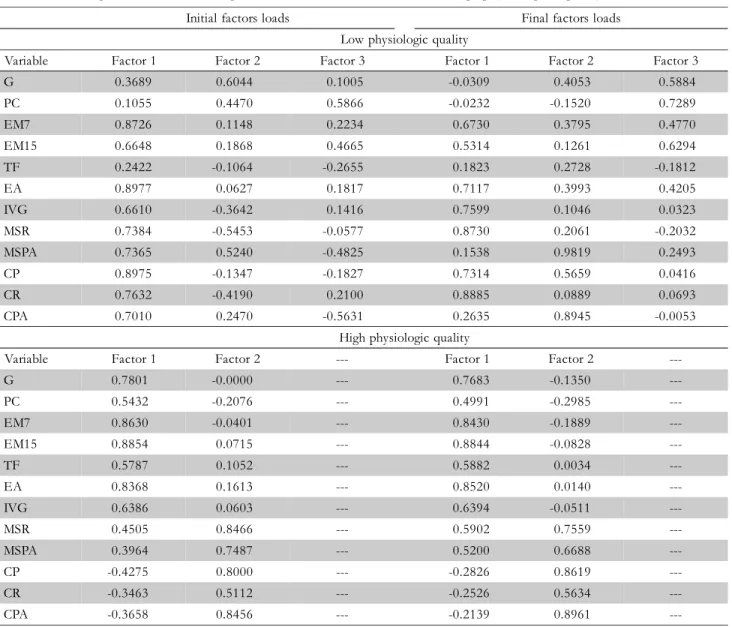
For the high-quality batch, factor 1 refers to seed test vari-ables, with the stronger explanation provided by seedling emergence at seven and 15 days, percentage of normal seed-lings obtained by the accelerated ageing and germination tests. However, for the low physiological quality batch, this behav-ior is not so clear. Thus, for high-quality seeds, choosing the vigor test to be used turns the procedure easier due to the better differentiation between these tests (Table 4). Factor 2, in the high-quality batch, refers to the seedling characteris-tics, with total variation best explained by the root dry mass and total seedling length variables. For the low-quality batch, factor 1 is related to seedling characteristics and also to the tests, such as total seedling length, percentage of normal
seed-Table 4– Factors associated with the percentage of normal seedlings in the germination tests (G), initial germination count (PC), cold test (TF), accelerated ageing test (EA), germination speed index (IVG), seedling emergence at seven days (EM7), seedling emergence at 15 days (EM15), root dry mass (MSR), shoot dry mass (MSPA), and total seedling length (CP), root length (CR) and shoot length (CPA), for wheat seeds of low and high physiological quality.
Initial factors loads Final factors loads
Low physiologic quality
Variable Factor 1 Factor 2 Factor 3 Factor 1 Factor 2 Factor 3
G 0.3689 0.6044 0.1005 -0.0309 0.4053 0.5884
PC 0.1055 0.4470 0.5866 -0.0232 -0.1520 0.7289
EM7 0.8726 0.1148 0.2234 0.6730 0.3795 0.4770
EM15 0.6648 0.1868 0.4665 0.5314 0.1261 0.6294
TF 0.2422 -0.1064 -0.2655 0.1823 0.2728 -0.1812
EA 0.8977 0.0627 0.1817 0.7117 0.3993 0.4205
IVG 0.6610 -0.3642 0.1416 0.7599 0.1046 0.0323
MSR 0.7384 -0.5453 -0.0577 0.8730 0.2061 -0.2032
MSPA 0.7365 0.5240 -0.4825 0.1538 0.9819 0.2493
CP 0.8975 -0.1347 -0.1827 0.7314 0.5659 0.0416
CR 0.7632 -0.4190 0.2100 0.8885 0.0889 0.0693
CPA 0.7010 0.2470 -0.5631 0.2635 0.8945 -0.0053
High physiologic quality
Variable Factor 1 Factor 2 --- Factor 1 Factor 2
---G 0.7801 -0.0000 --- 0.7683 -0.1350
---PC 0.5432 -0.2076 --- 0.4991 -0.2985
---EM7 0.8630 -0.0401 --- 0.8430 -0.1889
---EM15 0.8854 0.0715 --- 0.8844 -0.0828
---TF 0.5787 0.1052 --- 0.5882 0.0034
---EA 0.8368 0.1613 --- 0.8520 0.0140
---IVG 0.6386 0.0603 --- 0.6394 -0.0511
---MSR 0.4505 0.8466 --- 0.5902 0.7559
---MSPA 0.3964 0.7487 --- 0.5200 0.6688
---CP -0.4275 0.8000 --- -0.2826 0.8619
---CR -0.3463 0.5112 --- -0.2526 0.5634
---CPA -0.3658 0.8456 --- -0.2139 0.8961
---lings obtained by the accelerated ageing test and seedling emergence at seven days. The second factor refers to the dry mass and length of the seedling aerial part. The third factor refers to the initial count of the percentage of normal seed-lings obtained for the germination test and plant emergence at 15 days. Thus, the percentage of normal seedlings obtained for the accelerated ageing test is the most important variable for both wheat seed batches, as confirmed by all the meth-ods used. For the high-quality batch, root length and Shoot dry mass showed greater correlation with seedling emergence. Thus, selecting these variables is recommended for predict-ing the physiological quality of wheat seeds.
Conclusions
pre-dicting wheat seedling emergence in both high and low physi-ological quality batches. Root length and shoot dry mass cor-related best with seedling emergence for the high physiologi-cal quality batch. For the low-quality batch, no variable was closely correlated with seedling emergence.
References
Amaral, A.S.; Peske, S.T. 2000. Tests to evaluation of wheat seeds physiologic quality. Revista Brasileira de Agrociência 6: 12-15. (in Portuguese, with abstract in English).
Association of Official Seed Analysts [AOSA]. 1983. Seed Vigor Testing Handbook. AOSA, Ithaca, NY, USA
Barros, D.I.; Nunes, H.V.; Dias, D.C.F.S.; Bhering, M.C. 2002. Comparison of vigour methods to evaluate tomato seeds. Revista Brasileira de Sementes 24: 12-16. (in Portuguese, with abstract in English). Bittencourt, S.R.M.; Vieira, R.D. 2007. Temperature and period of
corn seeds in the accelerated test. Revista Brasileira de Sementes 28: 161-168. (in Portuguese, with abstract in English).
Blum, A.; Sinmena, B. 1994. Wheat seed endosperm utilization under heat stress and its relation to thermotolerance in the autotrophic plant. Field Crops Research 37: 185-191.
Brasil. Ministério da Agricultura e Reforma Agrária. 1992. Seeds analysis rules. SNAD/CLAV, Brasília, DF, Brazil. (in Portuguese). Cargnin, A.; Souza, M.A.; Dias, D.C.F.S.; Machado, J.C.; Machado, C.G.;
Sofiatti, V. 2006. Tolerance to heat stress in germinating wheat genotypes. Bragantia 65: 245-251. (in Portuguese, with abstract in English).
Cruz, C.D. 2001. GENES prog ram: Windows version: application computational in genetic and statistic. UFV, Viçosa, MG, Brazil. (in Portuguese).
Cruz, C.D.; Carneiro, P.C.S. 2003. Biometric models applied to genetic improvement. UFV, Viçosa, MG, Brazil. (in Portuguese). Delouche, J.C. 1976. Standardization of vigor tests. Journal of Seed
Technology. 1:75-85.
Empresa Brasileira de Pesquisa Ag ropecuária [EMBRAPA]. 1997. Environme nt of software NTIA, version 4.2.2: use r manual: statistical tool. Embrapa, Campinas, SP, Brazil. (in Portuguese). Fanan, S.; Medina, P.F.; Lima, T.C.; Marcos-Filho, J. 2006. Evaluation of
wheat seeds vigor by accelerated and cold tests. Revista Brasileira de Sementes28: 152-158. (in Portuguese, with abstract in English). Hampton, J.G.; Tekrony, D.M. 1995. Handbook of Vigor Test Methods.
1995. ISTA, Zürich, SH.
Johnson, R.A.; Wicherns, D.W. 1998. Applied Multivariate Statistical Analysis. Upper Saddle River, NJ, EUA.
Kurek, A.J.; Carvalho, F.I.F.; Assmann, I.C.; Marchioro, V.S.; Cruz, P.J. 2001. Path analysis for indirect seletion of bean field. Revista Brasileira de Agrociência 7: 29-32. (in Portuguese, with abstract in English).
Lima, T.C.; Medina, P.F.; Fanan, S. 2006. Vigor evaluation of wheat seeds using the accelerated ageing test. Revista Brasileira de Sementes 28: 106-113. (in Portuguese, with abstract in English). Maia, A.R.; Lopes, J.C.; Teixeira, C.O. 2007. Effect of accelerated in the
evaluati on of phy sio log ic qual ity in wh eat se eds. Ciên cia e Agrotecnol ogia 31: 678-684. (i n Portuguese, with abstract in English).
Marcos-Filho, J. 1994. Accelerated ageing test. p. 133-150. In: Vieira, R.D.; Carvalho, N.M., eds. Vigor seeds tests. Funep, Jaboticabal, SP, Brazil. (in Portuguese).
Popinigis, F. 1985. Seed Physiology. AGIPLAN, Brasília, DF, Brazil. (in Portuguese).