Gastroduodenal resistance and neural
mechanisms involved in saline flow
decrease elicited by acute blood volume
expansion in anesthetized rats
1Departamento de Fisiologia e Farmacologia, Universidade Federal do Ceará,
Fortaleza, CE, Brasil
2Laboratório de Biologia Molecular, Instituto do Coração (INCOR),
Faculdade de Medicina, Universidade de São Paulo, São Paulo, SP, Brasil J.R.V. Graça1,
F. de-A.A. Gondim1,
D.I.M. Cavalcante1,
J. Xavier-Neto2, E.L.M. Messias1,
M.C.V. Rego1, J.A.P. Marques1,
A.A. Santos1 and F.H. Rola1
Abstract
We have previously demonstrated that blood volume (BV) expansion decreases saline flow through the gastroduodenal (GD) segment in anesthetized rats (Xavier-Neto J, dos Santos AA & Rola FH (1990) Gut, 31: 1006-1010). The present study attempts to identify the site(s) of resistance and neural mechanisms involved in this phenomenon. Male Wistar rats (N = 97, 200-300 g) were surgically manipulated to create four gut circuits: GD, gastric, pyloric and duodenal. These circuits were perfused under barostatically controlled pressure (4 cmH2O).
Steady-state changes in flow were taken to reflect modifications in circuit resistances during three periods of time: normovolemic control (20 min), expansion (10-15 min), and expanded (30 min). Perfusion flow rates did not change in normovolemic control animals over a period of 60 min. BV expansion (Ringer bicarbonate, 1 ml/min up to 5% body weight) signif-icantly (P<0.05) reduced perfusion flow in the GD (10.3 ± 0.5 to 7.6 ± 0.6 ml/min), pyloric (9.0 ± 0.6 to 5.6 ± 1.2 ml/min) and duodenal (10.8 ± 0.4 to 9.0 ± 0.6 ml/min) circuits, but not in the gastric circuit (11.9 ± 0.4 to 10.4 ± 0.6 ml/min). Prazosin (1 mg/kg) and yohimbine (3 mg/kg) prevented the expansion effect on the duodenal but not on the pyloric circuit. Bilateral cervical vagotomy prevented the expansion effect on the pylorus during the expansion but not during the expanded period and had no effect on the duodenum. Atropine (0.5 mg/kg), hexamethonium (10 mg/kg) and propranolol (2 mg/kg) were ineffective on both circuits. These results indicate that 1) BV expansion increases the GD resistance to liquid flow, 2) pylorus and duodenum are important sites of resistance, and 3) yohimbine and prazosin prevented the increase in duodenal resistance and vagotomy prevented it partially in the pylorus.
Correspondence
F.H. Rola
Departamento de Fisiologia e Farmacologia
Universidade Federal do Ceará Rua Coronel Nunes de Melo, 1127 Caixa Postal 3157
60430-270 Fortaleza, CE Brasil
Fax: 55 (085) 243-9333 E-mail:
This work was presented at the IX and X Annual Meetings of the Federação de Sociedades de Biologia Experimental, Caxambu, MG, Brasil, 1994 and 1995, and at the 5th United European Gastroenterological Week, Paris, France, 1996, and reported in abstract form (1).
Research supported by CNPq, CAPES, UNIMED and UFC. Publication supported by FAPESP.
Received January 10, 1997 Accepted August 19, 1997
Key words
•Blood volume expansion •Gastroduodenal resistance •Duodenum
•Pylorus •α-Blockers •Vagotomy
Introduction
There is increasing evidence indicating that the gastrointestinal (GI) tract is an active regu-lator of the homeostatic response to volume imbalance, i.e., acute blood volume changes
modify the GI motor function (1-7) as well as its permeability to salt and water (8,9).
also indicate that decreased jejunal absorp-tion elicited by increased uretero-pelvic pres-sure may be important to manage increased body fluid volume (11). Besides changing absorption and secretion (8,9), the integrated GI response to a volume challenge could conceivably involve adjustments in the rela-tionship between luminal fluid and epithe-lial surface area, as well as in motor patterns which could maximize net absorption or se-cretion after blood volume (BV) retraction and expansion, respectively.
In this respect, we first demonstrated that gastric and jejunal compliances are modi-fied by acute volemic changes (2,3). We have also observed that gastroduodenal (GD) resistance to the liquid flow is increased after BV expansion in rats and dogs (4,5). In the present study we utilized a rat model (4) to further detail the GD resistances (stom-ach, pylorus and duodenum) and the neural mechanisms involved in the GD flow de-crease due to BV expansion.
Material and Methods
Surgical procedures
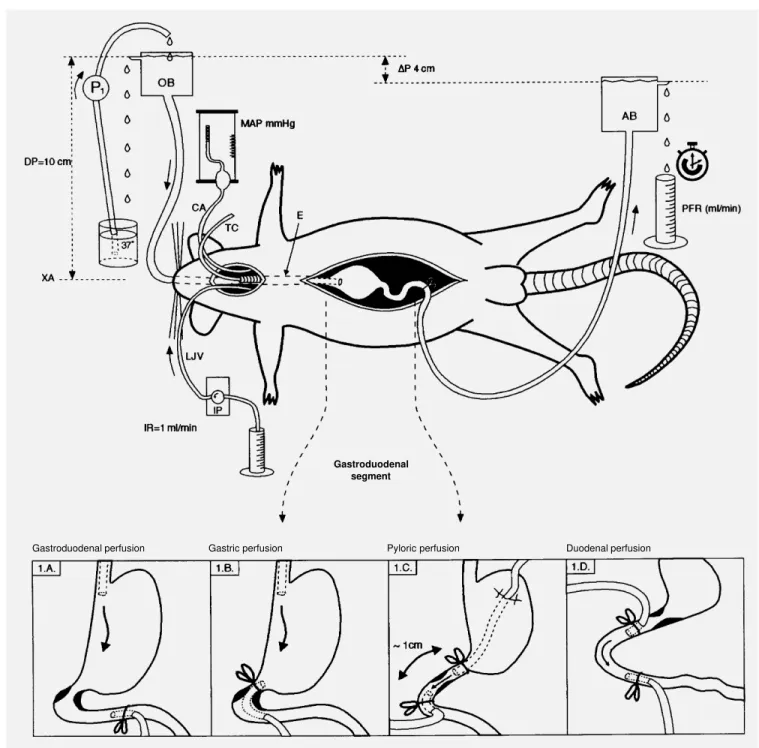
Male Wistar rats (200-300 g) were fasted for 24 h and allowed free access to water before surgery. The animals were anesthe-tized with urethane (1.2 g/kg, intraperito-neal) and a cannula was inserted into the trachea to ensure free breathing. The right carotid artery and the left jugular vein were cannulated with a polyethylene tube (PE 50) for mean arterial pressure (MAP) measure-ments and to perform BV expansion, respec-tively. The design and methodology em-ployed were essentially the same as described by Xavier-Neto et al. (4), which have been extensively utilized in other studies (4,5,12). The abdomen was opened through a midline incision and the gastroduodenal segment was handled to create four different perfusion circuits (Figure 1).
Group A (Figure 1A): gastroduodenal
perfusion (N = 9). A polyethylene cannula (O.D. = 3 mm, I.D. = 1.5 mm) was intro-duced into the gastric fundus per os and fixed with a ligature around the cervical esophagus, while another cannula (O.D. = 4 mm, I.D. = 2 mm) was inserted into the duodenum through a fistula and the tip was then positioned 2.5 cm from the pylorus and fixed with a ligature.
Group B (Figure 1B): gastric perfusion (N = 10). A polyethylene cannula (O.D. = 3 mm, I.D. = 1.5 mm) was placed in the proxi-mal portion of the stomach as in group A and a second cannula (O.D. = 4 mm, I.D. = 2 mm) was positioned in the gastric antrum through a fistula located in the duodenum 1.0 cm from the pylorus and fixed with a duodenal ligature.
Group C (Figure 1C): pyloric perfusion (N = 10). A polyethylene cannula (O.D. = 3 mm, I.D. = 1.5 mm) was placed in the stom-ach immediately before the pylorus through a fistula located in the gastric fundus region. A second polyethylene cannula (O.D. = 4 mm, I.D. = 2 mm) was advanced through a duodenal fistula, and the tip was positioned immediately after the pylorus, approximately 1 cm after the first cannula. To avoid twist-ing, the cannulas were exteriorized through two lateral abdominal incisions.
Group D (Figure 1D): duodenal perfu-sion (N = 9). The proximal duodenum re-ceived an oral cannula through a fistula (O.D. = 4 mm, I.D = 2 mm) which was positioned 1 cm beyond the pylorus. A second duodenal cannula (O.D. = 4 mm, I.D = 2 mm) was also fixed 3 cm below the oral cannula. Both cannulas were fixed with a ligature around the duodenum.
Perfusion system
Gastroduodenal segment
Gastroduodenal perfusion Gastric perfusion Pyloric perfusion Duodenal perfusion
aboral flow was driven by a constant gradi-ent of 4 cmH2O in all groups. This gradient
was established by setting the liquid level of the oral barostat connected to the gastric cannula (in groups A, B and C) or to the oral duodenal cannula (in group D) 10 cm above the xiphoid appendix, while keeping the liq-uid level of the aboral barostat 6 cm above the xiphoid appendix. The liquid level of the oral barostat was kept constant by pumping back the liquid flowing out of it by leakage. The liquid level of the aboral barostat was also kept constant by leakage.
The perfusion temperature was main-tained at 37oC by previously circulating the
saline solution through a heated water bath. The perfusion saline volume flowing off the aboral barostat perfusion was collected and measured every 2 min as perfusion flow (PF) rate (in ml/min). In this communicating ves-sel system the only resistance which could vary was the segment being perfused, and in the steady state the liquid flowing out of the aboral barostat reflects the resistance of the perfused segment.
Cardiovascular parameters
MAP was measured with an Hg manom-eter connected to the carotid cannula and zeroed with the normal ictus cordis. Central venous pressure (CVP) was determined by positioning a PE 50 catheter in the right atrium via the jugular vein, before and after 5% expansion in a separate group of anes-thetized animals (N = 5). The PE 50 catheter was connected to a water manometer also zeroed with the normal ictus cordis. Intra-cardiac samples were also collected for he-matocrit determination in this group.
BV expansion
BV was expanded according to the proto-col of Humphreys and Earley (13). Briefly, the animals were infused iv with Ringer bi-carbonate solution (Na+ = 140 mM, K+ = 4
mM, Cl- = 124 mM, HCO
3- = 20 mM) at a
rate of 1 ml/min up to a volume equivalent to 5% body weight.
Experimental design
PF rates and MAP levels were recorded every 2 min throughout the experiment in all groups. After 20 min (control period) the animals had their BV expanded by an iv infusion of Ringer bicarbonate solution at a rate of 1 ml/min up to a volume equivalent to 5% body weight, which was completed within about 10 to 15 min (expansion period). After expansion the animals were observed for an additional period of 30 min (expanded pe-riod). All groups had appropriate non-ex-panded, normovolemic time controls. In these experiments PF rates and MAP levels were measured for 60 min in the absence of BV expansion.
Neural mechanism investigation
performed and the PF rates and MAP levels were monitored during the expansion (10-15 min) and expanded periods (30 min).
Statistical analysis
Data are reported as means ± SEM. One-way analysis of variance of repeated meas-ures (ANOVA) and the Dunnett’s test were used to compare different groups (Sigma Stat for Windows, version 1.0, Copyright 1992-1994, Jandel Corporation (San Rafael, CA). Comparisons between experimental groups and their respective time controls
were made using equivalent time periods. Statistical differences were considered to be significant at P<0.05.
Results
Effect of BV expansion on GD, pyloric, duodenal and gastric PF rates and MAP levels
Figure 2 shows the changes in GD, gas-tric, pyloric and duodenal perfusion flows during the experiments in time control ani-mals and in aniani-mals submitted to BV expan-sion (up to 5% body weight) after the 20-min
Gastroduodenal flow (ml/min)
15
MAP (mmHg)
140 12
9
6
3
0
TC Cont TC Exp 1% 2% 3% 4% 5% TC Exd 10 20 30 min TC Cont TC Exp 1% 2% 3% 4% 5% TC Exd 10 20 30 min
70
MAP (mmHg)
140
70
MAP (mmHg)
140
70
Gastric flow (ml/min)
15
12
9
6
3
0
Pyloric flow (ml/min)
15
12
9
6
3
0
TC Cont TC Exp 1% 2% 3% 4% 5% TC Exd 10 20 30 min
Duodenal flow (ml/min)
15
12
9
6
3
0
TC Cont TC Exp 1% 2% 3% 4% 5% TC Exd 10 20 30 min
MAP (mmHg)
140
70
A B
C D
* * *
* *
* *
* *
* *
* * * *
* * * * *
* * * * *
* * * *
* * * * *
* * *
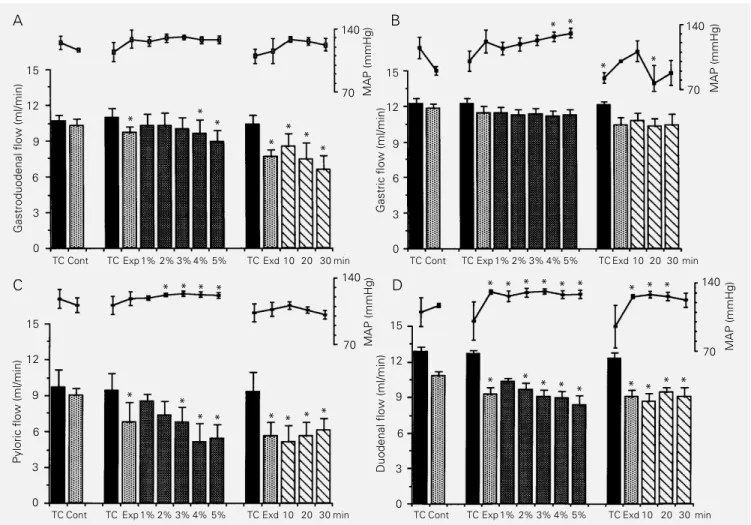
Figure 2 - Modifications in gastroduodenal (A), gastric (B), pyloric (C) and duodenal (D) perfusion flow (PF) rates and mean arterial pressure (MAP) in normovolemic time controls and in animals submitted to blood volume (BV) expansion. TC (black bars) refers to time control animals (N = 5, 5, 5 and 4 for GD, gastric, pyloric and duodenal PF rates, respectively) during the 60-min observation period, which was divided into three parts (corresponding to the control, expansion and expanded periods of experimental animals). The control (Cont), expansion (Exp) and expanded (Exd) periods were also divided in experimental animals (N = 5 for each circuit). Expansion was divided into five parts according to the amount of volume infused (up to 1, 2, 3, 4 and 5% of body weight). The expanded period was divided into three parts: 10, 20 and 30 represent the PF rates in the first 10, middle 10 and in the last 10 min of the 30-min expanded period. Vertical lines represent the SEM. *P<0.05 compared to control levels (Dunnett‘s test).
normovolemic control period.
PF rates for normovolemic time controls were quite stable throughout the experiments (60 min) in all the perfusion circuits studied. PF rates for the first 20, middle 10 and last 30 min of time control experiments were 10.6 ± 0.5, 10.9 ± 0.8, 10.4 ± 0.7; 12.2 ± 0.4, 12.2 ± 0.4, 12.1 ± 0.3; 9.7 ± 1.4, 9.4 ± 1.4, 9.3 ± 1.6 and 12.8 ± 0.4, 12.6 ± 0.3, 12.3 ± 0.4 ml/min for GD, gastric, pyloric and duodenal perfu-sion, respectively (P>0.05 for all groups). MAP levels were also quite stable through-out the experimental period in time control animals.
We can also see in Figure 2 that BV expansion significantly decreased the GD, pyloric and duodenal saline flow rates. The gastric perfusion circuit did not respond to BV expansion. In the GD and pyloric seg-ments, decreases in flow started during pansion and were fully developed after ex-pansion was completed. In the duodenal seg-ment the effect of expansion was already maximal during the expansion period and remained as such until the end of the experi-ment. PF rates in the three periods (normo-volemic control, expansion and expanded) were 10.3 ± 0.5, 9.7 ± 0.5, 7.6 ± 0.6, P<0.05; 11.9 ± 0.4, 11.4 ± 0.6, 10.4 ± 0.6, P>0.05; 9.0 ± 0.6, 6.8 ± 1.6, 5.6 ± 1.2, P<0.05, and 10.8 ± 0.4, 9.2 ± 0.6, 9.0 ± 0.6 ml/min,P<0.05, for GD, gastric, pyloric and duodenal perfusion, respectively. The mean PF rate decreases during the expanded period in the GD, gas-tric, pyloric and duodenal circuits were 26.2%, 12.6%, 37.7% and 16.7%, respectively.
Figure 2 also shows that MAP levels were only transiently increased during the expansion and expanded periods in the GD, gastric and pyloric circuits. In the duodenal circuit, however, MAP levels were consis-tently increased during the expansion and expanded periods (from 117.0 ± 1.9, control, to 131.0 ± 1.8, expansion, P<0.05, and to 126.0 ± 1.8 mmHg, expanded, P<0.05).
Figure 2 also details the development of
flow changes as a result of increased per-centage of infused volume (up to 1-5% body weight). The GD flow gradually decreased during the expansion period, reaching statis-tical significance at 4% body weight expan-sion and remained below control levels throughout the expanded period. Gastric flow did not change during BV expansion. The pyloric flow also gradually decreased and attained statistical significance at 3% body weight. This effect persisted until the end of the expanded period. The duodenal flow also decreased, attaining statistical signifi-cance even earlier, when BV expansion reached 2% body weight and again the effect persisted at least until the end of the ex-panded period.
Mean hematocrit values decreased from 49.3 ± 1.4% in normovolemic animals to 34 ± 1.1% after 5% expansion (P<0.05) and CVP levels increased from 3.6 ± 1.6 to 9.6 ± 3.2 cmH2O after 5% expansion (P<0.05).
Neural mechanism investigation
Discussion
We have previously observed that gastric and jejunal compliances are modified by acute volemic changes in anesthetized dogs (2,3). In addition, we further demonstrated that the gastroduodenal resistance to liquid flow was modified by acute volemic changes: BV expansion decreased the gastroduodenal flow while retraction increased it (4,5). Re-cently, we have also extended these observa-tions to the lower GI tract, i.e., the ileoco-lonic segment (6). This evidence leads us to speculate about the possible coupling be-tween GI tract motility and intestinal water and sodium flux to correct the body fluid imbalance observed under these volemic con-ditions.
The present study confirms our previous findings in the rat (4) showing that BV ex-pansion reduces saline flow through the GD segment perfused under barostatically con-trolled conditions. However, it further de-tails the sites of resistance (pylorus and duodenum) and the neural mechanisms in-volved. In addition, it extends our observa-tions to a less severe experimental protocol of BV expansion, since BV expansion was up to 5% body weight instead of the 10% expansion previously performed (4). The rat model utilized (4) appears to be an adequate experimental model to investigate the gas-troduodenal resistances, with stable time controls and high reproducibility.
In the barostatically controlled system used in the experiments, changes in flow
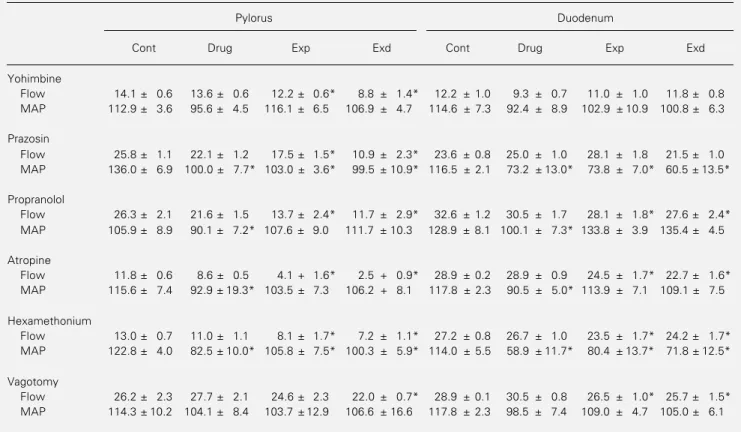
Table 1 - Mean perfusion flow rates (duodenal and pyloric flows, ml/min) and mean arterial pressure (MAP, mmHg) levels in the animals submitted to bilateral cervical vagotomy or intravenous injection of yohimbine (3 mg/kg), prazosin (1 mg/kg), propranolol (2 mg/kg), atropine (0.5 mg/kg) or hexamethonium (10 mg/kg).
Cont refers to the control period before drug injection, Drug to the drug control period before expansion, Exp to the expansion period after drug injection and Exd to the expanded period after drug injection. Data are reported as means ± SEM of 4 animals in each group. *P<0.05 vs drug control period (Drug) (Dunnett‘s test).
Pylorus Duodenum
Cont Drug Exp Exd Cont Drug Exp Exd
Yohimbine
Flow 14.1 ± 0.6 13.6 ± 0.6 12.2 ± 0.6* 8.8 ± 1.4* 12.2 ± 1.0 9.3 ± 0.7 11.0 ± 1.0 11.8 ± 0.8 MAP 112.9 ± 3.6 95.6 ± 4.5 116.1 ± 6.5 106.9 ± 4.7 114.6 ± 7.3 92.4 ± 8.9 102.9 ± 10.9 100.8 ± 6.3
Prazosin
Flow 25.8 ± 1.1 22.1 ± 1.2 17.5 ± 1.5* 10.9 ± 2.3* 23.6 ± 0.8 25.0 ± 1.0 28.1 ± 1.8 21.5 ± 1.0 MAP 136.0 ± 6.9 100.0 ± 7.7* 103.0 ± 3.6* 99.5 ± 10.9* 116.5 ± 2.1 73.2 ± 13.0* 73.8 ± 7.0* 60.5 ± 13.5*
Propranolol
Flow 26.3 ± 2.1 21.6 ± 1.5 13.7 ± 2.4* 11.7 ± 2.9* 32.6 ± 1.2 30.5 ± 1.7 28.1 ± 1.8* 27.6 ± 2.4* MAP 105.9 ± 8.9 90.1 ± 7.2* 107.6 ± 9.0 111.7 ± 10.3 128.9 ± 8.1 100.1 ± 7.3* 133.8 ± 3.9 135.4 ± 4.5
Atropine
Flow 11.8 ± 0.6 8.6 ± 0.5 4.1 + 1.6* 2.5 + 0.9* 28.9 ± 0.2 28.9 ± 0.9 24.5 ± 1.7* 22.7 ± 1.6* MAP 115.6 ± 7.4 92.9 ± 19.3* 103.5 ± 7.3 106.2 + 8.1 117.8 ± 2.3 90.5 ± 5.0* 113.9 ± 7.1 109.1 ± 7.5
Hexamethonium
Flow 13.0 ± 0.7 11.0 ± 1.1 8.1 ± 1.7* 7.2 ± 1.1* 27.2 ± 0.8 26.7 ± 1.0 23.5 ± 1.7* 24.2 ± 1.7* MAP 122.8 ± 4.0 82.5 ± 10.0* 105.8 ± 7.5* 100.3 ± 5.9* 114.0 ± 5.5 58.9 ± 11.7* 80.4 ± 13.7* 71.8 ± 12.5*
Vagotomy
rates through the perfused segments may be due to alterations in resistance, capacitance or both. An increase in capacitance is a rather unlikely mechanism to explain flow reduction during BV expansion, since the volumetric capacity of the perfused segments (GD, gastric, pyloric and duodenal) is clearly lower than the amount of fluid used in the perfusion system (perfusion minute flow). Furthermore, in this experimental model, capacitance changes would have been tran-sient and not long-lasting to determine the persistence of the decrease in the flow rates during both the expansion and expanded periods, as we observed. The increased re-sistance instead of the increased capacitance hypothesis is further supported by our own results showing that BV expansion is associ-ated with reductions rather than with
in-Flow (ml/min)
Flow (ml/min)
20
15
10
5
0
Pylorus Yohimbine Duodenum (3 mg/kg)
150
50 MAP (mmHg)
150
50 MAP (mmHg)
150
50 MAP (mmHg) 20
15
10
5
0
Pylorus Duodenum
Cervical vagotomy
Pylorus Prazosin Duodenum (1 mg/kg)
Flow (ml/min)
20
15
10
5
0
A B
C
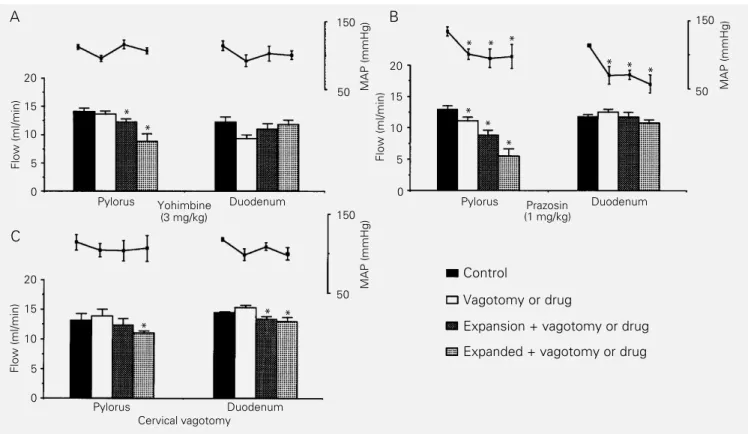
Control
Vagotomy or drug
Expansion + vagotomy or drug
Expanded + vagotomy or drug
Figure 3 - Details of the effect of yohimbine (N = 5), prazosin (N = 5) and bilateral cervical vagotomy (N = 5) on the decrease in blood volume expansion-induced pyloric and duodenal perfusion flow (PF) rates and on mean arterial pressure (MAP) levels. After a 20-min normovolemic control period (control), yohimbine or prazosin was injected iv or bilateral cervical vagotomy was performed. After another control period (vagotomy or drug), the animals had their blood volume expanded up to 5% body weight (expansion + vagotomy or drug). This phase was followed by another 30 min of observation (expanded + vagotomy or drug). Bars represent mean PF rate in ml/min. Dots indicate MAP levels in mmHg and the vertical lines represent the SEM. *P<0.05 vs control levels (MAP) or vs vagotomy or drug levels (PF rates) (ANOVA and Dunnett‘s test).
creases in gastric (2) or intestinal compli-ances (3).
The decrease in GD, pyloric and duode-nal flow rates elicited by BV expansion (up to 5% body weight) seems to be a slowly progressing process, therefore being basi-cally different from the fast effect previously reported by Xavier-Neto et al. (4). However, when we separately analyzed the evolution of flow rate changes against the percentage of BV expansion, we observed that the effect of BV expansion on the PF rates develops quickly, attaining statistical significance af-ter infusion of volumes equivalent to 2 or 3% body weight in the duodenal and pyloric perfusions, respectively.
The relative importance of increases in pyloric vs duodenal resistance remains to be established. Duodenal resistance appears to
* *
* * *
* *
*
* *
*
be increased earlier by BV expansion (2% body weight) but, on the other hand, the increase in pyloric resistance appears to be greater. The data in Figure 2 suggest that isolated increases in duodenal resistance (as shown after 2% body weight BV expansion) are not sufficient to produce sustained re-ductions of flow in the GD segment. It is possible that stable reductions in GD flow are only observed when the combined con-tribution of pyloric and duodenal resistances is fully developed.
The flow decrease was more pronounced in the pyloric than in the duodenal circuit. This finding may be related to the peculiari-ties of the duodenal circuit, since coinciden-tally the duodenum was the only circuit where MAP levels were persistently increased, in contrast to the transient MAP changes ob-served in the other circuits. In fact, we also observed different patterns of MAP changes when we perfused separate parts of the ileo-colonic segment, which we were unable to explain (6). The pyloric response was sur-prising, since we also observed that pyloro-plasty did not abolish the effect of BV ex-pansion on the gastric emptying of liquid in awake rats (14). The possible pyloric role in gastric outflow regulation is controversial, since the pylorus has not been widely ac-cepted as an important site of resistance in the GD segment. However, our results are consistent with those of Edinet al. (12) who showed that the pylorus can act as a site of resistance to liquid flow, when barostatically perfused under controlled pressure gradi-ents. The results also demonstrated that gas-tric resistance is not elicited by BV expan-sion. However, since the stomach was per-fused as a whole, the lack of gastric response does not permit us to rule out a modification in compliance of the gastric fundus, which has mainly a reservoir function, since our experimental protocol is more apt to detect changes of resistance rather than compli-ance.
The hemodynamic data indicate that the
effect of BV expansion on the PF rates does not correlate well with MAP level changes since reductions in liquid flow rate were maintained long after MAP returned to con-trol levels in the pyloric and duodenal perfu-sion groups. CVP levels, however, were con-sistently increased and hematocrit values sig-nificantly decreased by BV expansion.
After establishing that the pylorus and duodenum were the main sites of resistance to saline flow activated by BV expansion, we decided to investigate the possible neural mechanisms involved in the flow decrease in these two circuits. Cholinergic pathways appear not to be involved, since atropine did not block the expansion effect. Interestingly, bilateral cervical vagotomy prevented the effect of expansion on the pylorus during the expansion period, but had no effect on the duodenum. These findings indicate that va-gal pathways are necessary for the full ex-pression of the effect of BV expansion on GI motility. However, a more precise definition of the vagal participation could not be ob-tained, since anesthesia per se interferes with vagal activity (15).
Yohimbine (an α-2 antagonist) and pra-zosin (an α-1 antagonist) prevented the de-crease in duodenal PF rate during the expan-sion and expanded periods while proprano-lol (aß-blocker) was ineffective. In fact, α adrenergic activation is known to mediate GI motility inhibition (16), i.e., clonidine (an α-2 agonist) delays small intestine transit in the rat (17) and reduces the amplitude of gastric phasic contractions (18). We do not know whether the effect of prazosin and yohimbine was peripheral or central. How-ever, since hexamethonium was ineffective and expected to block a peripheral adrener-gic activation, the results point to a central α -receptor activation or to an effect of prazosin and yohimbine on non-α receptors, such as imidazoline receptors, as also suggested by others (19).
natriuretic peptide (ANP) release, which may interfere with GI motility and absorption. ANP increases the magnitude of spontane-ous duodenal contractions (20) and reduces fluid and electrolyte absorption (21).
In summary, we conclude that 1) the GD segment appears to be a target region for volume-dependent modulation by
increas-ing its resistance to liquid flow durincreas-ing and after BV expansion, 2) pylorus and duode-num are two important sites of resistance in the GD segment which are activated by BV expansion, and 3) α-adrenergic and vagal pathways appear to be involved in this phe-nomenon.
References
1. Da Graça JRV, Cavalcante DIM, Gondim F de AA, Oliveira GR, Rego MCV, Alencar HMP & Rola FH (1996). Neural mecha-nisms and gastroduodenal resistances to saline flow activated by acute blood vol-ume expansion in awake rats. Gut, 39 (Suppl 3): 156 (Abstract).
2. Capelo LR, Cavalcante DM, Leitão IA, Cristino Filho G & Da-Silva EAT (1983). Modifications of gastric compliance in dogs related to changes of extracellular fluid volume: A possible physiological role.
Brazilian Journal of Medical and Biological Research, 16: 73-76.
3. Rola FH, Santos AA, Xavier-Neto J, Cristino Filho G, Rocha CI, Santiago Jr AT, Gondim FAA, Pereira JM & Capelo LR (1989). Effects of acute volemic changes on the jejunal compliance in dogs. Brazil-ian Journal of Medical and Biological Re-search, 22: 523-531.
4. Xavier-Neto J, dos Santos AA & Rola FH (1990). Acute hypervolemia increases the gastroduodenal resistance to the flow of saline in rats. Gut, 31: 1006-1010. 5. Santos AA, Xavier-Neto J, Santiago Jr AT,
Souza MAN, Martins AS, Alzamora F & Rola FH (1991). Acute volaemic changes modify the gastroduodenal resistance to the flow of saline in anaesthetized dogs.
Acta Physiologica Scandinavica, 143: 261-268.
6. Santiago Jr AT, Gondim F de-AA, Cavalcante DIM, da-Graça JRV, de-Oliveira GR, Dos-Santos AA & Rola FH (1997). Acute extracellular fluid volume changes increase ileocolonic resistance to saline flow in anesthetized dogs. Brazil-ian Journal of Medical and Biological Re-search, 30: 999-1008.
7. Brummermann M & Braun EJ (1995). Ef-fect of salt and water balance on colonic motility of white leghorn roosters. Ameri-can Journal of Physiology, 268: R690-R698.
8. Duffy PA, Granger DN & Taylor AE (1978). Intestinal secretion induced by volume expansion in the dog. Gastroenterology, 75: 413-418.
9. Levens NR (1985). Control of intestinal absorption by the renin-angiotensin sys-tem. American Journal of Physiology, 249: G3-G15.
10. Guyton A & Hall J (1996). Digestion and absorption in the gastrointestinal tract. In:
Textbook of Medical Physiology. 9th edn. W.B. Saunders, Philadelphia, Pennsylva-nia, 833-851.
11. Suzuki S, Khanchowdhury MR, Uemura N, Morita H & Hosomi H (1992). Renojeju-nal reflex controlling jejuRenojeju-nal absorption of fluid and NaCl. Journal of the Autonomic Nervous System, 39: 219-228.
12. Edin R, Lundberg J, Terenius L, Dahlstrom A, Hokfelt T, Kewenter J & Ahlmin H (1980). Evidence for enkephalergic neural control of the feline pylorus and stomach.
Gastroenterology, 78: 492-497.
13. Humphreys MH & Earley LE (1971). The mechanism of decreased intestinal so-dium and water absorption after acute blood volume expansion in the rat. Jour-nal of Clinical Investigation, 50: 2355-2367.
14. Rego MCV, Graça JRV, Gondim F de AA, Gondim RB de M, Dantas RP & Rola FH (1996). Role of proximal stomach and py-lorus on gastric emptying and gastrointes-tinal transit delays elicited by acute blood volume expansion in awake rats. Gut, 39 (Suppl 3): 214 (Abstract).
15. Miolan JP & Roman C (1978). Discharge of efferent vagal fibers supplying gastric antrum: indirect study by nerve suture technique. American Journal of Physiolo-gy, 235: E366-E373.
16. Fargeas MJ, Fioramonti J & Bueno L (1986). Central α-2 adrenergic control of the pattern of small intestinal motility in rats. Gastroenterology, 91: 1470-1475. 17. Ruwart MJ, Klepper MS & Rush BD
(1980). Clonidine delays small intestinal transit in the rat. Journal of Pharmacology and Experimental Therapeutics, 212: 487-490.
18. Bojo L, Nellgard P & Cassuto J (1992). Effects of selective adrenergic agonists and antagonists on gastric tone in the rat.
Acta Physiologica Scandinavica, 142: 517-522.
19. Trostel KA, Kata SA & Osborn JW (1991). Does the spinal cord generate function-ally significant sympathetic activity in the awake rat? American Journal of Physiolo-gy, 266: R1102-R1110.
20. Bayens DA, Walters JM & Vesely DL (1988). Atrial natriuretic factor increases the magnitude of duodenal spontaneous phasic contractions. Biochemical and Bio-physical Research Communications, 155: 1437-1443.