Validity of the
Community Periodontal Index
of Treatment Needs’
(CPITN) for population
periodontitis screening
Validação do Community Periodontal Index
of Treatment Needs’
(CPITN) para identificação
de periodontite em populações
1 Universidade Luterana do Brasil, Canoas, Brasil. 2 Centro de Pesquisas Epidemiológicas, Universidade Federal de Pelotas, Pelotas, Brasil. 3 Universidade Federal do Rio Grande do Sul, Porto Alegre, Brasil.
Correspondence D. G. Bassani Universidade Luterana do Brasil.
Rua Prudente de Morais 421, Novo Hamburgo, RS 93520-810, Brasil. [email protected]
Diego Garcia Bassani 1,2 Carina Maciel da Silva 1 Rui Vicente Oppermann 1,3
Abstract
The aim of the present study was to validate two versions of CPITN for periodontitis diagnosis. A sample of 400 individuals underwent full mouth periodontal examination including Clinical At-tachment Loss, Periodontal Pocket Depth, and Sub-gingival Calculus. Full and partial CPITN versions were derived from this exam (gold standard). Contingency tables were constructed and operational characteristics obtained, as well as ROC curves. The results show 58% sensi-tivity for full CPITN and 80.6% specificity. Posi-tive and negaPosi-tive predicPosi-tive values were 87% and 46.3%, respectively. According to the test, es-timated periodontitis prevalence was 46%, while the figure obtained with the gold stan-dard was 69%. The partial version of the CPITN showed 50% sensitivity and 87.1% specificity. Positive and negative predictive values were 89.6% and 43.9%, respectively. Estimated peri-odontitis prevalence, through partial CPITN, was 30.5%. Adjusted global agreement (kappa) for partial and full CPITN was 0.32 and 0.29, re-spectively. Both CPITN versions disagreed signif-icantly with gold standard results (chi-square p < 0.001). As a conclusion, both total and par-tial CPITN failed to reflect the real periodontal status of the sample.
Validation Studies; Periodontal Index; Periodon-titis
Background
Instruments for periodontitis screening are commonly applied to populations in epidemio-logical studies of oral health. Several tests or in-dexes have been developed for this purpose, mainly due to a growing impression of inade-quacy in the existing instruments. Another rea-son for the development of new instruments has been the search for efficient and simple ways to screen populations for periodontitis 1,2,3,4.
The criteria used for periodontitis diagno-sis vary greatly, but it is agreed that monitoring the attachment level is the most reasonable way to access activity of periodontal destruc-tion 5,6,7. Since it is known that the feasibility of repeated measurements in healthy popula-tions to assess periodontal disease progression is difficult, mainly due to economic, logistic, and statistical reasons, researchers are expect-ed to conductexpect-ed screening of periodontal dis-ease with the available instruments. Few in-struments available for periodontal screening have been validated against a standard exam, and the performance of these instruments for screening purposes is unpredictable when the disease status of the population is unknown.
pe-riodontal screening instruments may overesti-mate disease 6,8,14,15,16,17,18,19.
Operational characteristics of screening in-struments can be assessed by validation stud-ies. It is taken for granted that periodontal dis-ease varies considerably among populations 16,17,20,21,22and that severe limitations in the current disease descriptors exist 23,24,25. These points should be considered when evaluating data from studies describing the periodontal health status of populations through these in-struments.
The use of screening instruments for peri-odontitis is not questioned, although the ade-quacy of the instruments should be considered more carefully. Several authors have proposed short tests for periodontal screening 2,4,26,27. The Community Periodontal Index of Treatment Needs(CPITN) proposition in 1982 and the rapid acceptance of this instrument provided the sci-entific community with an enormous amount of epidemiological data collected through it. Based on the limitations identified by several authors during years of research, the World Health Organization ( WHO) proposed a few changes to the CPITN in 1987 and again in 1997. Nevertheless, the instrument’s diagnostic criteria were basically unaffected by the modifications. There is a lack of studies comparing CPITN to standard exams/diagnostic criteria. The pur-pose of the present study is to assess CPITN’s operational characteristics. Understanding the performance of the instrument and specifically the assessment of its sensitivity and specificity will improve interpretations of the disease prevalence rates estimated with the CPITN.
Methods
A cross-sectional study was performed in a small rural population in southern Brazil in-cluding individuals over 18 years of age for whom disease status was unknown. Full mouth examinations were performed from January to March 2000. To calculate a sample size that would allow all the necessary calculations of operational characteristics of the CPITN, sen-sitivity and specificity of the index were esti-mated in a pilot study including 50 randomly selected individuals from the same location. Sample size calculation was assessed and in-cluded an alpha error of 5%, 80% power, esti-mated sensitivity of 40%, and specificity of 80% (data from pilot study) and a 10-point margin of error. Two sample calculations were per-formed (one using sensitivity and another with specificity) and the largest sample size was
chosen. This number plus 20% for losses and refusals resulted in a sample size of 400.
Individuals were selected from a primarily rural population consisting of 4,600 individu-als. Individuals were selected according to avail-ability in local industries, public health cen-ters, public services, rural unions, high schools, the university, and commercial establishments. Inclusion criteria were: age ≥18 years; pres-ence of at least six natural teeth excluding third molars; and formal consent for participation. Four-hundred and fifty-seven individuals were examined. Fifty-seven individuals were exclud-ed for not meeting the minimum number of natural teeth. Table 1 shows the sample’s de-mographic characteristics.
A full periodontal examination was per-formed in a dental office using a standard man-ual periodontal probe (Newmar – Brazil). Data on probing depth and clinical attachment level was collected from six sites on every tooth pre-sent and registered on a chart by a trained team. The information was used to assess the individuals’ periodontal health, and diagnosis based on these data resulted in the gold stan-dard. For quality control, 10% of the exams were repeated randomly, and examiner agreement was consistent during the study. Periodontitis was determined as the presence of at least three sites, in different teeth, presenting three or more millimeters of clinical attachment level. Presence of gingival recession was considered and excluded for diagnostic purposes when present in buccal or lingual surfaces.
Periodon-Table 1
Demographic characteristics and periodontal health conditions of the sample.
Characteristics n Frequency (%)
Gender
Male 169 42.3
Female 231 57.8
Age (years)
18-35 246 61.5
36-59 124 31.0
> 59 30 7.5
Periodontitis
Absent 124 31.0
Mild 187 46.9
Moderate 72 17.8
titis was categorized as mild (3 sites/3mm-4.9mm), moderate (3 sites/5-6.9mm), and se-vere (3 sites/7mm or more). Intra-examiner agreement was assessed through the differences by means plot 28.29. This analysis revealed that more than 95% of the observations were be-tween ± 2 standard deviations consistently throughout the study set.
The CPITN 4 diagnosis and diagnosis from its reduced version – partial CPITN 26 – were derived from the full exam using criteria pro-posed by Ainamo & Ainamo 30and Diamanti-Kipioti et al. 26, respectively. Partial CPITN in-cluded the examination of 10 index teeth (17, 16, 11, 26, 27, 36, 37, 31, 46, 47), when present, for the evaluation of the sextant’s score. In the absence of the index teeth, all teeth in the sex-tant were examined to generate the score, as in the original CPITN. Contingency tables were constructed to assess sensitivity, specificity, predictive values, likelihood ratios, and test-es-timated prevalence (prevalence estest-es-timated by the instrument). Stratification by age groups, disease severity, and gender was conducted. Consistency and coherence of the dataset was systematically evaluated prior to data analy-sis until a previously determined pattern was achieved.
Data were entered using Epi Info 6.0 (Cen-ters for Disease Control and Prevention, Atlan-ta, United States) and analyzed using Inter-cooled Stata version 7.0 (Stata Corporation, College Station, United States).
Results
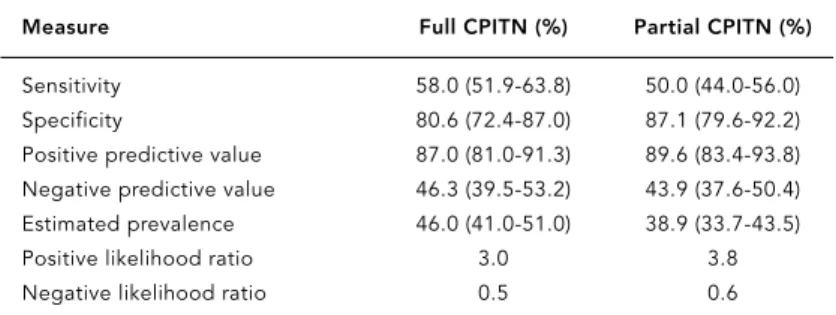
Periodontal disease prevalence in the sample was 69% (gold standard). The screening tests operated similarly. The following measurements are percent values with the respective 95% con-fident intervals. The original CPITN’s 4 sensitiv-ity was 58% (51.9%-63.8%), and specificsensitiv-ity was 80.6% (72.4%-87%). Positive predictive value reached 87% (81%-91.3%). Periodontitis preva-lence according to the original CPITN was 46%. The difference between the actual prevalence of disease in the sample and that estimated through the test was 23 percentage points. The odds of a positive test in a diseased individual was 3.0, having a healthy individual as the ref-erence (likelihood ratio = 3.0). The reduced CPITN version had a sensitivity of 50% (44%-56%) and specificity of 87.1% (79.6%-92.2%). Positive predictive value for the reduced ver-sion was 89.6% (83.4%-93.8%). Periodontitis prevalence estimated through the partial CPITN was 30.5 percentage points lower than the
mea-sured prevalence. The odds of a positive test in a diseased individual was 3.8, having a healthy subject as the reference (likelihood ratio = 3.8). Table 2 presents these data in details.
Figure 1 shows the ROC curves for both ver-sions evaluated herein. The full CPITN appears to have performed slightly better then the par-tial CPITN. The areas under the curves are sta-tistically equal according to the test of equality for areas under ROC curves (p = 0.605).
When the operational characteristics of the CPITN were evaluated according to different cutoff points of disease severity, the best bal-ance between sensitivity and specificity ap-peared in the moderate category (Figures 2 and 3). This assumption is based on the largest area under the ROC curves. The best sensitivity val-ues were observed for the severe cutoff point both for the full and partial CPITN. On the oth-er hand the highest specificity values woth-ere ob-served for the mild cutoff for both versions of the instrument.
Discussion
Periodontitis severity and prevalence in this sample were similar to the values observed in similar populations, although the present study used a convenience sample 17,31,32which could have influenced the predictive values but not the sensitivity and specificity if the prevalence was artificially modified by selection bias. The use of probing depth as the clinical parameter for diagnosis in some studies may account for some of the variability. This aspect has been previously discussed by several authors 2,6,24,25, 26,33,34. Most periodontitis screening studies
Table 2
CPITN (Community Periodontal Index of Treatment Needs) operating characteristics for the full sample, and 95% confidence intervals.
Measure Full CPITN (%) Partial CPITN (%)
Sensitivity 58.0 (51.9-63.8) 50.0 (44.0-56.0) Specificity 80.6 (72.4-87.0) 87.1 (79.6-92.2) Positive predictive value 87.0 (81.0-91.3) 89.6 (83.4-93.8) Negative predictive value 46.3 (39.5-53.2) 43.9 (37.6-50.4) Estimated prevalence 46.0 (41.0-51.0) 38.9 (33.7-43.5) Positive likelihood ratio 3.0 3.8 Negative likelihood ratio 0.5 0.6
using the probing depth as the main clinical parameter have shown overestimated preva-lence measures 2,6,24,33,34. The main clinical pa-rameter accounted for the periodontitis diag-nosis through the CPITN is probing depth. This may be the most reasonable explanation for the operational characteristics observed. The low values for sensitivity (58%) result in a high rate of false negative values and consequently are not suitable for exclusion diagnosis. Al-though the specificity values reached higher
scores (80.6%), increasing the odds of identify-ing a non-diseased individual under a negative test, for screening purposes higher sensitivity values are desirable, due to the goal of identify-ing disease rather than non-disease. The bal-ance between sensitivity and specificity was at-tained when the cutoff point was set at moder-ate. The highest values of sensitivity were ob-tained when the cutoff point was set at the se-vere disease status (82.4%). This apparently reasonable performance leaves room for an
1.00
0.75
0.50
0.25
0.00
sensitivity
0.00 0.25 0.50 0.75 1.00 1 – specificity
Full CPITN – ROC area: 0.6931 Partial CPITN – ROC area: 0.6855
Figure 1
ROC curve for the full and partial CPITN (Community Periodontal Index of Treatment Needs).
1.00
0.75
0.50
0.25
0.00
sensitivity
0.00 0.25 0.50 0.75 1.00 1 – specificity
Mild ROC area: 0.6663 Severe ROC area: 0.5311
Moderate ROC area: 0.6385
Figure 2
even higher rate of false-negative results re-flected by the low specificity of the test (55.6%). The CPITN, to some extent, could be consid-ered a partial exam since the main clinical pa-rameter accounting for the diagnosis is the probing depth, and the attachment level is not considered in the diagnosis, although the WHO recommends its use concomitant to the CPITN application.
Underestimation of periodontitis prevalence was observed in the evaluation of other partial instruments published previously 1,3,24,35. Hunt 1reports an underestimation of periodontitis prevalence when performing half mouth ex-ams. Even the full CPITN version used in the present study, although examining all teeth, could be considered a partial instrument since the multiplicity of sites is not considered for the diagnosis when a single score is applied for each sextant.
Diamanti-Kipioti et al. 26 compared the CPITN to a full exam and reported underesti-mation of sextants presenting scores higher than four and also of the frequency of individ-uals presenting scores higher than four and number of deep pockets.
The trend for lower values observed for the partial version of the CPITN in the present study may reflect the fact that only ten teeth contribute to the diagnosis 26. The analysis of the operational characteristics of the instru-ments under different severities shows the best balance when the moderate level is chosen as the cutoff. This provides no advantage, since early stages of disease are not diagnosed and will account for an unidentified repressed de-mand in the years that follow the screening process. For screening purposes, the CPITN has been reported previously as having better suitability for severe disease diagnosis 30. The diagnosis provided by the instruments, when evaluated under the kappa statistics, shows the disparity between the two CPITN versions and the gold standard. It might not be accurate to compare periodontitis prevalence directly when measured by the instrument. Population data collected through the CPITN should be careful-ly interpreted, especialcareful-ly when drawing con-clusions in the field of descriptive periodontal epidemiology targeting public health strate-gies, service cost studies and service demand estimation.
Figure 3
ROC curve for partial CPITN (Community Periodontal Index of Treatment Needs) under different cutoff points.
1.00
0.75
0.50
0.25
0.00
sensitivity
0.00 0.25 0.50 0.75 1.00 1 – specificity
Mild ROC area: 0.6676 Severe ROC area: 0.5394
References
1. Hunt RJ. The efficiency of half-mouth examina-tions in estimating the prevalence of periodontal disease. J Dent Res 1987; 66:1044-8.
2. Carlos JP, Wolfe MD, Kingman A. The extent and severity index: a simple method for use in epi-demiologic studies of periodontal disease. J Clin Periodontol 1986; 13:500-5.
3. Hunt RJ, Fann SJ. Effect of examining half the teeth in a partial periodontal recording of older adults. J Dent Res 1991; 70:1380-5.
4. Ainamo J, Barmes D, Beagrie G, Cutress T, Martin J, Sardo-Infirri J. Development of the World Health Organization (WHO) community periodontal in-dex of treatment needs (CPITN). Int Dent J 1982; 32:281-91.
5. Gobel G, Merte K, Gangler P. Epidemiology, treat-ment needs and progression monitoring of peri-odontal disease in adults. Stomatol DDR 1987; 37:286-91.
6. Baelum V, Manji F, Wanzala P, Fejerskov O. Rela-tionship between CPITN and periodontal attach-ment loss findings in an adult population. J Clin Periodontol 1995; 22:146-52.
7. Fleiss JL, Turgeon L, Chilton NW, Listgarten MA. Statistical properties of some clinical measures of gingivitis and periodontitis. J Periodontol 1990; 61:201-5.
8. Baelum V, Fejerskov O, Manji F, Wanzala P. Influ-ence of CPITN partial recordings on estimates of prevalence and severity of various periodontal conditions in adults. Community Dent Oral Epi-demiol 1993; 21:354-9.
9. Gilbert GH, Heft MW. Periodontal status of older Floridians attending senior activity centers. J Clin Periodontol 1992; 19:249-55.
10. Miller NA, Benamghar L, Roland E, Martin G, Pe-naud J. An analysis of the Community Periodon-tal Index of Treatment Needs. Studies on adults in France. III – Partial examinations versus full-mouth examinations. Community Dent Health 1990; 7:249-53.
11. Muller HP, Heinecke A, Lange DE. The correlated binomial model in the analysis of clinical diag-nostic test parameters for recurrence of peri-odontitis. J Clin Periodontol 1994; 21:369-72. 12. Rams TE, Oler J, Listgarten MA, Slots J. Utility of
Ramfjord index teeth to assess periodontal dis-ease progression in longitudinal studies. J Clin Periodontol 1993; 20:147-50.
13. Sicilia A, Ainamo J, Noguerol B, Cobo J, Lucas V, Bascones A. Validity of partial systems of peri-odontal examination in epidemiological studies. Av Odontoestomatol 1990; 6:331-5.
14. Baelum V, Manji F, Fejerskov O, Wanzala P. Validity of CPITN’s assumptions of hierarchical occur-rence of periodontal conditions in a Kenyan pop-ulation aged 15-65 years. Community Dent Oral Epidemiol 1993; 21:347-53.
15. Bamjee Y, Chikte UM, Cleaton-Jones PE. Assess-ment of periodontal status and treatAssess-ment needs of a disabled population using the CPITN. SADJ 1999; 54:413-7.
16. Benigeri M, Brodeur JM, Payette M, Charbonneau A, Ismail AI. Community periodontal index of
Contributors
D. G. Bassani reviewed the literature, elaborated the protocol, coordinated field work, collected data, ana-lyzed data, and drafted the manuscript. C. M. Silva assisted the elaboration of the protocol, conducted field work, collected data, and assisted in drafting the manuscript. R. V. Oppermann supervised the litera-ture review, assisted in the elaboration of the proto-col, supervised the data analysis, and supervised and contributed to drafting of the manuscript.
Resumo
Visando validar duas versões do CPITN para o diag-nóstico de periodontite em estudos populacionais, 400 indivíduos foram submetidos a exames de perda de in-serção clínica, profundidade de sondagem e presença de cálculo subgengival. A versão parcial e completa do CPITN foi derivada deste exame e comparada com o mesmo (padrão-ouro). Tabelas de contingência foram elaboradas e obtiveram-se as características opera-cionais do CPITN. Os resultados mostram sensibilida-de sensibilida-de 58% e especificidasensibilida-de sensibilida-de 80,6% para a versão completa. Os valores preditivos positivo e negativo foram 87% e 46,3% respectivamente. A prevalência de periodontite estimada por esta versão foi 46% enquan-to que o valor de referência segundo o padrão-ouro foi 69%. A versão parcial demonstrou uma sensibilidade de 50% e uma especificidade de 87,1%. Os valores preditivos positivo e negativo foram, respectivamente, 89,6% e 43,9%. A prevalência estimada de periodontite foi 30,5%. A taxa global ajustada de concordância (kappa) para a versão parcial e completa foi, respecti-vamente, 0,32 e 0,29. Ambas as versões discordaram dos resultados do padrão-ouro (qui-quadrado p < 0,001). Ambas as versões do CPITN falharam em re-presentar o statusperiodontal da amostra.
treatment needs and prevalence of periodontal conditions. J Clin Periodontol 2000; 27:308-12. 17. Gjermo P, Bellini HT, Marcos B. Application of the
Community Periodontal Index of Treatment Needs (CPITN) in a population of young Brazilians. Community Dent Oral Epidemiol 1983; 11:342-6. 18. Grytten J, Holst D, Gjermo P. Validity of CPITN’s
hierarchical scoring method for describing the prevalence of periodontal conditions. Communi-ty Dent Oral Epidemiol 1989; 17:300-3.
19. Landry RG, Jean M. Periodontal Screening and Recording (PSR) index: precursors, utility and limitations in a clinical setting. Int Dent J 2002; 52:35-40.
20. Abdul-Kadir R, Yassin AT. Periodontal status (CPITN) of six-to fifteen-year-old west Malaysian aborigines (Proto-Malays). J Nihon Univ Sch Dent 1989; 31:612-8.
21. Miyazaki H, Shirahama R, Ohtani I, Takehara T, Shimada N, Pilot T. CPITN assessments in institu-tionalised elderly people in Kitakyushu, Japan. Community Dent Health 1991; 8:239-43. 22. Tanaka H, Abe Y, Ozaki Y, Shibata Y, Nishikado S,
Ikeda M, et al. Epidemiological study of peri-odontal disease. Mass examination in university students with CPITN. Nippon Shishubyo Gakkai Kaishi 1988; 30:1089-96.
23. Haffajee AD, Socransky SS, Goodson JM. Clinical parameters as predictors of destructive periodon-tal disease activity. J Clin Periodontol 1983; 10:257-65.
24. Kingman A, Loe H, Anerud A, Boysen H. Errors in measuring parameters associated with periodon-tal health and disease. J Periodontol 1991; 62:477-86.
25. Eley BM, Cox SW. Advances in periodontal diag-nosis. 1. Traditional clinical methods of diagno-sis. Br Dent J 1998; 184:12-6.
26. Diamanti-Kipioti A, Papapanou PN, Moraitaki-Tsami A, Lindhe J, Mitsis F. Comparative estima-tion of periodontal condiestima-tions by means of differ-ent index systems. J Clin Periodontol 1993; 20: 656-61.
27. Kawamura M, Fukuda S, Inoue C, Sasahara H, Iwamoto Y. The validity and reproducibility of an oral rating index as a measurement of gingival health care and oral hygiene level in adults. J Clin Periodontol 2000; 27:411-6.
28. Bland JM, Altman DG. Comparing two methods of clinical measurement: a personal history. Int J Epidemiol 1995; 24 Suppl 1:S7-14.
29. Bland JM, Altman DG. Statistical methods for as-sessing agreement between two methods of clini-cal measurement. Lancet 1986; 1:307-10. 30. Ainamo J, Ainamo A. Partial indices as indicators
of the severity and prevalence of periodontal dis-ease. Int Dent J 1985; 35:322-6.
31. Dini EL, Guimarães LO. Periodontal conditions and treatment needs (CPITN) in a worker popu-lation in Araraquara, SP, Brazil. Int Dent J 1994; 44:309-11.
32. Mengel R, Flores-de-Jacoby L, Bruchmann S, Zafiropoulos GG. Periodontal status in Rio de Janeiro city (Brazil). Dtsch Zahn Mund Kiefer-heilkd Zentralbl 1991; 79:285-92.
33. Baelum V, Papapanou PN. CPITN and the epi-demiology of periodontal disease. Community Dent Oral Epidemiol 1996; 24:367-8.
34. Miller NA, Benamghar L, Roland E, Martin J, Abt F. An analysis of the CPITN periodontal treatment needs in France. Community Dent Health 1987; 4:415-23.
35. Fleiss JL, Park MH, Chilton NW, Alman JE, Feld-man RS, Chauncey HH. Representativeness of the “Ramfjord teeth” for epidemiologic studies of gingivitis and periodontitis. Community Dent Oral Epidemiol 1987; 15:221-4.
Submitted on 16/Sep/2004