DOI: 10.1590/1808-057x201806230
* Article presented at the 13th Brazilian Finance Meeting, Rio de Janeiro, RJ, Brazil, July 2013.
Original Article
Underreaction to open market share repurchases *
,**
F. Henrique Castro1
https://orcid.org/0000-0001-7456-2354 Email: [email protected]
Claudia Yoshinaga2,3
https://orcid.org/0000-0002-7756-6083 Email: [email protected]
1 Universidade de São Paulo, Faculdade de Economia, Administração e Contabilidade, Departamento de Contabilidade e Atuária, São Paulo, SP,
Brazil
2 Fundação Escola de Comércio Álvares Penteado, Departamento de Administração, São Paulo, SP, Brazil
3 Fundação Getulio Vargas, Escola de Administração de Empresas de São Paulo, Departamento de Administração, São Paulo, SP, Brazil
Received on 07.31.2017 – Desk acceptance on 09.29.2017 – 3rd version approved on 02.01.2018
Ad Hoc Associate Editor: Wesley Mendes-da-Silva
ABSTRACT
This article aims to investigate the long-term performance of a portfolio of firms that announced the repurchase of their own stocks in the Brazilian market from 2003 to 2014. Open market stock repurchase is a means to distribute cashflow to shareholders. Some of the reasons for a firm to buy back its own stocks are: to adjust its capital structure; to reduce excessive cash levels; as an alternative to dividends; and signaling to the market in order to reduce information asymmetry between the firm and its investors. If the signaling hypothesis is true, then forming a portfolio with shares that announce repurchases generates abnormal returns in the long run. Our results show that repurchase announcements in the open market signal stock underpricing, and abnormal returns can be earned using this strategy. Results are inconsistent with the semi-strong form of the efficient markets hypothesis, which states that one cannot earn abnormal returns with publicly available information. We obtained abnormal returns using the capital asset pricing model (CAPM) and Fama and French three-factor model. Additionally, we divided the sample in growth and value firms. We found that the average abnormal return for firms that announce repurchase programs ranges from 5.4% to 7.9% for up to a 3-year period after the announcement. For value companies (more likely to repurchase stocks due to undervaluation), abnormal returns can reach up to 11.5% per year.
Keywords: open market stock repurchase, abnormal returns, information, underreaction, long-term returns.
Correspondence address
F. Henrique Castro
Universidade de São Paulo, Faculdade de Economia, Administração e Contabilidade, Departamento de Contabilidade e Atuária Avenida Professor Luciano Gualberto, 908, Prédio FEA-3, Sala 243 – CEP: 05508-010
Cidade Universitária – São Paulo – SP – Brazil
** The authors gratefully acknowledge the financial support provided by the São Paulo Research Foundation (FAPESP), the National Council for Scientific and Technological Development (CNPq) and the Getulio Vargas Foundation’s GVPesquisa to the project that originated this study. The authors also acknowledge the blind reviewers at the Revista Contabilidade & Finanças, and Lucas Barros, Ariovaldo dos Santos, Paulo Terra, Orlando Vilar, Fábio Frezatti and attendees at the 13th Brazilian Finance Meeting, the Research Forum of the Graduate Controlling and Accounting
1. INTRODUCTION
A company can distribute cashflow to its shareholders by paying dividends or repurchasing part of its outstanding stocks. In stock repurchase, companies decide to use their cash resources to acquire their own stocks in the market. Stock repurchase programs are allowed in Brazil since 1976, by Laws No. 6385, of December 7, 1976 (1976) and No. 6,404, December 15, 1976 (1976). However, it was with the advance of time, the popularization of the financial market, and the Securities and Exchange Commission of Brazil (CVM) Instruction No. 299 (1999), that these repurchase programs began to gain attention in terms of the number of events announced and traded quantity.
In Brazil, two stock repurchase methods can be used. The first is tender offer (OPA), i.e., managers define the number of stocks the company intends to repurchase, the offer expiration date and the price it intends to pay. This method is used, among other reasons, to delist a company, or for control acquisition or disposition. The second method, which is the subject of this study, consists of the repurchase by the company of its own shares in the open market. In this method, the company repurchases its shares in the market, like any investor, and is subject to a few legal restrictions, e.g., on total repurchase volume. Several reasons can explain a firm’s interest in buying back its own stocks: (i) the firm’s desire to adjust its capital structure (Hovakimian, Opler & Titman, 2001); (ii) its necessity to reduce excessive cash levels (Jensen, 1986); (iii) as an alternative to dividends payment (Grullon & Michaely, 2002); or (iv) signaling to the market in order to reduce information asymmetry between the firm and its investors (Vermaelen, 1981).
The market tends to consider the company’s stock repurchase announcement as a sign that managers believe its stocks are undervalued or, at least, not overvalued (Vermaelen, 1981). If investors believe that managers are better informed about the future prospects of their companies and that they act in the best interest of their shareholders, then the market will react favorably to the repurchase plan announcement, and the new stock price will likely reflect the true value of the new information.
Depending on investors’ interpretation of the event caused by the repurchase plan announcement, stock prices will adjust upwards or downwards. In efficient financial markets, firms’ stock prices reflect the general
consensus on all available information about the economy, the financial markets, and the company itself, i.e., that information is incorporated into stock prices. Therefore, if the interpretation made about the stock repurchase program is that shares are worth less than they should be, they will likely appreciate. Thus, if this new equilibrium price is actualized in a non-biased manner, there would be no wealth transfer between long-term shareholders and those who sold their stocks back to the company.
A pertinent question is whether the market correctly incorporates into prices the new information the company provides as it announces a stock repurchase program. If the market does so, then we will likely observe that prices after the announcement are unbiased and that the profitability to be achieved in the long run will not be higher than expected for the company’s risk level. Otherwise, if managers are right in making the repurchase decision, then these companies’ stocks will be a great investment for their long-term shareholders. This question is the main motivation for this study.
The international literature on stock repurchase has different approaches. The first one investigates the reasons that drive companies to conduct repurchase programs (Brav, Graham, Harvey & Michaely, 2005; Chan, Ikenberry & Lee, 2004; Dittmar, 2000). The second is formed by studies about the kinds of change occurring after the announcements, both in operational and financial terms (Bartov, 1991; Grullon & Michaely, 2004; Lie, 2005). There are also studies which test the profitability of investment strategies based on repurchase announcements or actual repurchases (Dittmar & Field, 2015; Ikenberry, Lakonishok & Vermaelen, 1995, Ishikawa & Takahashi, 2011, Yook, 2010). This article falls under this last strand.
own shares showed abnormal annual returns ranging from 5.4 to 7.9% for investment horizons in a one- to three-year calendar-time strategy. In the year prior to the repurchase program announcements, the same portfolios did not show abnormal returns statistically different from 0, indicating that abnormal positive returns only occurred after the announcements. These results are in line with Ikenberry et al. (1995), who found abnormal annual returns of 4% using a similar portfolio-building strategy with data from announcements of companies in the U.S. market. In addition, using Canadian data, Ikenberry et al. (2000) found abnormal annual returns ranging from 7.3 to 8.7%.
Value companies are more likely to have undervalued stocks (Dittmar, 2000; Zhang, 2005). Therefore, these companies would be more likely to show superior performance in the long run. By separating firms in two groups, i.e., value and growth, we found evidence that corroborates this argument. Zhang (2005) found that a portfolio of value companies in the Hong Kong market which repurchased their own stocks generated positive
abnormal returns compared to a portfolio of companies that were similar in terms of size and book-to-market ratio, but did not repurchase. We also compared the abnormal returns of value and growth firms against control portfolios for each of these two groups and found that the abnormal returns of value-type firms were significantly higher than the control sample. We did not find the same result for growth-type companies.
This study is the first to measure long-term abnormal returns for an investment strategy with companies that announced stock repurchase programs in the Brazilian market. We intend to fill a gap by examining whether the managers of listed companies in Brazil who made the decision to announce stock repurchase programs were signaling to the market that their stocks were undervalued. The remainder of this article is organized as follows: Section 2 presents an overview of stock repurchases in Brazil, Section 3 describes the methodology used in the study, Section 4 presents and discusses the study’s findings, and Section 5 concludes the article.
2. STOCK REPURCHASE IN BRAZIL
2.1 Types of Stock Repurchase
In Brazil, there are two stock repurchase methods: tender offer (OPA) and stock repurchases in the open market. An OPA is sometimes called a ‘fixed-price tender’. It is an operation where management defines the number of stocks it intends to repurchase, the offer expiration date and the offer price, which is usually set at a premium in relation to the current market price. This instrument is mandatory in the following cases: company delisting (when it becomes privately traded); to increase the controlling shareholder’s stake in the equity of a public company; or for disposition of control. It can be voluntarily used to acquire stocks issued by another public company or to acquire its control. An OPA can also be of the parallel type, i.e., made by a third party other than the offeror or person related to it and concerning stocks covered by an OPA that has already been filed for registration with the CVM, or by a registration-exempt OPA in progress. An OPA will mandatorily include an appraisal report.
The second method, i.e., open-market share repurchase, is the object of this study. It is an operation in which the company buys back its own stocks in the stock market, like any ordinary investor. By repurchasing, the company acquires stocks to keep in its own treasury in order to retire (cancel) them or for later disposition. The acquisition, pursuant to CVM Instruction No. 10 (1980), is prohibited when it: (i) causes a decrease in the firm’s equity; (ii) requires using funds greater than the amount in the balance of profits and available reserves according to the last balance sheet; (iii) creates, by action or omission, directly or indirectly, artificial conditions of stock demand, supply or price, or involves unfair practices; (iv) involves unpaid stocks or stocks owned by the controlling shareholder; and (v) when a tender offer is in progress.
be traded. Disclosure to the market is made through a material fact, and the company must specify at least the following information: (i) the company’s purpose in the operation; (ii) the amount of stocks to be acquired or disposed; (iii) the deadline for conducting the authorized transactions – which may not exceed 365 days; (iv) the number of outstanding stocks, pursuant to the instruction; (v) name and address of the financial institutions that will be the intermediaries.
The stocks’ acquisition price may not be above the market price, so as to prevent price manipulation. The amount of stocks held in treasury by the company may not exceed 10% of each class of stocks outstanding, and this percentage includes shares held in treasury by subsidiaries and affiliates. This restriction is meant to avoid manipulation in stock demand and liquidity. The company that announces a stock repurchase program is not obliged to buy back the amount announced. It may purchase part of it or even none at all, without any penalty.
2.2 Legislation
It was not until 1976 that it became possible for companies in Brazil to repurchase their own stocks in the market. Law No. 6385, of December 7, 1976 (1976), which regulates the securities market and creates the CVM, gave this agency the jurisdiction to issue regulations applying to publicly traded companies on stock repurchase and treasury stock disposition [pursuant to Decree No. 3995, of October 31, 2001 (2001)]. Law No. 6404, of December 15, 1976 (1976) establishes, among others, the possibility for companies to acquire their own shares to keep them in treasury, retire them, or for later disposition. This law also extends to any company the right to repurchase their own shares, hitherto restricted to authorized capital companies, according with Law No. 4728, of July 14, 1965 (1965).
However, it was not until CVM Instruction No. 10 (1980) that the subject of stock repurchase was treated more specifically. This instruction sets the limit for the amount of stocks that may be held in treasury, a limit which was more recently altered by CVM Instruction No. 268 (1997), which established that treasury stocks may not exceed 10% of each class of stocks outstanding. CVM Instruction No. 390 (2003) alters CVM Instruction
n. 10 (1980) with regard to the trading of stocks by the same public companies that issued them, by means of transactions involving options.
CVM Instruction No. 299 (1999) regulates information disclosure both on the disposition of controlling shares of stock and growth in the stakes of controlling shareholders, managers or audit board members. It adds rules on the trading by companies of their own stocks, as well as on tender offers. According to Gabrielli and Saito (2004, p. 63), “before CVM Instruction No. 299 (1999) was issued, the market used to punish companies that repurchased their own shares and, after it was issued, the market began to evaluate positively the companies that announced stock repurchase programs”.
The results of the study by Gabrielli and Saito (2004) showed that the cumulative abnormal returns were positive and significant after CVM Instruction No. 299 (1999) was issued. Before, stocks showed an average of total accumulated losses of almost 10% within 45 days of the repurchase announcement. This instruction hindered the so-called “informal delisting”, i.e., the gradual purchase of stocks from minority shareholders. This meant that the remaining outstanding stocks lost liquidity, leaving minority shareholders no choice but to sell their stakes at low prices. However, CVM Instruction No. 299/1999 was revoked by CVM Instruction no. 361 (2002). The latter was updated by CVM Instructions No. 436 (2006), No. 480 (2009) and No. 487 (2010), which dealt primarily with OPA rules and procedures.
2.3 Why Do Companies Repurchase Their Own Stocks?
There are several known reasons for a company to make the decision of repurchasing its own shares in the market. The reasons covered in this section are not mutually exclusive, and a company may launch a stock repurchase program for combined reasons.
2.3.1 Capital structure adjustments.
If the company is not satisfied with its capital structure, i.e., if it feels the relationship between third-party stakes and its own is not adequate, it may choose to buy back its stocks in the market. When the company withdraws part of its equity from the market, it increases its degree of financial leverage. However, effects on the degree of leverage of companies will not be perceptible unless the buyback takes place via an OPA. This is because in an open-market buyback, the company is subject to repurchase limits that cause the repurchase to occur in very small amounts, which hardly changes the level of indebtedness. Only a long-term sequence of stock buyback programs could lead to significant changes in the company’s financial leverage.
2.3.2 Reducing agency costs on free cash flows.
The companies that run the greatest risk of overinvesting (or making investments that are beneficial to management, to the detriment of shareholders) are the ones with greatest excess of resources, particularly cash. According to Easterbrook (1984) and Jensen (1986), one way to prevent management from improperly using cash flows is to return the money to shareholders, either by paying dividends or repurchasing outstanding shares.
According to Li e McNally (2007), the companies that are most likely to repurchase their own stocks are the ones with the highest level of free cash flows, lowest market-to-book ratio, worst stock price performance, and the ones whose insiders have the greatest stakes. In Brazil, Mota (2007) found that the largest companies, least concerned with corporate governance, which distribute the largest amounts of dividends and have the greatest liquidity, are the ones that conduct buyback programs most.
2.3.3 Dividend substitution.
The results of the study of Grullon and Michaely (2002) showed that stock repurchases came to use the resources that used to serve to increase the value of the distributed dividend. Their figures show that dividend payout rate declined from 21.4% in 1972 to 11.4% in 2000, and that the part of the profit used for stock repurchases rose from 2.8% in 1972 to 12.4% in 2000. These figures show an increase in stock repurchase, while maintaining shareholder cash distribution rate relatively constant. These results corroborate the hypothesis of dividend substitution.
2.3.4 Signaling.
The information asymmetry between management and investors may cause stock prices to fail to accurately reflect the good news about a company’s future prospects. Thus, its market value will be traded below what is deemed to be its fair value. According to Grullon and Ikenberry (2000), managers could try to eliminate this discrepancy by informing investors of the good news they have about their companies’ future prospects (e.g., concerning the companies’ ability to generate future cash flows, increase profitability, etc.). However, mere announcements may not be very reliable. In that case, the company needs to send signals that reinforce this optimism, and one way of providing this signaling is by purchasing its own stocks in the market.
According to this hypothesis, companies that announce the repurchase of their own shares should experience future increases in indices such as profitability and cash flow generation. Vermaelen (1981) and Dann, Masulis, and Mayers (1991) tested this hypothesis using a sample of stock repurchases via fixed-price tender and found evidence of positive abnormal annual profits in the years following the stock repurchases. Hertzel and Jain (1991) found that analysts revised their profit per share forecasts upwards after stock repurchase announcements. Lie and McConnell (1998) used samples of announcements of repurchase via fixed-price tender and Dutch auction, and found that in both cases, the companies’ future profits increased following the announcement. Additionally, the authors found no significant difference between increases for either offer type.
According to Grullon and Ikenberry (2000), indeed, research using announcements of stock repurchase via fixed-price tender ought to find significant increases in these companies’ operating performance. This is because this type of offer represents a stronger commitment to distribute cash as well as a willingness to pay a premium on the share price. All this makes this signaling to the market quite powerful.
was obtained by Grullon and Michaely (2004), who found a reduction in companies’ profits and profitability after their open-market repurchase announcements. Lie (2005) found results suggesting that, rather than repurchase announcements, it is the repurchases themselves that make good indicators of future performance improvement.
Another reason for signaling is when the company believes the market is not evaluating the public information available properly. To test this hypothesis, Ikenberry et al. (1995) examined the long-term performance of securities of companies that announced open-market share buyback programs from 1980 to 1990 in the United States. They found that if an investor bought and held stocks of these companies in his portfolio for a four-year period, he would have an average abnormal return of 12.1% accumulated for the period. This result is consistent with the hypothesis that such firms were undervalued by the market at the time they announced
the share buyback program. In a later study, Ikenberry et al. (2000) looked at open-market stock repurchase announcements in Canada and, again, found abnormal positive returns of 7% per year for an investment in these companies during a three-year period.
Yook (2010) compares the performance improvement of companies following fixed-price tenders and open-market repurchases and finds evidence of abnormal returns in both cases, both for the announcement month and the following 36 months. Consistent with the hypothesis that a fixed-price tender is a more powerful signaling, this method showed a higher return than open-market repurchases by approximately 0.20% per month for the following 36 months. Ishikawa and Takahashi (2011) used Japanese data and a sample also formed by the two types of repurchases and found results that corroborate the hypothesis that managers at these companies are well informed and/or adept in identifying pricing errors in the market.
3. METHODOLOGY
3.1 Sample and Data
The announcements of open-market repurchase programs that form this study’s sample were manually collected from the CVM information base. The announcements were extracted from the minutes of board meetings of, or material fact disclosures by the companies listed on the Brazilian stock exchange from January 2003 to December 2014. We used all the open-market repurchase announcements aimed at repurchasing at least 5% of outstanding shares in order to eliminate repurchase programs of smaller quantities, which are generally associated with executive stock compensation. We defined the announcement date as the date of registration of the repurchase program with the CVM, since, under CVM Instruction n. 10 (1980), the board of directors’ decision to authorize the acquisition of shares must be immediately reported to the CVM and the stock exchange where the company’s securities are traded.
The monthly data for stock return rates were calculated based on prices collected from the Economatica® system. Corporate accounting information was also obtained from the same system. Table 1 shows the distribution
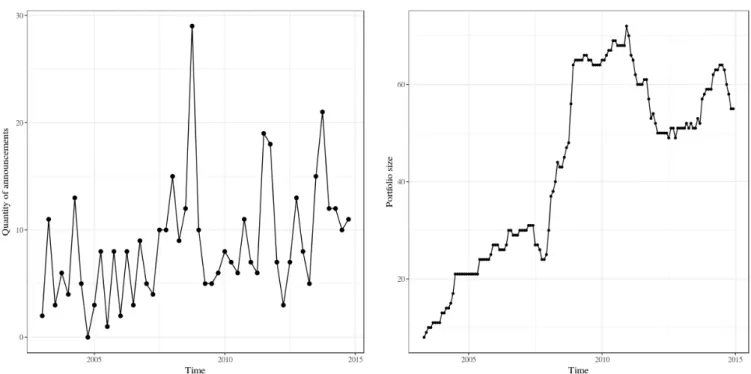
of repurchase announcements by year and quarter, as well as the average repurchase percentage announced in relation to total outstanding shares. Over the 12 years analyzed, the companies announced, on average, repurchases of 8.94% of outstanding shares. We can see that the number of announcements from 2003 to 2014 varies little, but there was a peak in 2008, when 15.8% of the announcements forming our sample were made. A large number of announcements were made in the fourth quarter of 2008, shortly after the height of the subprime crisis (Figure 1A). Quarterly data shows that companies usually make more announcements in the fourth quarter of each year, and fewer announcements in the first quarter.
Table 1
Descriptive statisticsof the announcements of open-market stock repurchase
Source: Prepared by the authors.
3.2 Portfolio Building
Studies conducted in Brazil with stock repurchase announcements examine what happens to short-term returns in the days following the companies’ announcements (Gabrielli & Saito, 2004; Lima et al., 2012; Moreira, 2000). In order to examine the long-term performance of a strategy based on repurchase announcements in the Brazilian market, we formed a value-weighted portfolio and gradually added companies as they made their announcements. The firms’ shares were added to the portfolio at the beginning of the month following the announcement and were held for 36 months or until they stopped being traded in the stock exchange. The portfolio was rebalanced at the beginning of each month. This approach forms a series of monthly returns produced in a chronological or calendar succession, hence the term ‘calendar time approach’. It has been used by Ikenberry et al. (1995, 2000), Mitchell and Stafford (2000), among others, to examine abnormal long-term returns after corporate events such the object of our study, i.e., stock repurchase announcements.
Barber and Lyon (1997) and Kothari and Warner (1997) show evidence that calculating abnormal long-term returns using buy-and-hold abnormal returns (BHAR) strategies can produce biased estimates. The bias arises, among other reasons, because BHAR tend to be significantly asymmetric on the right, due to the rebalancing of the benchmark portfolio, or because of the companies in the sample. Fama (1998) recommends building a portfolio based on calendar time, especially because when one builds a portfolio, all cross-correlations of firms’ abnormal returns are considered in the portfolio’s variance matrix. Over time, new companies enter the portfolio, just as others may leave it. This causes the number of firms in the portfolio to vary over the period. In some months, particularly at the beginning of the period studied, the portfolio might have just a few stocks. Thus, in order to reduce the impact caused by idiosyncratic noise, we excluded the months in which the portfolio contained stocks of less than eight companies. From May 2003, the portfolio already had eight assets. Over time, it grew to a peak of 72 assets in December 2010, when it began to decline in size, and closed the period analyzed with 55 assets in December 2014 (Figure 1B).
T n.
Average of Announcements
(%)
Quarterly (n)
1 2 3 4
2003 22 8.93 2 11 3 6
2004 22 8.97 4 13 5 0
2005 20 8.45 3 8 1 8
2006 22 9.07 2 8 3 9
2007 29 9.51 5 4 10 10
2008 65 9.03 15 9 12 29
2009 26 9.30 10 5 5 6
2010 32 9.35 8 7 6 11
2011 50 9.12 7 6 19 18
2012 30 8.99 7 3 7 13
2013 49 8.37 8 5 15 21
2014 45 8.49 12 12 10 11
Figure 1 Announcements of open-market stock repurchase by quarter
A: the fourth quarter of 2008 has the greatest number of repurchase announcements in the sample, probably due to the subprime crisis; B: the size of the portfolio increases over time, but it has a significant surge during 2008 due to the crisis. The portfolio peaks (72 stocks) in December 2010.
Source: Prepared by the authors.
In addition to the three-year period, we calculate the returns for other investment horizons, including year 1, year 2 and year 3 after the announcement date. For example, the Year 1 portfolio includes all companies that made an announcement in the previous 12 months. This allowed analyzing the possible abnormal return in different windows. We also calculated the returns for year -1 to see whether the portfolio already generated abnormal returns before the announcement was made. This was meant to rule out the hypothesis that the portfolio generated abnormal returns even before the repurchase program announcement.
3.3 Portfolio Performance Measurement
We estimated abnormal performance initially by using the Sharpe-Lintner CAPM (Sharpe, 1964; Lintner, 1965).
The series of monthly excess returns for the portfolio of stocks of companies that announced a repurchase was regressed against the excess returns for the market portfolio:
where Rp,t is the monthly return rate for the stock portfolio on date t, Rf,t is the risk-free rate measured as the 30-day DI swap on date t and RM,t is the monthly return rate for the market portfolio measured by the Bovespa Index (Ibovespa) on date t. The abnormal return is measured by α.
We also used the Fama and French (1993) three factor model to calculate abnormal return α:
1
𝑅𝑅�,�− 𝑅𝑅�,� = 𝛼𝛼 + 𝛽𝛽��𝑅𝑅�,�− 𝑅𝑅�,�� + 𝜀𝜀�
2
𝑅𝑅�,�− 𝑅𝑅�,� = 𝛼𝛼 + 𝛽𝛽��𝑅𝑅�,�− 𝑅𝑅�,�� + 𝛽𝛽���𝐻𝐻𝐻𝐻𝐻𝐻�+ 𝛽𝛽���𝑆𝑆𝐻𝐻𝑆𝑆� + 𝜀𝜀�
where factors HMLt and SMBt are, respectively, factors high minus low and small minus big on date t. Factor HML is the return rate for a portfolio that is long on stocks with a high book-to-market ratio and short on stocks of companies with a low book-to-market ratio. Factor SMB is the return rate for a portfolio that is long
on stocks with a low market value and short on stocks of companies with a high market value. These factors were extracted from the University of São Paulo’s Center for Research in Financial Economics (NEFIN-FEA-USP) website (http://www.nefin.com.br/).
,
4. RESULTS
4.1 General Case
Table 2 shows the results of the investment strategy for the value-weighted portfolio formed by companies that made open-market repurchase announcements. Strategy performance was measured using CAPM (Panel A) and the Fama and French (1993) three-factor model (Panel B). Assuming that the investor will buy the shares in the month following the repurchase announcement and will hold them in his portfolio for the next three years, CAPM indicates a positive abnormal return of 0.617% per month (t = 2.74), significant at 1%. Assuming that the investor will hold the asset for two years, the abnormal return would be lower, i.e., 0.441% per month (t = 1.83), and only significant at 10%. The abnormal returns are positive and significant for each of the 1-year periods after the announcement.
After controlling for size and book-to-market ratio in a three-factor model, results are qualitatively similar. The abnormal return observed for each of the three years is positive and significant, and so are the abnormal returns for the two- and three-year windows. The similarity between the abnormal returns calculated by one- and three-factor models is not unexpected. It is mainly due to the fact that additional factors are not, as a rule, statistically significant in Brazil (Machado & Medeiros, 2011; Noda, Martelanc & Kayo, 2016). In addition, the SMB factor had a very low premium in the sample used, i.e., approximately -0.55% per year. The premium for the HML factor was higher, i.e., 3.77% per year, but lower than the average market premium of 4.15% per year.
Previous evidence (Ikenberry et al., 2000; Yook, 2010) has documented that repurchase announcements are associated with negative abnormal returns for the months immediately prior to the announcement. This result was not observed in this study. The abnormal return for the year immediately prior to the announcement date did not show statistical significance.
For robustness, we calculated the abnormal return through four- and five-factor models, using Carhart’s (1997) winners minus losers factor and Amihud’s (2002) illiquid minus liquid factor. In both cases, results did not change qualitatively. In the four-factor model, we obtained an abnormal return of 0.733% per month (t = 3.13) for the three-year horizon, and 0.545% per month (t = 2.17) for the two-year horizon. Abnormal returns were positive and statistically significant for each of the
three years in the investment window. In the five-factor model, the abnormal return was 0.716% per month (t = 3.05) for the three-year window, and 0.520% per month (t = 2.07) for the two-year window. Abnormal returns were also positive and significant for each of the three years separately. There was no case where the abnormal return for the 1-year window prior to the event was statistically significant.
We also analyzed the abnormal returns obtained by one-, three-, four- and five-factor models using portfolios built with the same stock weighting. Results remained qualitatively similar.
It is possible that the announcements made in the height of the subprime crisis, during the fourth quarter of 2008, derived from the widespread devaluation of assets rather than being related to company-specific information. To purge the effects of these announcements on abnormal return estimates, we eliminated the 29 repurchase announcements made during that period. Using CAPM, the abnormal return for the three-year horizon was 0.664% per month (t = 2.68). The abnormal return was also positive and significant for the two-year window, as well as for each individual year. There were no abnormal returns for the one-year window preceding the event. In the results for the three-factor model, the investment for the three-year window generated a positive abnormal return of 0.658% per month (t = 2.64). We also obtained abnormal returns for the two-year windows, as well as for each individual year. There were no abnormal returns for the one-year window preceding the event.
The results of ordinary least square regressions weighted equally each observed return for the portfolio of companies that announced repurchase programs, despite the number of announcements in each month. It is possible that the number of announcements is correlated with the returns for this portfolio (Gompers & Lerner, 2003). If that is the case, then we will have heteroscedasticity problems in the regression’s residuals. To correct this potential problem, we estimated regressions through weighted least squares, using the square root of the number of companies in the portfolio for each month for weighting. The t-statistics for the intercepts increased, but results in general did not change qualitatively.
announcements during the period studied and whose book-to-market and size values were similar to those of the repurchase sample. In order to select the control firms, all listed companies were separated in groups according to their position in relation to the thirds of the book-to-market variable, and then in relation to the thirds of the size variable. For each repurchase announcement in the sample, a control company was randomly selected from those belonging to the same group of companies with the same book-to-market and size characteristics in the announcement month.
According to results in Table 3, the control sample had no abnormal returns for any of the periods when measured by CAPM, and it showed a positive abnormal return at the 5% level only for year 3, when measured by the Fama and French (1993) three-factor model. All regressions in the table were estimated through weighted least squares, using the square root of the
number of companies in the portfolio for each month for weighting.
We also used CAPM and the three-factor model to test the difference between the abnormal returns calculated for the repurchase and control portfolios. When measured by CAPM, the abnormal return for the repurchase portfolio is significantly higher than that for the control portfolio at the 5% level for the first year after the announcement (estimate = 0.62% per month) and significant at the 10 % level for year 3 (estimate = 0.66% per month) and for the period from years 1 through 3 (estimate = 0.44% per month). Using the three-factor model, the abnormal return for the repurchase portfolio is significantly higher than that for the control portfolio at the 10% level in the first year after the announcements (estimate = 0.51% per month). Estimates were made through weighted least squares, using the square root of the size of the portfolios for each month for weighting.
Table 2
Abnormal long-term performance for the investment strategy based on announcements of open-market stock repurchase programs
Note: the portfolios were formed by companies that announced the repurchase of their own shares in the open market during the period from January 2003 to December 2014. Over time, assets entered and left the portfolio. For the “years 1 to 3” portfolio, assets were included at the beginning of the month immediately following the announcement month and were held for 36 months. Portfolios were also formed for years 1 to 2 (months 1 to 24), year -1 (months -12 to -1), year 1 (months 1 to 12), year 2 (months 13 to 24) and year 3 (months 25-36). The abnormal return was measured using CAPM and the Fama and French (1993) three-factor model:
The months in which the portfolio had less than eight assets were excluded from the analysis. The standard errors are presented in parentheses, just below the coefficient estimated.
*, **, ***: significant at the 10, 5 and 1% levels, respectively. Source: Prepared by the authors.
𝛂𝛂
𝛃𝛃𝐌𝐌
𝛃𝛃𝐇𝐇𝐇𝐇𝐇𝐇
𝛂𝛂
𝛃𝛃𝐌𝐌
𝛃𝛃𝐒𝐒𝐒𝐒𝐒𝐒
Year -1 Year 1 Year 2 Year 3 Years 1 to 2 Years 1 to 3
Panel A: Capital Asset Pricing Model (CAPM)
0.359 (0.262)
0.622*** (0.272)
0.544* (0.282)
1.098***
(0.288) 0.441* (0.241)
0.617*** (0.226) 0.909***
(0.043)
0.846*** (0.046)
0.965*** (0.049)
0.874*** (0.050)
0.891*** (0.041)
0.880*** (0.038)
R2 aj. 0.761 0.706 0.753 0.723 0.773 0.791
Panel B: Fama and French (1993) three-factor model
0.373 (0.259)
0.639** (0.271)
0.454* (0.274)
1.108*** (0.288)
0.446* (0.243)
0.617*** (0.227) 0.892***
(0.043)
0.825*** (0.048)
1.010*** (0.050)
0.879*** (0.054)
0.887*** (0.043)
0.879*** (0.040) -0.080
(0.062) (0.071)-0.054 (0.070)-0.030 (0.082)0.135 (0.064)-0.025 (0.060)0.016 0.128**
(0.053) (0.057)0.090 -0.201***(0.062) (0.066)0.022 (0.051)0.013 (0.048)0.013
R2 aj. 0.770 0.708 0.769 0.725 0.770 0.788
𝑅𝑅�,�− 𝑅𝑅�,� = 𝛼𝛼 + 𝛽𝛽��𝑅𝑅�,�− 𝑅𝑅�,�� + 𝜀𝜀�
𝑅𝑅�,�− 𝑅𝑅�,� = 𝛼𝛼 + 𝛽𝛽��𝑅𝑅�,�− 𝑅𝑅�,�� + 𝛽𝛽���𝐻𝐻𝐻𝐻𝐻𝐻� + 𝛽𝛽���𝑆𝑆𝐻𝐻𝑆𝑆� + 𝜀𝜀�
,
Table 3
Abnormal long-term return for the control portfolio
Note: the portfolios were formed by companies similar (in terms of book-to-market ratio and size) to those which announced the repurchase of their own shares in the open market from January 2003 to December 2014. Over time, assets entered and left the portfolio according to the same criteria as in the repurchase sample. The abnormal return was measured using CAPM and Fama and French (1993) three-factor model:
The months in which the portfolio had less than eight assets were excluded from the analysis. The standard errors are presented in parentheses, just below the coefficient estimated. The estimation method was weighted least squares, using the square root of the number of companies in the sample for weighting.
*, **, ***: significant at the 5, 1 and 0.1% levels, respectively. Source: Prepared by the authors.
4.2 Value vs. Growth
There can be many motivations for a company to announce an open-market share repurchase program. One of them is some degree of undervaluation of its stocks (underpricing). According to Ikenberry et al. (1995, 2000), many undervalued stocks have a high book-to-market ratio. Therefore, value-type companies would have undervaluation as their most important motivation to repurchase. Thus, one of the ways to determine whether undervaluation is a reason for announcing a repurchase program is to consider in the analysis the differences between companies’ book-to-market ratios.
To investigate the motivations for the announcements, we calculated for each company in the sample their book-to-market ratio for June each year. We assumed that in January of a given year, an investor can get information about the company’s book-to-market ratio for the middle of the previous financial year to classify it as a value or
a growth company. At the beginning of each year, the investor separates the companies in these two groups according to the value of their rates in relation to the market median. For each of the groups, we estimated the abnormal long-term returns for the stock portfolios. Table 4 shows the α estimates for the market-value-weighted portfolios. The values in parentheses are the estimates’ standard errors.
Value companies that announced repurchase programs had higher abnormal returns than growth companies for the different investment horizons. Differences were greatest for years 2 and 3. Results were essentially the same for CAPM and Fama and French (1993) three-factor model. We found no significant change using Carhart’s (1997) winners minus losers factor and Amihud’s (2002) illiquid minus liquid factor (tables not shown). Nor did results change when we used portfolios with the same weights for all stocks (tables not shown).
Year 1 Year 2 Year 3 Years 1 to 2 Years 1 to 3
0.016 (0.312)
0.153 (0.331)
0.400 (0.380)
0.213 (0.291)
0.257 (0.282) 0.827***
(0.053)
0.848*** (0.059)
0.764*** (0.069)
0.810*** (0.050)
0.782*** (0.049)
R2 aj. 0.638 0.622 0.518 0.657 0.649
0.220
(0.226) (0.284)0.439 (0.322)0.697* (0.208)0.353 (0.202)0.385 0.705***
(0.041) 0.710***(0.051) 0.674***(0.060) 0.696***(0.037) 0.672***(0.036) 0.533***
(0.049) 0.477***(0.064) 0.462***(0.072) 0.504***(0.045) 0.499***(0.043) 0.007
(0.061)
0.059 (0.076)
0.294** (0.093)
0.048 (0.056)
0.053 (0.055)
R2 aj. 0.804 0.723 0.670 0.820 0.821
𝛂𝛂𝐜𝐜
𝛃𝛃𝐜𝐜,𝐌𝐌
𝛃𝛃𝐜𝐜,𝐇𝐇𝐇𝐇𝐇𝐇
𝛃𝛃𝐜𝐜,𝐒𝐒𝐒𝐒𝐒𝐒 𝛂𝛂𝐜𝐜
𝛃𝛃𝐜𝐜,𝐌𝐌
𝑅𝑅�,�− 𝑅𝑅�,� = 𝛼𝛼�+ 𝛽𝛽�,��𝑅𝑅�,�− 𝑅𝑅�,�� + 𝜀𝜀�
𝑅𝑅�,� − 𝑅𝑅�,�= 𝛼𝛼�+ 𝛽𝛽�,��𝑅𝑅�,�− 𝑅𝑅�,�� + 𝛽𝛽�,���𝐻𝐻𝐻𝐻𝐻𝐻�+ 𝛽𝛽�,���𝑆𝑆𝐻𝐻𝑆𝑆�+ 𝜀𝜀�
,
Results show that both growth and value companies presented abnormal returns for the periods following the announcement. Among the possible reasons for growth companies to announce the repurchase of their own shares is, for example, an attempt to avoid profit dilution. For value companies, undervaluation can be a stronger reason. Value companies’ higher α values, particularly for years 2 and 3, confirm this hypothesis.
To analyze the robustness of results, we used control samples formed by companies similar (in terms of market-to-book ratio and size) to those that announced repurchase programs in order to estimate the difference between the abnormal returns for the repurchase
sample and the control sample. Using both CAPM and three-factor model, the repurchase sample’s abnormal returns were not statistically different from the control sample’s abnormal returns for growth firms. For value companies, the difference between abnormal returns for the repurchase sample and the control sample was positive and statistically significant at the 1% level for all estimation windows, the estimated difference being 1.8% per month for the three-year window – the three years following the announcement. Therefore, results corroborate that firms that announce a repurchase, particularly value firms, present positive abnormal returns for the months following the announcement.
Table 4
Abnormal long-term performance for an investment strategy of value vs. growth after announcements of open-market stock repurchase programs
Note: theportfolios were formed by companies that announced the repurchase of their own shares in the open market during the period from January 2003 to December 2014. Over time, assets entered and left the portfolio. For the “years 1 to 3” portfolio, assets were included at the beginning of the month immediately following the announcement month, and were held for 36 months. Portfolios were also formed for years 1 to 2 (months 1 to 24), year -1 (months -12 to -1), year 1 (months 1 to 12), year 2 (months 13 to 24) and year 3 (months 25-36). The abnormal return was measured using CAPM and Fama and French (1993) three-factor model:
The monthsin which the portfolio had less than eight assets were excluded from the analysis. Only values are shown in the table. The standard errors are presented in parentheses, just below the coefficient estimated.
*, **, ***: significant at the 10, 5 and 1% levels, respectively. Source: Preparedby the authors.
5. CONCLUSIONS
Financial theory says that a company’s decision to repurchase its own shares may be related to a number of factors, such as adjustments to its capital structure, reducing agency costs on free cash flows, as a substitute for dividend payment, as a means of signaling, among others.
This study found evidence that the Brazilian market does not react properly to the signs sent by open-market share repurchase announcements. Using an investment strategy with a horizon of up to three years and a portfolio with shares of companies that announced the repurchase
Year -1 Year 1 Year 2 Year 3 Years 1 to 2 Years 1 to 3
Panel A: Capital Asset Pricing Model (CAPM)
Growth (0.332)0.459 0.631**(0.306) (0.327)0.450 1.053***(0.323) (0.278)0.447 0.642**(0.259)
Value 0.526
(0.428)
0.912** (0.405)
0.959** (0.448)
1.836*** (0.535)
0.651* (0.362)
0.875** (0.360)
Panel B: Fama and French (1993) three-factor model
Growth (0.327)0.524 0.663**(0.305) (0.324)0.431 1.065***(0.327) (0.278)0.466* 0.659**(0.259) Value (0.413)0.395 0.909**(0.392) 0.954**(0.439) 1.919***(0.500) (0.346)0.621* 0.835**(0.334)
𝑅𝑅�,�− 𝑅𝑅�,�= 𝛼𝛼 + 𝛽𝛽��𝑅𝑅�,�− 𝑅𝑅�,�� + 𝜀𝜀�
𝑅𝑅�,�− 𝑅𝑅�,� = 𝛼𝛼 + 𝛽𝛽��𝑅𝑅�,�− 𝑅𝑅�,�� + 𝛽𝛽���𝐻𝐻𝐻𝐻𝐻𝐻�+ 𝛽𝛽���𝑆𝑆𝐻𝐻𝑆𝑆�+ 𝜀𝜀�
,
of their own shares, we found that annual abnormal returns ranged from 5.4 to 7.9%.
Among the possible reasons for a company to repurchase its own stocks is management’s perception that its stocks are undervalued in the market. To determine whether that is a plausible reason in the Brazilian market, the companies were divided in two groups according to their book-to-market ratios. Undervaluation is more likely to be a reason for high book-to-market companies (value companies) to repurchase. Several other reasons may be responsible for repurchase announcements by companies with a lower book-to-market ratio (growth companies). Portfolios formed by companies classified as value showed greater abnormal returns than those of
companies classified as growth for the different horizons analyzed. These results indicate that firms’ managers are well informed and/or adept in identifying pricing error opportunities in the market. Our findings are in line with those of Ikenberry et al. (1995, 2000) for the American and Canadian markets, and Ishikawa and Takahashi (2011) for the Japanese market.
Overall, this study presents evidence that announcements of open-market share repurchase programs provide reliable signs that the announcing company’s stocks are undervalued. Moreover, our results are inconsistent with the semi-strong form of the efficient markets hypothesis, which says that one cannot earn abnormal returns with publicly available information.
REFERENCES
Amihud, Y. (2002). Illiquidity and stock returns: cross-section and time-series effects. Journal of Financial Markets, 5(1), 31-56. Barber, B. M., & Lyon, J. D. (1997). Detecting long-run abnormal
stock returns: the empirical power and specification of test statistics. Journal of Financial Economics, 43(3), 341-372. Bartov, E. (1991). Open-market stock repurchases as signals for earnings and risk changes. Journal of Accounting and Economics, 14(3), 275-294.
Brav, A., Graham, J. R., Harvey, C. R., & Michaely, R. (2005). Payout policy in the 21st century. Journal of Financial Economics, 77(3), 483-527.
Carhart, M. M. (1997). On persistence in mutual fund performance. The Journal of Finance, 52(1), 57-82. Chan, K., Ikenberry, D., & Lee, I. (2004). Economic sources
of gain in stock repurchases. Journal of Financial and Quantitative Analysis, 39(3), 461-479.
Comissão de Valores Mobiliários. (1980). Instrução CVM 10, de 14 de fevereiro de 1980. Dispõe sobre a aquisição por companhias abertas de ações de sua própria emissão, para cancelamento ou permanência em tesouraria e respectiva alienação. Retrieved from http://www.cvm.gov.br/export/sites/ cvm/legislacao/instrucoes/anexos/001/inst010consolid.pdf. Comissão de Valores Mobiliários. (1997). Instrução CVM 268,
de 13 de novembro de 1997. Altera o limite previsto no art. 3º da Instrução 10/80. Retrieved from http://www.cvm.gov.br/ export/sites/cvm/legislacao/instrucoes/anexos/200/inst268. pdf.
Comissão de Valores Mobiliários. (1999). Instrução CVM 299, de 9 de fevereiro de 1999. Dispõe sobre divulgação de informações na alienação de controle acionário e no aumento de participação de acionistas controladores, administradores e membros do conselho fiscal, acresce regras relativamente à negociação de ações de própria emissão, e disciplina ofertas públicas para aquisição de ações. Retrieved from http:// www.cvm.gov.br/export/sites/cvm/legislacao/instrucoes/ anexos/200/inst299consolid.pdf.
Comissão de Valores Mobiliários. (2002). Instrução CVM 361, de 5 de março de 2002. Dispõe sobre o procedimento aplicável às
ofertas públicas de aquisição de ações de companhia aberta, o registro das ofertas públicas de aquisição de ações para cancelamento de registro de companhia aberta, por aumento de participação de acionista controlador, por alienação de controle de companhia aberta, para aquisição de controle de companhia aberta quando envolver permuta por valores mobiliários, e de permuta por valores mobiliários. Retrieved from http:// www.cvm.gov.br/export/sites/cvm/legislacao/instrucoes/ anexos/300/inst361consolidsemmarcas.pdf.
Comissão de Valores Mobiliários. (2003). Instrução CVM 390, de 8 de julho de 2003. Dispõe sobre a negociação, por companhias abertas, de ações de sua própria emissão, mediante operações com opções. Retrieved from www.cvm.gov.br/legislacao/ instrucoes/anexos/300/inst390consolid.doc.
Comissão de Valores Mobiliários. (2006). Instrução CVM 436, de 5 de julho de 2006. Acrescenta o Anexo III e altera a Instrução 361/02. Retrieved from http://www.cvm.gov.br/export/sites/ cvm/legislacao/instrucoes/anexos/400/inst436.pdf.
Comissão de Valores Mobiliários. (2009). Instrução CVM 480, de 7 de dezembro de 2009. Dispõe sobre o registro de emissores de valores mobiliários admitidos à negociação em mercados regulamentados de valores mobiliários. Retrieved from http:// www.cvm.gov.br/export/sites/cvm/legislacao/instrucoes/ anexos/400/inst480consolid.pdf.
Comissão de Valores Mobiliários. (2010). Instrução CVM 487, de 25 de novembro de 2010. Altera a Instrução 361/02. Retrieved from http://www.cvm.gov.br/export/sites/cvm/legislacao/ instrucoes/anexos/400/inst487.pdf.
Dann, L. Y., Masulis, R. W., & Mayers, D. (1991). Repurchase tender offers and earnings information. Journal of Accounting and Economics, 14(3), 217-251.
Decreto n. 3.995 (2001, 31 de outubro de 2001). Altera e acresce dispositivos à Lei nº 6.385, de 7 de dezembro de 1976, que dispõe sobre o mercado de valores mobiliários, nas matérias reservadas a decreto. Retrieved from http://www.planalto.gov. br/ccivil_03/decreto/2001/D3995.htm.
Dittmar, A., & Field, L. C. (2015). Can managers time the market? Evidence using repurchase price data. Journal of Financial Economics, 115(2), 261-282.
Easterbrook, F. H. (1984). Two agency-cost explanations of dividends. The American Economic Review, 74(4), 650-659. Fama, E. F. (1998). Market efficiency, long-term returns, and
behavioral finance. Journal of Financial Economics, 49(3), 283-306.
Fama, E. F., & French, K. R. (1993). Common risk factors in the returns on stocks and bonds. Journal of Financial Economics, 33(1), 3-56.
Gabrielli, M. F., & Saito, R. (2004). Recompra de ações:
regulamentação e proteção dos minoritários. RAE – Revista de Administração de Empresas, 44(4), 54-67.
Gompers, P. A., & Lerner, J. (2003). The really long-run performance of initial public offerings: the pre-NASDAQ evidence. The Journal of Finance, 58(4), 1355-1392. Grullon, G., & Ikenberry, D. (2000). What do we know about
stock repurchases? Journal of Applied Corporate Finance, 13(1), 31-51.
Grullon, G., & Michaely, R. (2002). Dividends, share repurchases, and the substitution hypothesis. The Journal of Finance, 57(4), 1649-1684.
Grullon, G., & Michaely, R. (2004). The information content of share repurchase programs. The Journal of Finance, 59(2), 651-680.
Hertzel, M., & Jain, P. C. (1991). Earnings and risk changes around stock repurchase tender offers. Journal of Accounting and Economics, 14(3), 253-274.
Hovakimian, A., Opler, T., & Titman, S. (2001). The debt-equity choice. Journal of Financial and Quantitative Analysis, 36(1), 1-24.
Ikenberry, D., Lakonishok, J., & Vermaelen, T. (1995). Market underreaction to open market share repurchases. Journal of Financial Economics, 39(2), 181-208.
Ikenberry, D., Lakonishok, J., & Vermaelen, T. (2000). Stock repurchases in Canada: performance and strategic trading. The Journal of Finance, 55(5), 2373-2397.
Ishikawa, M., & Takahashi, H. (2011). Testing the managerial timing ability: evidence from stock repurchases in Japan. Finance Research Letters, 8(1), 21-27.
Jensen, M. (1986). Agency cost of free cash flow, corporate finance, and takeovers. American Economic Review, 76(2), 323-329.
Kothari, S. P., & Warner, J. B. (1997). Measuring long-horizon security price performance. Journal of Financial Economics, 43(3), 301-339.
Lei n. 4.728, de 14 de julho de 1965. (1965, 16 de julho). Disciplina o mercado de capitais e estabelece medidas para o seu desenvolvimento. Retrieved from http://www2.camara. leg.br/legin/fed/lei/1960-1969/lei-4728-14-julho-1965-368255-norma-pl.html.
Lei n. 6.385, de 7 de dezembro de 1976. (1976, 9 de dezembro). Dispõe sobre o mercado de valores mobiliários e cria a Comissão de Valores Mobiliários. Retrieved from http://www. planalto.gov.br/ccivil_03/LEIS/L6385.htm.
Lei n. 6.404, de 15 de dezembro de 1976. (1976, 17 de dezembro). Dispõe sobre as Sociedades por Ações. Retrieved from http:// www.planalto.gov.br/Ccivil_03/leis/L6404consol.htm. Li, K., & McNally, W. (2007). The information content of
Canadian open market repurchase announcements. Managerial Finance, 33(1), 65-80.
Lie, E. (2005). Operating performance following open market share repurchase announcements. Journal of Accounting and Economics, 39(3), 411-436.
Lie, E., & McConnell, J. J. (1998). Earnings signals in fixed-price and Dutch auction self-tender offers. Journal of Financial Economics, 49(2), 161-186.
Lima, Á. V., Gratz, D., Silva, M. R., & Carvalho, F. A. A. (2012). Análise comparativa dos modelos de cálculo de retornos anormais com base no evento recompra de ações na
BOVESPA. Revista de Contabilidade do Mestrado em Ciências Contábeis da UERJ, 17(3), 24-40.
Lintner, J. (1965). The valuation of risk assets and the selection of risky investments in stock portfolios and capital budgets. The Review of Economics and Statistics, 47(1), 13-37.
Machado, M. A. V., & Medeiros, O. R. (2011). Modelos de precificação de ativos e o efeito liquidez: evidências empíricas no mercado acionário brasileiro. Revista Brasileira de Finanças, 9(3), 383-412.
Mitchell, M. L., & Stafford, E. (2000). Managerial decisions and long‐term stock price performance. The Journal of Business, 73(3), 287-329.
Moreira, L. F. (2000). A recompra de ações na BOVESPA (Master’s Thesis, Escola de Administração da Universidade Federal do Rio Grande do Sul, Porto Alegre).
Mota, D. C. (2007). Dividendos, juros sobre capital próprio e recompra de ações: um estudo empírico sobre a política de distribuição no Brasil (Master’s Thesis, Escola de
Administração de Empresas de São Paulo, Fundação Getulio Vargas, São Paulo).
Noda, R. F., Martelanc, R., & Kayo, E. K. (2016). The earnings/ price risk factor in capital asset pricing models. Revista Contabilidade & Finanças, 27(70), 67-79.
Sharpe, W. F. (1964). Capital asset prices: a theory of market equilibrium under conditions of risk. The Journal of Finance, 19(3), 425-442.
Vermaelen, T. (1981). Common stock repurchases and market signalling: an empirical study. Journal of Financial Economics, 9(2), 139-183.
Yook, K. C. (2010). Long-run stock performance following stock repurchases. The Quarterly Review of Economics and Finance, 50(3), 323-331.