Original Article
Artigo Original
Alessandra Spada Durante1 Margarita Bernal Wieselberg1 Sheila Carvalho1 Nayara Costa1 Beatriz Pucci1 Nicolly Gudayol1 Kátia de Almeida1
Descritores
Potenciais Evocados Auditivos Percepção de Fala Percepção Auditiva Auxiliares de Audição Eletroisiologia Keywords
Evoked Potentials, Auditory Cortical Potential Speech Detection Hearing Aids Electrophysiology
Correspondence address:
Alessandra Spada Durante Rua Dr. Cesário Mota Júnior, 61, 8º andar, São Paulo (SP), Brasil, CEP: 01221-020.
E-mail: [email protected]
Received: 19/03/2014
Accepted: 04/07/2014
Study carried out at the School of Medical Sciences, Santa Casa de São Paulo – FCMSCSP – São Paulo (SP), Brazil. (1) Speech Language Pathology and Audiology Course, School of Medical Sciences, Santa Casa de São Paulo – FCMSCSP – São Paulo (SP), Brazil.
Source of funding: São Paulo Research Foundation (FAPESP).
Conlict of interests: nothing to declare.
Cortical Auditory Evoked Potential: evaluation of speech
detection in adult hearing aid users
Potencial Evocado Auditivo Cortical: avaliação da
detecção de fala em adultos usuários de prótese auditiva
ABSTRACT
Purpose: To analyze the presence of auditory cortical potential and its correlation with psychoacoustic detection of speech sounds as well as the latency of the P1, N1 e P2 components presented in free ield in hearing impaired adults with and without ampliication. Methods: We evaluated 22 adults with moderate to severe symmetrical bilateral sensorineural hearing loss, regular users of bilateral hearing aids. Speech sounds of low (/m/), medium (/g/) and high (/t/) frequencies were presented in sound ield in decreasing intensities of 75, 65 and of 55 dBSPL in free ield with and without hearing aids. The used equipment performs automatic statistical detection of the presence of response; forthermore, the latencies of waves P1, N1 e P2 were labeled and the psychoacoustic perception was registered. Results: The results demonstrated the increased presence of cortical response with hearing aids. We observed the correlation between psychoacoustic perception and automatic detection of 91% for the sounds /g/ and /t/ and ranged from 73 to 86% for the sound /m/. The averages of latencies P1-P2-N1 decreased with both increasing intensity and the use of hearing aids for the three sounds. The differences were signiicant for the sounds /g/ and /t/ in comparison with and without hearing aids. Conclusion: There was increase in the presence of cortical auditory evoked potential with hearing aids. Automatic detection of cortical response provided with hearing aids showed 91% agreement with the psychoacoustic perception of the speech signal. In the analysis of latency measures of the P1, N1 and P2 components, it was observed a decrease with the increase of the signal intensity and the use of ampliication for the three speech stimuli /m/, /g/ and /t/.
RESUMO
INTRODUCTION
The auditory evoked potentials (AEPs) are electrical modi-ications in the auditory nervous system, generated in several levels of the central auditory nervous system by an acoustic stimulus. They are classiied according to latency (interval of time between the presentation of the sound stimulus and wave peak) into three groups: short-latency potentials, occurring in the irst 10–12 ms; middle-latency potentials, occurring between 12 and 50 ms; and long-latency potentials, also called cortical potentials, occurring between 50 and 600 ms(1).
The most common exogenous cortical auditory evoked potentials (CAEPs) are P1, N1 e P2. These components provide information concerning the arrival of sound infor-mation to the auditory cortex(2). For an adult, the P1 wave
is characterized by a small positive peak, with latency of approximately 50 ms after stimulus; one high negative peak (N1), about 100 ms after the stimulus begins; and one sec-ond high positive peak (P2), about 200 ms after stimulus. The auditory assessment using the CAEPs presents several advantages, because it allows evaluating the whole auditory system (from the brain stem to the cortex) and because it can be registered among awake participants, obtained with a vari-ety of acoustic stimuli presented both with headphones and in free ield, which is an especially favorable situation(1,3).
Even if the clinical and scientiic value of these potentials is inestimable, the daily use of these cortical potentials were compromised in the past, due to several factors. The pattern of response of the main components of CAEP substantially changes depending on the level of development from birth to adolescence. It is also possible to observe great variabil-ity concerning range, latency, and morphology of inter- and intrasubject responses; there is also variance concerning the type and the characteristics of the stimulus. Therefore, by considering the signiicant maturational changes occurring in CAEP throughout development, the major variability of responses, besides the technical limitation of electrodes, ilters, and ampliiers to capture these potentials, added to the dificulty to interpret responses and the high costs of the equipment, the clinical use of CAEP has been hampered until recently(3,4).
The increasing number of infants, who were diagnosed early by neonatal auditory screening programs, being referred to the adaptation of hearing aids created challenges related to speech language pathology and audiology. The irst one involves ensur-ing a reliable estimation of hearensur-ing thresholds of this popula-tion. The second one involves the calculation of electro-acoustic characteristics and the necessary adjustments, based on these hearing thresholds, using prescriptive formulas, ensuring that speech signals can be detected in an optimized, effective, and comfortable manner for this child(5). Whether the prescribed
tar-gets of acoustic gain and maximum outputs are being reached can be observed with adequate prescriptive formulas, punctu-ally and individupunctu-ally, to measure the performance of a speciic hearing-aid device. However, these formulas depend on the accuracy of calculations based on the measured or estimated hearing threshold. Errors, deviations, or imprecision that may
occur for any of these stages can compromise the goals of ampli-ication to be reached. The larger the deviation, the harder it is to ensure the expected beneits or that the provided sounds would, in fact, reach the auditory cortex(6,7). Besides, with the
objective of adapting performance and comfort of ampliica-tion, reports given by the patient are used to make ine adjust-ments of electroacoustic features of ampliication. However, in case of newborns or adults who cannot respond, who are going through the process of adaptation of hearing aids, besides the observation of clinical behavior and statements from parties in charge, we do not have any objective validation means that can ensure this patient can detect the ampliied sound, especially the speech sound in normal conversation intensities. With this impasse, it was possible to observe increasing interest for the CAEP, which was revitalized by studies that showed its clini-cal use in various scenarios of auditory, learning, mental, and neurological changes(8).
Recent studies(3,9-12) show that the CAEPs obtained from
speech stimuli are promising for the hearing rehabilitation of individuals, because they provide information referring to the objective record of speech stimuli detection and processing in the auditory cortex, with or without a hearing-aid device. Therefore, the assessment of cortical responses would lead to important complementary information about the perception (or the lack of perception) of the ampliied sound.
On the basis of these findings, the National Acoustic Laboratories (NAL), a governmental institution from Australia, has developed, in the past few years, a device to study corti-cal potentials, named HEARLab®. This system is accessible
for clinical use, because of its advanced technology and abil-ity to reduce noise and interferences is also more sensitive to capture responses and counts on an exclusive method of sta-tistical detection and automatic analysis of responses, there-fore, it does not require a subjective interpretation from the examiner(3,10,13,14). , thus it is different from similar devices.
Besides, the equipment allows the manual peak marking and analysis of aspects related to latency and amplitude of responses, which are equally present in traditional research devices of the CAEPs.
The hypothesis of this study is that it is possible to safely measure the effects of sound ampliication for speech stimuli in cortical measures by means of the automatic analysis equipment of the CAEPs. In Brazil, there are no studies made with devices that provide the automatic analysis of CAEPs. Therefore, the objective of this analysis was to verify the presence of cortical auditory potential and its agreement with the psychoacoustic detection of speech sounds, as well as the latency of compo-nents P1, N1 and P2 presented in a free ield for adults with hearing impairment, with or without hearing aids.
METHODS
In this study, 22 adults (aged between 19 and 76 years) with bilateral hearing loss were assessed; 16 were female and 6 were male participants, selected from the database of the Speech Language Pathology and Audiology clinic of Santa Casa de São Paulo.
Adult or elderly individuals, with moderate to severe sen-sorineural, bilateral, symmetric hearing loss, wearing bilat-eral hearing aid for at least 1 year were included in the study. Individuals with mixed, conductive, or unilateral hearing loss, or presenting with other neurological or psychiatric conditions were not included in the study.
The descriptive analysis of the sample as to age, level of loss, time of use, and aspects of the hearing aid is presented in Chart 1.
To develop the study, we used an audiometer (model Itera, GN Otometrics) and a middle ear analyzer (model AZ 7R, Interacoustics). Audiometry tests were classiied as mild, mod-erate, moderately severe, severe, and profound, according to the criterion by Davis and Silverman(15).
The HEARLab® system was used to detect the CAEPs.
The system has one model used to assess if speech signals produce a cortical response among hearing-aid users (Aided Cortical Assessment). In this module, the device enables
three different speech stimuli: /m/, /g/, and /t/, which were selected for allowing spectral emphasis in low, medium, and high frequencies, respectively(3,10,13). These phonemes were
extracted from the continuous speech of a female speaker. They were iltered to coincide with the International Long-Term Average Speech Spectrum (ILTASS). A high-pass il-ter was also applied with 250 Hz in the sounds of /t/ and /g/ to remove unwanted low-frequency noises. The three sounds provide information about speech perception in different regions of frequencies. The device has three testing intensi-ties: 55, 65, and 75 dBNPS, which represent signals of weak, medium, and strong speech intensity, respectively, presented in free ield by a sound box.
The equipment has a system of automatic analysis (multi-variate analysis of varianceMANOVA), which objectively deter-mines if there is a cortical response or not. The signiicance level (p-level) generated by the system indicates the presence of response when p-value is lower than 0.05.
At irst, the protocol adopted to characterize the participant was illed out, containing data concerning general personal information, hearing health and aspects related to the use of a hearing aid or not. Once inclusion and exclusion criteria were analyzed, the evaluation protocol was initiated.
Chart 1. Characteristics of the sample as to age, sex, level of loss and hearing-aid device
Subject Age Sex Level of loss Hearing-aid device
Type Model Daily use (hours)
1 48 F Moderate Retro HIT 12
2 49 F Moderate/severe Retro NEO 112 12
3 40 F Moderate Retro LNQ65D 12
4 49 F Moderate/severe Intra Element 8 8
5 36 F Moderate Retro Dual M7 12
6 59 M Moderate/severe Retro Hit 8
7 42 F Moderate/severe Retro ZG71D 12
8 19 F Moderate Retro UNA SP AZ 14
9 57 F Moderate Retro A74 12
10 53 M Severe Retro One35 8
11 39 F Moderate/severe Retro LNQ65D 8
12 59 F Moderate/severe Retro Hit 10
13 26 F Moderate/severe Intra Extra 11 8
14 63 M Moderate/severe Retro LNQ75D 10
15 26 F Severe Retro IDT35 14
16 54 F Moderate Retro Essential 8
17 25 F Moderate Intra Bravíssimo 10
18 55 M Moderate/severe Retro NEO 112 12
19 49 M Moderate Retro Dual M7 14
20 56 F Moderate/severe Intra B2X 12
21 51 M Moderate Retro ZG61D 12
22 76 F Moderate Retro 770D 8
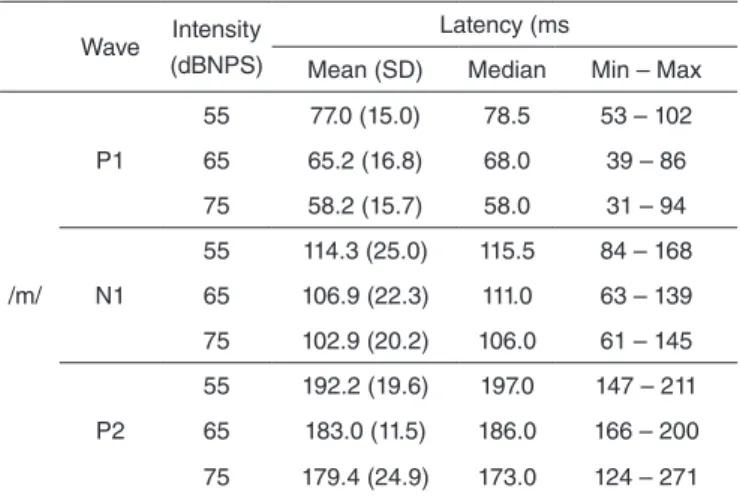
Table 2. Descriptive statistics of components P1, N1, and P2 with the speech stimulus /m/, under aided and unaided conditions
Wave Intensity
(dBNPS)
Latency (ms
Mean (SD) Median Min – Max
55 77.0 (15.0) 78.5 53 – 102
P1 65 65.2 (16.8) 68.0 39 – 86
75 58.2 (15.7) 58.0 31 – 94
55 114.3 (25.0) 115.5 84 – 168
/m/ N1 65 106.9 (22.3) 111.0 63 – 139
75 102.9 (20.2) 106.0 61 – 145
55 192.2 (19.6) 197.0 147 – 211
P2 65 183.0 (11.5) 186.0 166 – 200
75 179.4 (24.9) 173.0 124 – 271
Caption: SD = standard deviation; Min = minimum; Max = maximum
Table 3. Descriptive statistics of components P1, N1, and P2 with the speech stimulus /t/, under aided and unaided conditions
Wave Intensity
(dBNPS)
Latency (ms
Mean (SD) Median Min – Max
55 66.8 (22.7) 57.0 32 – 105
P1 65 60.3 (19.7) 55.0 31 – 90
75 47.4 (15.1) 47.0 26 – 76
55 108.0 (21.1) 109.5 69 – 140
/t/ N1 65 99.0 (20.2) 97.0 67 – 161
75 86.4 (15.0) 85.0 63 – 110
55 185.3 (20.9) 186.0 143 – 222
P2 65 175.4 (23.5) 180.0 130 – 214
75 159.3 (23.0) 166.0 112 – 190
Caption: SD = standard deviation; Min = minimum; Max = maximum
All the participants went through the same evaluation protocol, which included the performance of pure tone air and bone audiometry, acoustic immittance measures, verification of the adequate functioning of hearing aids, and record of CAEPs under aided and unaided condition in free field.
Before cortical response evaluation, behavioral detection was registered for each one of the speech stimuli under the same testing conditions used to assess the CAEP.
After placing the electrodes: vertex (CZ), right or left mas-toids (M1 and M2), and the ground electrode on the forehead (FZ), participants were assessed while being alert, placed at an azimuth of 0º with relation to the sound box. They were dis-tracted by images on a soundless television, in an acclimatized room that was acoustically treated.
The three speech stimuli of low (/m/), middle (/g/), and high (/t/) frequencies were presented in decreasing intensities of 75, 65, and 55 dBNPS, beginning without the use of hearing aids. The same sequence was adopted with hearing aids, which were previously checked as to their functioning. Their programming for current use, with all the algorithms for signal processing, was activated.
The latency of waves P1, N1, and P2 were also manu-ally marked in the responses considered by the equipment as being present (p<0.05), both with and without hearing aids. Marking was in accordance with the visual orientation pro-vided by the HEARLab®equipment, being conirmed by an
evaluator judge.
Statistical analysis used Mann-Whitney and Wilcoxon tests, as well as the repeated measures analysis of variance (ANOVA). In all the tests, a 0.05 signiicance level was adopted (or 5%) to reject the null hypothesis.
RESULTS
The automatic analysis of the presence of cortical response can be visualized in Table 1. It is possible to observe the increasing presence of response when the hearing aid is being used. In all of the presentations of speech sounds /m/, /g/, and /t/, in the condition of wearing a hearing-aid device, the individual reported sound perception. Therefore, there was agreement between the psychoacoustic perception and the automatic detection, according to the proportion of automatic detection at the presence of response, 91% for /g/ and /t/ speech sounds, and ranging from 73 to 86% for the /m/ sound.
Latencies of components P1, N1 and P2 in the different speech sounds and intensities are presented in Tables 2 to 4 (without hearing aid) and in Tables 5 to 7 (with hearing aid). The results showed that the average of latencies of components P1, N1 and P2 reduced with the increasing intensity and with the use of hearing-aid devices for the three sounds /m/, /t/, and /g/. Differences were signiicant for sounds /t/ and /g/ in the comparison between under aided and unaided conditions, pre-senting signiicant tendency for the phoneme /m/ in the ampli-ied response (p>0,06).
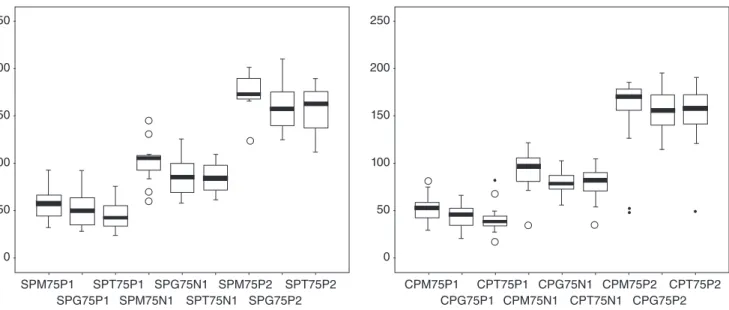
Figure 1 shows that for the intensity of 75 dBNPS, the latency of components P1, N1 and P2 declined with the increas-ing frequency rate of speech sound, that is, the highest speech stimuli /t/, presented with the lowest latencies, under aided and unaided conditions (p<0.01).
Sound Intensity
(dBNPS)
Presence without hearing aid device (%)
Presence with hearing aid device (%)
55 50.0 72.7
m 65 50.0 86.4
75 77.3 90.9
55 36.4 90.9
g 65 54.5 90.9
75 90.9 90.9
55 63.6 90.9
t 65 86.4 90.9
75 81.8 90.9
Table 4. Descriptive statistics of components P1, N1, and P2 with speech stimulus /g/, under aided and unaided conditions
Wave Intensity
(dBNPS)
Latency (ms
Mean (SD) Median Min – Max
55 80.3 (39.2) 69.0 30 – 151
P1 65 55.0 (25.7) 53.0 27 – 127
75 52.7 (20.7) 50.5 28 – 93
55 123.5 (42.0) 119.5 81 – 210
/g/ N1 65 92.2 (25.2) 90.5 66 – 155
75 88.5 (22.2) 86.5 53 – 133
55 186.7 (25.0) 185.0 147 – 235
P2 65 166.0 (20.0) 168.0 136 – 202
75 162.9 (22.4) 164.5 126 – 211
Caption: SD = standard deviation; Min = minimum; Max = maximum
Table 5. Descriptive statistics of components P1, N1, and P2 with speech stimulus /m/, under aided and unaided conditions
Wave Intensity
(dBNPS)
Latency (ms
Mean (SD) Median Min – Max
55 75.0 (19.0) 77.0 43 – 105
P1 65 62.0 (14.7) 64.0 35 – 85
75 52.0 (14.0) 53.5 29 – 82
55 118.0 (17.3) 119.0 87 – 157
/m/ N1 65 109.5 (20.4) 109.0 73 – 153
75 93.0 (19.7) 96.5 35 – 122
55 191.1 (15.9) 189.0 167 – 225
P2 65 184.3 (19.1) 184.0 140 – 229
75 177.5 (39.0) 171.0 49 – 186
Caption: SD = standard deviation; Min = minimum; Max = maximum
Table 6. Descriptive statistics of components P1, N1, and P2 with speech stimulus /t/, under aided and unaided conditions
Wave Intensity
(dBNPS)
Latency (ms
Mean (SD) Median Min – Max
55 55.8 (17.3) 51.0 24 – 86
P1 65 49.7 (16.0) 43.5 26 – 85
75 41.6 (15.0) 38.0 18 – 82
55 96.9 (21.0) 95.5 65 – 135
/t/ N1 65 87.4 (15.8) 90.0 60 – 111
75 79.5 (16.7) 82.5 35 – 105
55 176.7 (24.2) 175.5 123 – 227
P2 65 163.0 (21.5) 171.0 118 – 191
75 152.0 (29.9) 158.0 50 – 189
Caption: SD = standard deviation; Min = minimum; Max = maximum
Table 7. Descriptive statistics of components P1, N1, and P2 with speech stimulus /g/, under aided and unaided conditions
Wave Intensity
(dBNPS)
Latency (ms
Mean (SD) Median Min – Max
55 56.0 (16.5) 52.0 30 – 94
P1 65 49.0 (14.0) 50.0 27 – 74
75 43.4 (13.0) 46.0 22 – 67
55 92.3 (13.2) 90.5 70 – 123
/g/ N1 65 87.8 (12.3) 86.0 70 – 107
75 79.5 (10.0) 78.5 58 – 103
55 171.9 (20.3) 174.0 130 – 201
P2 65 166.2 (22.2) 162.0 128 – 206
75 155.9 (22.0) 156.0 115 – 196
Caption: SD = standard deviation; Min = minimum; Max = maximum
250
200
150
100
50
0
250
200
150
100
50
0
SPM75P1 SPG75P1
SPT75P1 SPM75N1
SPG75N1 SPT75N1
SPM75P2 SPG75P2
SPT75P2 CPM75P1
CPG75P1 CPT75P1
CPM75N1 CPG75N1
CPT75N1 CPM75P2
CPG75P2 CPT75P2
DISCUSSION
The applications of CAEP in audiological diagnosis have many advantages, especially due to the proximity of its gen-erators with sound perception. This favors the use of complex speech sounds. The acoustic characteristics of complex sounds can be relected in the form and latency of these potentials; therefore, they can be used to determine the integrity of the neural codiication of these characteristics, thus contributing with the determination of speech perception. Recent studies suggest that consonants and vowels have different represen-tations in the central auditory system, both in laboratory ani-mals(16) and in human beings(17).
In this study, results with the use of speech sounds suggest that CAEPs can be used as an objective tool to assess the char-acteristics of ampliication and the validation of hearing-aid ittings, thus enabling the measurement of audibility of speech sound ampliication among individuals who cannot collaborate, which is also stated by other authors(3,9,10,18-21), who showed that
the use of hearing aids improved the presence of measurable cortical responses (Table 1).
According to Purdy et al.(7), if the hearing-aid device enables
speech sounds to generate cortical responses, then the pres-ence of cortical responses provide evidpres-ence that the speech sounds received via ampliication were detected. Besides, the record of CAEP latencies can be used to follow-up chil-dren with hearing impairment using hearing-aid devices or cochlear implants in a clinical environment, thus showing the hearing development through changes in the latency of these potentials(8,21).
Effect of Intensity versus Ampliication
In literature, the effect of intensity is well demonstrated, that is, when the intensity of stimulus increases, the peak of laten-cies of the components becomes shorter, which means reduced time of neural conduction; and the amplitude increases, which represents increasing strength of response(22).
The reduced latency of components P1, N1 and P2, with the use of hearing-aid devices, is also expected. Such an effect occurs independently if sound is presented in the free ield, with or without hearing-aid devices. However, the effect of sound ampliication is not so clear. Such a fact could be jus-tiied because sound ampliication does not have the same effect as the real increase in sound intensity. The hearing-aid device changes the characteristics of the stimulus, as well as the relationship signal/noise, which may affect the capture of AEPs(11,23,24). These indings reinforce the importance of
controlling the characteristics of the hearing-aid device and the levels of intensity of the stimulus when the individual is assessed wearing a hearing-aid device. By testing the same person in different evaluation sessions, or even by comparing the response of individuals, it is important to mention differ-ent gain adjustmdiffer-ents of the hearing device.
Our results showed that the average cortical response in the aided condition was signiicantly lower for the phoneme /m/ than for the sounds /g/ and /t/. The obtained indings corroborate
with those in the literature(19), which also showed responses that
were signiicantly more present in CAEP for the sounds /g/ and /t/ under aided condition. For the sound /m/, no signiicant increase in the ampliied response was observed, with fewer responses generated in the ampliied condition. One possible explanation may be related to the lower ampliication prescribed for low frequencies low frequencies(5,25).
Besides, the analysis of latency values for the inten-sity of 75 dBNPS seems to show an increasing latency for deeper sounds, with the presence or use of a hearing-aid device (Figure 1). The tonotopic organization is expressed in every auditory pathway(26), and it could explain this
effect, which is not described in literature and can be inves-tigated in new studies with the amplification of speech sound use in electrophysiological tests. The use of cortical potentials is adequate for the assessment of ampliication due to several reasons, especially because of the possibility of using speech sounds; the longer duration of the spectrum of these speech sounds, which enable the ampliied stimu-lus to have similar performance in relation to its functioning in real life; because it represents sound detection through-out the auditory path, which can be affected by all the parts in the auditory system, as well as the response rate of gain and frequency of the hearing-aid device(7,10).
The chances of using an objective method to analyze the presence or the absence of CAEP will increment the clini-cal use of this potential. Our results showed that the use of automatic cortical responses made available by the device revealed an agreement between psychoacoustic perception of the sound and the register of the ampliied cortical response in 91% of the presentations, except for the /m/ sound (73–86%). Recent studies conducted with the application of this type of analysis and device in a population of adults and children(3,13)
showed that the results obtained with the automatized analy-sis of responses were at least equivalent, if not higher, to the analysis of responses that was conducted by an experience human technician.
Therefore, the use of CAEP in hearing aids itting proto-col of adaptation of hearing-aid devices, with the objective of validating ampliication, is justiied for characterizing an objec-tive measurement that the ampliied speech stimulus is able to trigger the neural response in the auditory cortex, therefore, it can be noticed(7). The results in this study conirm the use of
CAEPs as a valuable clinical tool to verify hearing-aid itting in participants that are dificult to be tested, such as children, adults, or elders who are unable to respond. Besides, for audi-ology control, the CAEPs can be repeated at different times to document different latencies(27,28).
CONCLUSION
to observe the effect of intensity under aided and unaided conditions, with the decreasing latencies of components P1, N1, and P2, both with the increasing intensity of the signal and in the use of ampliication for the three speech stimuli, /m/, /g/, and /t/.
*SC, NC, BP, and NG were in charge of data collection and tabulation; ASD, MBW, and KA collaborated and supervised data collection and tabulation, as well as data analysis; ASD was responsible for the study project and design, and the general orientation of the steps of execution and elaboration of the manuscript.
REFERENCES
1. Hall JW. New handbook of auditory evoked responses. Boston: Pearson, Allyn and Bacon; 2007.
2. Näätänen R, Picton T. The N1 wave of the human electric and magnetic response to sound: a review and an analysis of the component structure. Psychophysiology. 1987;24(4):375-425.
3. Golding M, Dillon H, Seymour J, Carter L. The detection of adult cortical auditory evoked potentials (CAEPs) using an automated statistic and visual detection. Int J Audiol. 2009;48(12):833-42.
4. Campbell K, Colrain I. Event-related potential measures of the inhibition of information processing: II. The sleep onset period. Int J Psychophysiol. 2002;46(3):197-214.
5. Ching T, Dillon H. Prescribing amplification for children: adult-equivalent hearing loss, real-ear aided gain, and NAL-NL1. Trends Amplif. 2003;7(1):1-9.
6. Dillon H. So, baby, how does it sound? Cortical assessment of infants with hearing aids. Hear J. 2005;58(10):10-7.
7. Purdy SC, Katsch R, Dillon H, Storey L, Sharma M. Aided cortical auditory evoked potentials for hearing instrument evaluation in infants. In: Seewald RC, Bamford JM, editors. A Sound Foundation through Early Ampliication. Proceedings of the Third International Conference; 2005. Stafa, Switzerland: Phonak AG; 2005. p. 115-27.
8. Sharma A, Dorman MF, Spahr AJ. A sensitive period for the development of the central auditory system in children with cochlear implants: implications for age of implantation. Ear Hear. 2002;23(6):532-9. 9. Carter L, Dillon H, Seymour J, Seeto M, Van Dun B. Cortical
auditory-evoked potentials (CAEPs) in adults in response to iltered speech stimuli. J Am Acad Audiol. 2013;24(9):807-22.
10. Van Dun B, Carter L, Dillon H. Sensitivity of cortical auditory evoked potential (CAEP) detection for hearing-impaired infants in response to short speech sounds. Audiol Res. 2012;2(13):65-76.
11. Billings CJ, Tremblay KL, Souza PE, Binns MA. Effects of hearing aid ampliication and stimulus intensity on cortical auditory evoked potentials. Audiol Neurootol. 2007;12(4):234-46.
12. Souza P, Tremblay K. New perspectives on assessing ampliication effects. Trends Amplif. 2006;10(3):119-43.
13. Carter L, Golding M, Dillon H, Seymour J. The detection of infant cortical auditory evoked potentials (CAEPs) using statistical and visual detection techniques. J Am Acad Audiol. 2010;21(5):347-56.
14. Munro KJ, Purdy SC, Ahmed S, Begum R, Dillon H. Obligatory cortical auditory evoked potential waveform detection and differentiation using a commercially available clinical system: HEARLab™. Ear Hear. 2011;32(6):782-6.
15. Davis H, Silverman SR. Auditory Test Hearing Aids. In: Davis H, Silvermann SR, editors. Hearing and deafness. Holt: Rinehart and Winston Hearing and Deafness; 1970.
16. Perez CA, Engineer CT, Jakkamsetti V, Carraway RS, Perry MS, Kilgard MP. Different timescales for the neural coding of consonant and vowel sounds. Cereb Cortex. 2013;23(3):670-83.
17. Kuuluvainen S, Nevalainen P, Sorokin A, Mittag M, Partanen E, Putkinen V, et al. The neural basis of sublexical speech and corresponding nonspeech processing: a combined EEG-MEG study. Brain Lang. 2014;130:19-32.
18. Golding M, Dillon H, Seymour J, Purdy SC, Katsch R. Obligatory Cortical Auditory Evoked Potentials (CAEPs) in infants — a ive year review. National Acoustic Laboratories Research & Development Annual Report 2005/2006. Chatswood, New South Wales, Australia: Australian Hearing; 2006.
19. Chang HW, Dillon H, Carter L, van Dun B, Young ST. The relationship between cortical auditory evoked potential (CAEP) detection and estimated audibility in infants with sensorineural hearing loss. Int J Audiol. 2012;51(9):663-70.
20. Korczak PA, Kurtzberg D, Stapells DR. Effects of sensorineural hearing loss and personal hearing aids on cortical event-related potential and behavioral measures of speech-sound processing. Ear Hear. 2005;26(2):165-85.
21. Sharma A, Martin K, Roland P, Bauer P, Sweeney MH, Gilley P, et al. P1 latency as a biomarker for central auditory development in children with hearing impairment. J Am Acad Audiol. 2005;16(8):564-73.
22. Adler G, Adler J. Inluence of stimulus intensity on AEP components in the 80-to 200 – millisecond latency range . Audiology. 1989;28(6):316-24.
23. Billings CJ, Tremblay KL, Miller CW. Aided cortical auditory evoked potentials in response to changes in hearing aid gain. Int J Audiol. 2011;50(7):459-67.
24. Tremblay KL, Kalstein L, Billings CJ, Souza PE. The neural representation of consonant-vowel transitions in adults who wear hearing aids. Trends Amplif. 2006;10(3):155-62.
25. Dillon H. Hearing aids. Sydney: Boomerang Press; 2001.
26. Van Dijk P, Langers DR. Mapping tonotopy in human auditory cortex. Adv Exp Med Biol. 2013;787:419-25.
27. Alvarenga KF, Vicente LC, Lopes RCF, Silva RA, Banhara MR, Lopes AC, et al. Inluência dos contrastes de fala nos potenciais evocados auditivos corticais. Braz J Otorhinolaryngol. 2013;79(3):336-41. 28. Campbell JD, Cardon G, Sharma A. Clinical Application of the P1