Liver lobe-based magnetic resonance
diffusion-weighted imaging using multiple b values in patients
with hepatitis B-related liver cirrhosis: association
with the liver disease severity according to the
Child-Pugh class
Hong-Jie Tang,I,IILi Zhou,I,IIIXiao-Ming Zhang,IJun Liu,IVTian-Wu Chen,I,*Nan-Lin Zeng,IDan Wang,IJie Li,I Yu-Cheng Huang,IYu-Lian Tang,IJiani HuV
IAffiliated Hospital of North Sichuan Medical College, Department of Radiology, Sichuan Key Laboratory of Medical Imaging, Nanchong, Sichuan, China. IINanchong Traditional Chinese Medicine Hospital, Department of Radiology, Nanchong, Sichuan, China.IIIAffiliated Gaoxin Hospital of Xi’an Medical College, Department of Imaging Centre, Xi’an, Shanxi, China.IVSecond Xiangya Hospital of Central South University, Department of Radiology, Changsha, Hunan, China.VWayne State University, Department of Radiology, Detroit, Michigan, USA.
OBJECTIVE:To determine the associations of liver lobe-based magnetic resonance diffusion-weighted imaging findings using multiple b values with the presence and Child-Pugh class of cirrhosis in patients with hepatitis B. METHODS:Seventy-four cirrhotic patients with hepatitis B and 25 healthy volunteers underwent diffusion-weighted imaging using b values of 0, 500, 800 and 1000 sec/mm2. The apparent diffusion coefficients of individual liver lobes for b(0,500), b(0,800)and b(0,1000) were derived from the signal intensity averaged across
images obtained using b values of 0 and 500 sec/mm2, 0 and 800 sec/mm2, or 0 and 1000 sec/mm2, respectively, and were statistically analyzed to evaluate cirrhosis.
RESULTS:The apparent diffusion coefficients for b(0,500), b(0,800)and b(0,1000)inversely correlated with the Child-Pugh
class in the left lateral liver lobe, the left medial liver lobe, the right liver lobe and the caudate lobe (r=–0.35 to –0.60, allpo0.05), except for the apparent diffusion coefficient for b(0,1000)in the left medial liver lobe (r=–0.17,p40.05). Among these parameters, the apparent diffusion coefficient for b(0,500)in the left lateral liver
lobe best differentiated normal from cirrhotic liver, with an area under the receiver operating characteristic curve of 0.989. The apparent diffusion coefficient for b(0,800)in the right liver lobe best distinguished Child-Pugh class A from
B–C and A–B from C, with areas under the receiver operating characteristic curve of 0.732 and 0.747, respectively. CONCLUSION:Liver lobe-based apparent diffusion coefficients for b(0,500)and b(0,800)appear to be associated
with the presence and Child-Pugh class of liver cirrhosis.
KEYWORDS: Diffusion Magnetic Resonance Imaging; Liver Cirrhosis; Hepatitis B; Chronic.
Tang HJ, Zhou L, Zhang XM, Liu J, Chen TW, Zeng NL, et al. Liver lobe-based magnetic resonance diffusion-weighted imaging using multiple b values in patients with hepatitis B-related liver cirrhosis: association with the liver disease severity according to the Child-Pugh class. Clinics. 2015; 70(7):486-492
Received for publication onFebruary 4, 2015;First review completed onMarch 20, 2015;Accepted for publication onApril 30, 2015
E-mail: [email protected]
*Corresponding author
’ INTRODUCTION
Liver cirrhosis is defined as the histological development of regenerative nodules surrounded by fibrous bands in response to chronic hepatitis (1). Liver biopsy is the gold standard
method to diagnose cirrhosis; however, it is not feasible in all patients with cirrhosis due to the invasiveness of this procedure and its sampling variability and may not be a desirable option for decompensated cirrhosis (1,2). The assessment of liver cirrhosis severity plays a crucial role in selecting therapeutic approaches and monitoring patient responses to clinical interventions (2). Laboratory tests (e.g., Child-Pugh classifica-tion) and clinical parameters (the presence of complications such as ascites) are used to assess liver disease severity.
To assess cirrhosis, magnetic resonance (MR) diffusion-weighted imaging (DWI) not only provides anatomical and structural information but also reflects functional attributes
DOI:10.6061/clinics/2015(07)05
of tissues by quantifying the process of water diffusion based on the apparent diffusion coefficient (ADC) (3). Previous studies have reported that the ADC of cirrhotic liver was lower than that of normal liver (4-7). In most of these published studies, the liver ADC was measured in the right liver lobe rather than in each liver lobe to evaluate liver cirrhosis; this approach was primarily used to correlate the liver ADC with the biopsy specimen, which is typically acquired from the right liver lobe. Hsu et al. (4) reported that patients with Child-Pugh Class A cirrhosis exhibited a reduced liver ADC based on measurement of the right liver lobe compared to individuals with normal liver function. Luciani et al. (5) used a respiratory-triggered acquisition with 10 b values to perform a DWI study of the right and left liver lobes and found that the ADC of either lobe significantly decreased in patients with cirrhosis compared to healthy volunteers and that there was no significant difference in the ADC between the right and left liver lobes.
It is well known that hypertrophy of the caudate and left lateral liver lobes and atrophy of the right liver lobe and the left medial liver lobe occur when a healthy liver progresses to the stage of compensated cirrhosis (6-8). We explored whether the ADCs of individual liver lobes are different between cirrhotic patients and healthy individuals and whether the ADCs for individual liver lobes distinctly correlate with the presence and Child-Pugh class of cirrhosis. Therefore, the aim of this study was to determine the associations of individual liver lobe ADCs obtained using multiple b values with the presence and Child-Pugh class of cirrhosis and to evaluate the difference in ADCs between any two liver lobes in cirrhotic patients with hepatitis B.
’ MATERIALS AND METHODS
Participant selection
This prospective study was approved by the institutional ethics review board of our hospital, and written informed consent was obtained from each participant prior to their participation in this study.
The patients were enrolled in our study according to the following inclusion criteria: (1) the initial diagnosis of cirrhosis in patients with hepatitis B was based on physical findings, laboratory investigations, imaging findings and histopathological findings whenever available according to the American Association for the Study of Liver Diseases (AASLD) practice guidelines on chronic hepatitis B (2007) (9); (2) the patients underwent abdominal MR scans and Child-Pugh score calculation based on 5 parameters, including albumin, ascites, bilirubin, prothrombin activity and ence-phalopathy; and (3) imaging data showed that the patients lacked portal vein emboli and hepatic carcinoma. From March 2013 to February 2014, there were 81 consecutive patients with cirrhosis resulting from hepatitis B. In this cohort, 53 cases were confirmed by liver biopsy, and the remaining 28 cases were diagnosed based on physical findings, laboratory investigations and MR findings accord-ing to the AASLD practice guidelines because they had contraindications for liver puncture biopsy. In this cohort, 31 patients had portal hypertension, whereas 23 patients did not, as demonstrated by endoscopy (n=54); the remaining 27 patients did not undergo this examination because of their contraindications.
The exclusion criteria were as follows: (1) patients with active gastrointestinal bleeding (n=2); (2) patients with a
history of treatment for portal hypertension, including splenectomy, partial spleen embolization, transjugular intra-hepatic portosystemic shunt, b-blocker therapy, blood transfusion therapy or endoscopic therapy, before the MR scans and biochemical tests (n=2); (3) patients with other etiologies such as portal vein thrombosis, parasitic diseases and hemato-logical malignancies needed to be excluded (n=1); and (4) patients with malignant liver lesions or alcohol addiction (n=1) or patients with sepsis, large-volume ascites, impaired renal function, or hemolysis (n=1). Of the 81 consecutive cirrhotic patients, 7 patients were excluded from this study. Consequently, 74 cirrhotic patients were included in this study.
In the cohort of enrolled cirrhotic patients, the mean age was 56 years (range, 23–81 years); 47 patients (63.5%) were
men, and 27 patients (36.5%) were women. A biochemical test was performed to determine the Child-Pugh scores, and no more than a 2-day delay was allowed between the biochemical tests and the MR scans. As a result, 23, 27 and 24 patients were classified as having Child-Pugh Class A, B or C cirrhosis, respectively. In addition, the enrolled patients underwent medical or surgical treatment for portal hyper-tension and other conditions after definitive diagnoses were made based on the MR scans and biochemical tests.
During the same research period, a control group of 25 random consecutive healthy volunteers (14 men, 11 women; mean age, 52 years; range, 21–76 years) who underwent
upper abdominal MR scans for physical examination at our institution served as the reference group. The inclusion criteria for the controls were no history of liver disease, hepatocellular carcinoma, or fatty liver and normal serum liver enzyme levels. Hepatitis B and C surface antigen tests revealed negative findings in all volunteers.
MR imaging protocol
The cirrhotic and healthy participants in our study underwent MR imaging using a 3.0 T whole-body imaging system (Signa; GE Medical Systems, Milwaukee, WI) equipped with a 32-channel phased-array body coil. After employing routine MR sequences, including axial two-dimensional spoiled gradient recalled echo T1-weighted imaging (T1WI) and axial fast recovery fast spin-echo T2-weighted imaging (T2WI) with fat suppression, DWI was performed using b values of 0, 500, 800 and 1000 s/mm2 prior to contrast agent injection for conventional contrast-enhanced MR scans. DWI was performed using a single-shot echo-planar imaging fat-suppressed sequence in the axial plane with respiratory-triggered acquisitions. The diffusion-weighted images for the four b values were obtained during one acquisition. The DWI sequence parameters were as follows: repetition time of 4800 msec, echo time of 49 msec, slice thickness of 7 mm, inter-slice gap of 2 mm, field of view of 34 34 cm, matrix of 256 192, number of excitations of 2,
and acquisition time of 38 sec, resulting in the acquisition of 18 contiguous transverse sections. In addition, T1WI, T2WI and contrast-enhanced MR scans, each performed during one breath hold, were used to detect portal vein emboli, hepato-cellular carcinoma, and fatty liver to determine whether the participant should be enrolled in our study.
DWI data analysis
analyzed according to the consensus of two radiologists (the first and second authors, with 5 and 4 years of experience in whole-body MR imaging, respectively) who were blinded to the clinical data. The ADCs for b(0,500), b(0,800) or b(0,1000) were derived
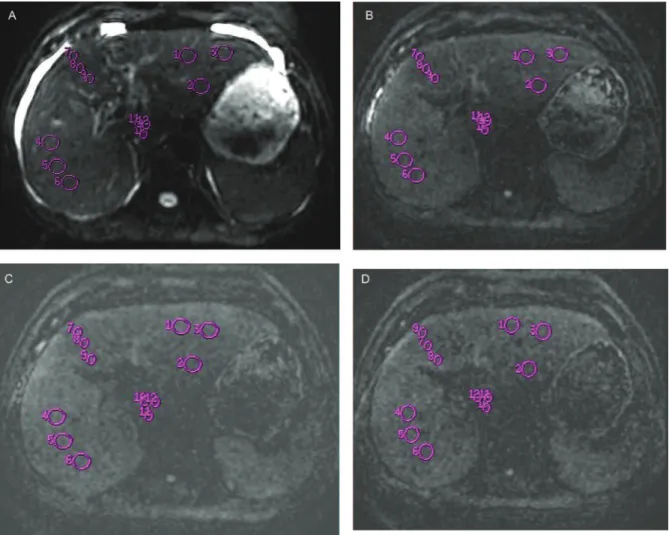
from the signal intensity averaged across images obtained using b values of 0 and 500 sec/mm2, 0 and 800 sec/mm2, or 0 and 1000 sec/mm2, respectively, using a software plug-in for a monoexponential model. Both radiologists performed the ADC calculations on defined circular regions of interest (ROIs), excluding vessels and motion artifacts, of approxi-mately 50 mm2in the left medial liver lobe or the caudate lobe or of 200 mm2in the left lateral or right liver lobe. The
liver was divided into four lobes, including the left lateral liver lobe (LLL), the left medial liver lobe (LML), the right liver lobe (RL), and the caudate lobe (CL). As shown in Figure 1, we applied three ROIs per liver lobe to obtain the b value for 0 sec/mm2, totaling 12 ROIs per participant; the ROIs were identically positioned on the corresponding ADC maps for b(0,500), b(0,800)and b(0,1000), which were
automati-cally generated by the software. The final liver lobe-based ADCs used for the analysis were the averaged ADCs of the three ROIs for b(0,500), b(0,800)or b(0,1000)for each liver lobe.
To determine the reproducibility of the ADC measure-ments in cirrhotic and healthy participants, individual liver
lobe ADCs for b(0,500), b(0,800) and b(0,1000) were measured
repeatedly by two additional observers (the fifth and seventh authors, with 16 years and 3 years of experience in whole-body MR imaging, respectively) according to consensus.
Statistical analysis
SPSS version 17.0 (SPSS Inc., Chicago, IL, USA) was used for statistical analysis. Descriptive statistics of ADCs included the means and standard deviations (SDs). AP-value of less than 0.05 was considered to represent a significant difference.
To determine the reproducibility of individual liver lobe ADC measurements, the precision of the repeated measure-ments was determined as the coefficient of variation (CV) using the following formula: CV (%)=(s/X) 100, where s is
the SD and X is the mean ADC (10). The resultant precision was expressed as an averaged CV. When the CV was less than 10%, inter-observer variability of the ADC was regarded as small, and the ADC of the first measurement was used as the final value. When CV was greater than 10%, the mean value of the two measurements was used as the final ADC for the subsequent analysis (11).
Spearman’s rank correlation analysis was used to test the correlation of liver lobe-based ADCs with the Child-Pugh
class of cirrhosis. The liver lobe-based ADCs were compared between participants stratified by Child-Pugh class and between any two liver lobes in cirrhotic patients using Mann-Whitney U tests together with Bonferroni corrections for multiple comparisons. If there were significant positive findings on the above-mentioned tests for any liver lobe-based ADC in patients stratified by Child-Pugh class, the cutoff value of the potentially distinguishing ADC was then determined via receiver operating characteristic (ROC) analysis of the area under the ROC curve (AUC) for the determination of the Child-Pugh class of cirrhosis.
’ RESULTS
Reproducibility of ADC measurements
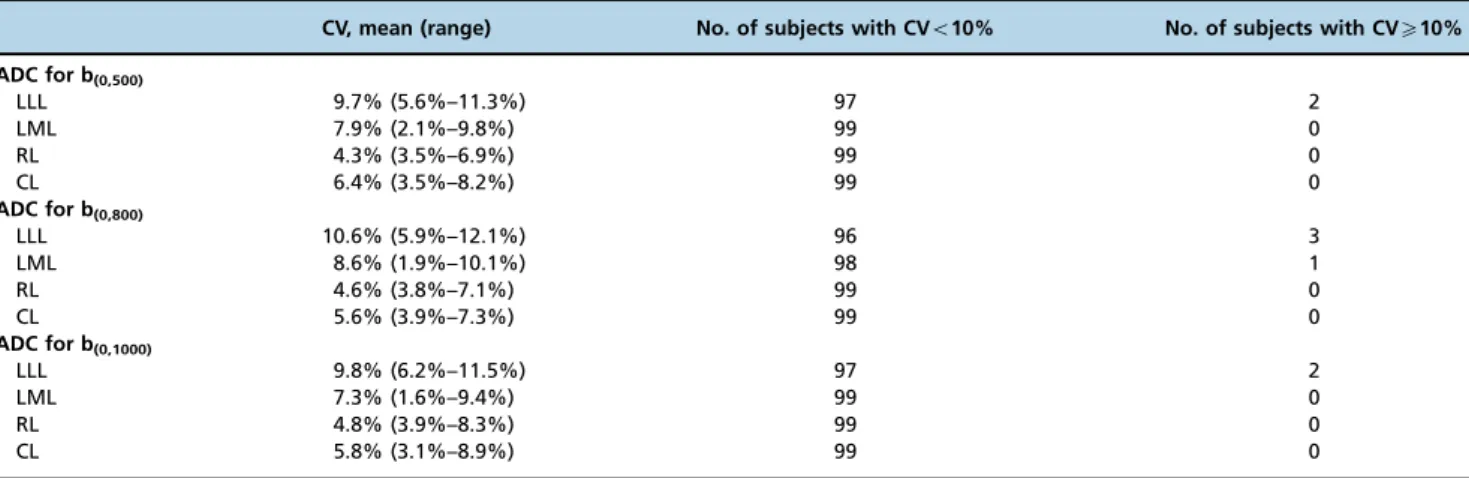
For the two measurement sessions of liver lobe-based ADCs in the 74 cirrhotic patients and 25 healthy volunteers, the mean CV for the liver lobe-based ADCs and the number of subjects with a CV of less than or greater than 10% are
listed in Table 1. In participants with an inter-observer variability of less than 10% for the liver lobe-based ADCs, the variability was regarded as small, and the values of the first measurement were used as the final ADCs. In participants with an inter-observer variability ofX10% for the ADC, specifically in the LLL and the LML, an average of the two measurements was used as the final ADC.
Correlation of the liver lobe-based ADCs with the Child-Pugh class of cirrhosis
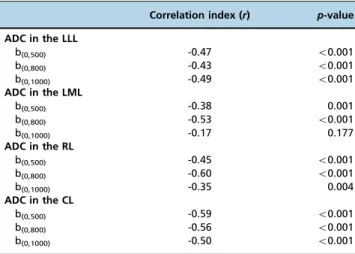
Liver lobe-based ADCs corresponding to healthy volunteers and patients with cirrhosis of Child-Pugh Class A, B or C are presented in Table 2. As shown in Table 3, inverse correlations of ADC for b(0,500) or b(0,800) with the Child-Pugh class of
cirrhosis were found in the LLL, the LML, the RL and the CL (all po0.05); an inverse correlation was observed between
the Child-Pugh class and the ADC for b(0,1000)in the LLL, the
RL and the CL (allpo0.05) but not in the LML (p40.05). Table 1 -Reproducibility of the apparent diffusion coefficient (10-3mm2/s) measurements in the enrolled participants.
CV, mean (range) No. of subjects with CVo10% No. of subjects with CVX10%
ADC for b(0,500)
LLL 9.7% (5.6%–11.3%) 97 2
LML 7.9% (2.1%–9.8%) 99 0
RL 4.3% (3.5%–6.9%) 99 0
CL 6.4% (3.5%–8.2%) 99 0
ADC for b(0,800)
LLL 10.6% (5.9%–12.1%) 96 3
LML 8.6% (1.9%–10.1%) 98 1
RL 4.6% (3.8%–7.1%) 99 0
CL 5.6% (3.9%–7.3%) 99 0
ADC for b(0,1000)
LLL 9.8% (6.2%–11.5%) 97 2
LML 7.3% (1.6%–9.4%) 99 0
RL 4.8% (3.9%–8.3%) 99 0
CL 5.8% (3.1%–8.9%) 99 0
Notes:LLL, left lateral liver lobe; LML, left medial liver lobe; RL, right liver lobe; CL, caudate lobe; ADC, apparent diffusion coefficient; CV, coefficient of variation.
Table 2 -Liver lobe-based ADCs (10-3mm2/s) in healthy volunteers and patients with cirrhosis of different Child-Pugh classes (mean±standard deviation).
b values (in s/mm2) in the indicated liver lobe Healthy volunteers (n=25)
Cirrhotic patients (n=74)
Child-Pugh class of cirrhosis
A (n=23) B (n=27) C (n=24)
b(0,500)
LLL 2.78±0.51 1.51±0.31* 1.48±0.34* 1.52±0.3* 1.53±0.31*
LML 2.1±0.7 1.7±0.48 1.83±0.38 1.82±0.43 1.45±0.38*
RL 1.57±0.24 1.31±0.2*abc 1.37±0.22 1.33±0.21 1.24±0.18*
CL 2.2±0.3 1.52±0.36* 1.62±0.44* 1.57±0.35* 1.37±0.25*
b(0,800)
LLL 1.87±0.51 1.44±0.33 1.62±0.43 1.42±0.23 1.32±0.26*
LML 1.4±0.13 1.18±0.13*ac 1.23±0.12 1.19±0.15* 1.13±0.12*
RL 1.61±0.23 1.34±0.28* 1.49±0.35* 1.31±0.25* 1.15±0.14*
CL 1.98±0.53 1.3±0.28* 1.41±0.28* 1.4±0.3* 1.2±0.22*
b(0,1000)
LLL 1.75±0.42 1.42±0.42 1.58±0.44 1.37±0.22 1.35±0.56
LML 1.41±0.45 1.34±0.27 1.37±0.25 1.39±0.24 1.24±0.31
RL 1.4±0.34 1.19±0.19abc 1.19±0.1 1.25±0.25 1.11±0.15*
CL 1.89±0.45 1.44±0.34* 1.65±0.35 1.42±0.34* 1.31±0.28*
Notes:LLL, left lateral liver lobe; LML, left medial liver lobe; RL, right liver lobe; CL, caudate lobe.*indicates a significant difference in the ADC between cirrhotic patients and healthy volunteers after Bonferroni correction (po0.005). a, b, and c indicate a significant difference in the ADC in the cirrhotic
Comparison of the ADCs between participants stratified by Child-Pugh class and between any two liver lobes in cirrhotic patients
In the comparisons of ADCs between participants with normal liver function and those with each Child-Pugh class of cirrhosis (Table 2), Mann-Whitney U tests together with Bonferroni corrections showed that the ADCs for
b(0,500)in the LLL and the CL and for b(0,800)in the CL and
the RL were significantly different between the normal liver and the Child-Pugh Class A cirrhotic liver. The ADCs for b(0,500) in the LLL and the CL, for b(0,800) in the
LML, the RL and the CL, and for b(0,1000) in the CL
were significantly different between the normal liver and the Child-Pugh Class B cirrhotic liver. The ADCs for b(0,500)and b(0,800)in the LLL, the LML, the RL and the
CL and for b(0,1000) in the RL and the CL were different
between the normal liver and the Child-Pugh Class C cirrhotic liver.
In the comparisons of ADCs between each Child-Pugh class of cirrhosis (Table 4), the ADCs for b(0,500)in the LLL,
the RL and the CL, for b(0,800)in the LML, the RL and the CL,
and for b(0,1000)in the CL were different between the normal
liver and the Child-Pugh Class A–C cirrhotic liver. The ADCs
for b(0,800)in the RL and for b(0,1000)in the CL were different
between Class A and Classes B–C, and the ADCs for b(0,500)
in the LML and for b(0,800)in the RL were different between
Classes A–B and Class C.
In the comparisons of ADCs between any two liver lobes in cirrhotic patients (Table 2), the ADCs were different between the RL and all other liver lobes for b(0,500) and
b(0,1000)and between the RL and both the CL and the LLL for
b(0,800)(allpo0.008).
ROC analysis of ADCs for determining the Child-Pugh class of cirrhosis
Significant differences in the ADCs were found between the normal liver and the Child-Pugh Class A–C cirrhotic
liver, between Class A and Classes B–C, and between
Classes A–B and Class C, as shown in Table 4. Therefore,
ROC analysis of the ADCs was performed to determine the cutoff values of the ADCs and the AUC, sensitivity and specificity of these cutoff values for the presence and Child-Pugh class of cirrhosis, as shown in Table 5. Among the liver lobe-based ADCs, the ADC for b(0,500)in the LLL displayed
the largest AUC for identifying the presence of cirrhosis. The ADC for b(0,800) in the RL displayed the largest AUC
for distinguishing Child-Pugh Class A from Classes B–C
cirrhosis and for discriminating Child-Pugh Classes A–B
from Class C.
’ DISCUSSION
The management of patients with cirrhosis should now focus on prevention and early intervention to stabilize disease progression and to avoid or delay clinical decom-pensation to improve patient prognosis (12). To assess liver cirrhosis progression, the Child-Pugh classification system is occasionally regarded as a clinical measurement of liver function in the setting of liver cirrhosis (13). This system has Table 3 -Relationship between the apparent diffusion
coefficient (10-3mm2/s) and the Child-Pugh class of cirrhosis.
Correlation index (r) p-value
ADC in the LLL
b(0,500) -0.47 o0.001
b(0,800) -0.43 o0.001
b(0,1000) -0.49 o0.001
ADC in the LML
b(0,500) -0.38 0.001
b(0,800) -0.53 o0.001
b(0,1000) -0.17 0.177
ADC in the RL
b(0,500) -0.45 o0.001
b(0,800) -0.60 o0.001
b(0,1000) -0.35 0.004
ADC in the CL
b(0,500) -0.59 o0.001
b(0,800) -0.56 o0.001
b(0,1000) -0.50 o0.001
Notes:ADC, apparent diffusion coefficient; LLL, left lateral liver lobe; LML, left medial liver lobe; RL, right liver lobe; CL, caudate lobe.
Table 4 -P-values for the statistical comparisons of liver lobe-based apparent diffusion coefficients (10-3mm2/s) between groups of Child-Pugh classes of cirrhosis.
b values (s/mm2) in the indicated liver lobe Normal liver vs. Classes A–C Class A vs. Classes B–C Classes A–B vs. Class C
b(0,500)
LLL o0.001* 0.706 0.68
LML 0.043 0.134 0.006*
RL 0.001* 1.134 0.083
CL o0.001* 0.258 0.043
b(0,800)
LLL 0.03 0.093 0.095
LML o0.001* 0.113 0.065
RL o0.001* 0.009* 0.003*
CL o0.001* 0.158 0.015
b(0,1000)
LLL 0.09 0.05 0.036
LML 0.644 0.511 0.056
RL 0.014 0.428 0.057
CL 0.001* 0.013* 0.041
several drawbacks that could be influenced by a variety of internal and external factors in patients with cirrhosis. For example, patients with a bilirubin concentration of 55mm have a better prognosis than those with a bilirubin concentration of 250mm, but both groups of patients have the same severity score according to the bilirubin concentra-tion (14). This study aimed to determine the associaconcentra-tions of liver lobe-based ADCs obtained using multiple b values with the presence and Child-Pugh class of cirrhosis.
Regarding the DWI protocol used in our study, b values of 0, 500, 800 and 1000 sec/mm2were selected for liver lobe-based ADC calculations because a published study sug-gested that the sensitivity of the imaging sequence to water diffusion can change according to the b value (15). Specifically, diffusion information obtained from high b values (4500 sec/mm2) could help to detect liver lesions,
excluding perfusion effects, whereas that from very high b values (41000 sec/mm2) may reflect changes in tissue structure with greater sensitivity, although the signal to noise ratio of the image decreases with an increasing b value. As shown in this study, the liver lobe-based ADC measurements were reproducible, except for the ADC measurements in the left lobe in a few participants. The possible explanation for this result could be that the left lobe, especially the LLL, is more strongly affected by cardiac motion (16). To minimize the limitation of the reproducibility of ADC measurements in the left lobe in those few participants, we used the averaged ADC across the initial and repeated measurements as the final ADC for the statistical analysis.
As shown in our study, the liver lobe-based ADCs for b(0,500), b(0,800) and b(0,1000) inversely correlated with the
Child-Pugh class of cirrhosis, except for the ADC for b(0,1000)
in the LML. The pathological mechanism may be that liver cirrhosis is associated with markedly increased extracellular constituents and collagen deposition in the space of Disse as the healthy liver progresses to cirrhosis, resulting in decreased total water content and impaired Brownian motion of water within the fibrotic liver. The tortuosity of the extracellular space and the decreased number of active fibroblasts restrict the apparent diffusion of water protons (17-19). With an increasing Child-Pugh class of cirrhosis, the water diffusion in each liver lobe decreases further.
Regarding the comparison of ADCs between individual liver lobes, in cirrhotic patients, the ADCs for b(0,500) and
b(0,1000)in the RL appeared to be lower than those in the LLL,
the LML and the CL, and the ADC for b(0,800) in the RL
appeared to be lower than that in the CL and the LLL. Our findings were inconsistent with previously published reports (5), which suggested that there was no significant difference in the ADCs between the right and left liver lobes. The possible explanation for these differences may be that the published study was conducted using a 1.5 T MR scanner but that our study was performed using a 3 T imaging system. Specifically, the measured ADC might be 15.9% higher at 3 T than at 1.5 T in the liver (20). The mechanism underlying our finding may be that hypertrophy of the caudate and left lateral lobes and atrophy of the right and left medial liver lobes occur as the healthy liver progresses to the stage of compensated cirrhosis, which restricts the apparent diffusion of water protons more remarkably in the RL than in any other liver lobe (6-8).
Clinically, our findings suggested that the ADC for b(0,500)
in the LLL is the best indicator of the presence of cirrhosis among the ADCs of the LLL, the RL and the CL for b(0,500),
the LML, the RL and the CL for b(0,800), and the CL for
b(0,1000). The possible explanation for this result may be that
the left liver lobe, especially the LLL, is the most frequently hypertrophic region as the healthy liver progresses to cirrhosis. This hypertrophy may be accompanied by liver cell regeneration to compensate for the reduced liver function, resulting in decreased total water content and restricted Brownian motion of water within this lobe (21, 22). Compared with the measurement of liver stiffness via MR elastography in a published report (23), the ADC for b(0,500)
in the LLL more accurately identifies the presence of cirrhosis because the AUC of stiffness measurements is lower than that of ADC measurements (0.919 vs. 0.989). Compared with published perfusion studies (24,25), the ADC for b(0,500) in
the LLL more effectively determines the presence of cirrhosis than MR perfusion parameters.
For the first time, we found that the ADC for b(0,800)in the
RL better identified the Child-Pugh class of cirrhosis than the ADC for any other b value in any other liver lobe. The pathological mechanism may be that the right portal vein Table 5 -Receiver operating characteristic analysis of liver lobe-based apparent diffusion coefficients for determining the Child-Pugh class of cirrhosis.
Cutoff value (10-3mm2/s)
Comparison AUC Sensitivity (%) Specificity (%)
ADC for b(0,500)
LLL 2.04 Normal liver vs. cirrhosis 0.989 100 96.3
RL 1.81 Normal liver vs. cirrhosis 0.795 64.3 66.7
CL 1.88 Normal liver vs. cirrhosis 0.927 92.9 80
LML 1.42 Classes A–B vs. Class C 0.731 83.3 61.1
ADC for b(0,800)
LML 1.24 Normal liver vs. cirrhosis 0.872 92.9 68.5
RL 1.40 Normal liver vs. cirrhosis 0.819 85.7 68.5
CL 1.48 Normal liver vs. cirrhosis 0.874 100 66.7
RL 1.32 Class A vs. Classes B–C 0.732 66.7 66.7
RL 1.21 Classes A–B vs. Class C 0.747 72.2 61.1
ADC for b(0,1000)
CL 1.60 Normal liver vs. cirrhosis 0.783 71.5 70
CL 1.53 Class A vs. Classes B–C 0.721 66.7 74.4
branch directly enters the parenchyma of the right liver lobe in cases of cirrhosis and that cirrhotic hepatic nodules cause compression and irregular stenosis of the intrahepatic branches of this portal vein, reducing flow through the right portal branch and resulting in the marked spreading of fibrous bands and the evident restriction of Brownian motion of water within the RL (6,26).
Our study contains two inevitable limitations. First, our sample size was small; however, our study provides some useful information, specifically that liver lobe-based ADCs using multiple b values are associated with the presence and Child-Pugh class of cirrhosis. A larger number of samples will be included in our future study to confirm these findings. Second, the severity criterion used in this study was not the MELD score but rather the Child-Pugh class. The importance of these findings in clinical practice will be further explored using the MELD score.
In conclusion, our study revealed systematic differences in ADCs between liver lobes. The ADC for b(0,500)in the LLL is
recommended for determining the presence of liver cirrhosis, and the ADC for b(0,800) in the RL is recommended for
identifying the Child-Pugh class of cirrhosis. These findings may be helpful for understanding the association of liver lobe-based ADCs using multiple b values with the presence and Child-Pugh class of cirrhosis.
’ ACKNOWLEDGMENTS
This work was supported by the National Natural Science Foundation of China (grant no. 81050033), the Key Projects in the Sichuan Province Science & Technology Pillar Program (grant no. 2011SZ0237), and the Science Foundation for Distinguished Young Scholars of Sichuan Province in China (grant no. 2010JQ0039).
’ AUTHOR CONTRIBUTIONS
Tang HJ, Zhou L, Zhang XM, Liu J, Chen TW, Zeng NL, and Hu J contributed to the conception and design of the study; to the generation, collection, assembly, analysis and interpretation of the data; to the drafting and revision of the manuscript and approved the final version of the manuscript. Wang D, Li J, Huang YC, and Tang YL contributed to the generation, collection, assembly, analysis and interpretation of the data and approved thefinal version of the manuscript.
’ REFERENCES
1. Schuppan D, Afdhal NH. Liver cirrhosis. Lancet. 2008;371(9615): 838–51,
http://dx.doi.org/10.1016/S0140-6736(08)60383-9.
2. Ito K, Mitchell DG, Hann HW, Outwater EK, Kim Y, Fujita T, et al. Pro-gressive viral-induced cirrhosis: serial MR imaging findings and clinical correlation. Radiology. 1998; 207(3):729–35, http://dx.doi.org/10.1148/
radiology.207.3.9609897.
3. Guiu B, Cercueil JP. Liver diffusion-weighted MR imaging: the tower of Babel? Eur Radiol. 2011;21(3):463–7,
http://dx.doi.org/10.1007/s00330-010-2017-y.
4. Hsu FO, Chiou YY, Chen CY, Liu GC, Chu HC, Liu HC, et al. Diffusion-weighted magnetic resonance imaging of the liver in hepatitis B patients with Child-Pugh A cirrhosis. Kaohsiung J Med Sci. 2007;23(9):442–6,
http://dx.doi.org/10.1016/S1607-551X(08)70051-2.
5. Luciani A, Vignaud A, Cavet M, Nhieu JT, Mallat A, Ruel L, et al. Liver cirrhosis: intravoxel incoherent motion MR imaging--pilot study. Radiology. 2008;249(3):891–9, http://dx.doi.org/10.1148/radiol.2493080080.
6. Kim I, Jang YJ, Ryeom H, Lee SM, Lee HJ, Kim GC, et al. Variation in hepatic segmental volume distribution according to different causes of liver cirrhosis: CT volumetric evaluation. J Comput Assist Tomogr. 2012;36(2):220–5, http://dx.doi.org/10.1097/RCT.0b013e31824afd86.
7. Yoon JH, Lee JM, Baek JH, Shin CI, Kiefer B, Han JK, et al. Evaluation of hepatic fibrosis using intravoxel incoherent motion in diffusion-weighted liver MRI. J Comput Assist Tomogr. 2014;38(1): 110–6, http://dx.doi.org/
10.1097/RCT.0b013e3182a589be.
8. Li H, Chen TW, Chen XL, Zhang XM, Li ZL, Zeng NL, et al. Magnetic resonance-based total liver volume and magnetic resonance-diffusion weighted imaging for staging liver fibrosis in mini-pigs. World J Gastro-enterol. 2012;18(48):7225–33, http://dx.doi.org/10.3748/wjg.v18.i48.7225.
9. Lok AS, Mcmahon BJ. Chronic hepatitis B. Hepatology. 2007;45(2): 507–39.
10. Hara AK, Burkart DJ, Johnson CD, Felmlee JP, Ehman RL, Ilstrup DM, et al. Variability of consecutive in vivo MR flow measurements in the main portal vein. AJR Am J Roentgenol. 1996;166(6):1311–5,
http://dx.doi.org/10.2214/ajr.166.6.8633438.
11. Li R, Chen TW, Hu J, Guo DD, Zhang XM, Deng D, et al. Tumor volume of resectable adenocarcinoma of the esophagogastric junction at multi-detector CT: association with regional lymph node metastasis and N stage. Radiology. 2013;269(1):130–8, http://dx.doi.org/10.1148/radiol.
13122269.
12. Tsochatzis EA, Bosch J, Burroughs AK. Liver cirrhosis. Lancet. 383(9930): 1749–61.
13. Das V, Boelle PY, Galbois A, Guidet B, Maury E, Carbonell N, et al. Cirrhotic patients in the medical intensive care unit: early prognosis and long-term survival. Crit Care Med. 2010;38(11):2108–16, http://dx.doi.
org/10.1097/CCM.0b013e3181f3dea9.
14. Conn HO. A peek at the Child-Turcotte classification. Hepatology. 1981; 1(6):673–6, http://dx.doi.org/10.1002/(ISSN)1527-3350.
15. Le Bihan D. Intravoxel incoherent motion perfusion MR imaging: a wake-up call. Radiology. 2008;249(3):748–52, http://dx.doi.org/10.1148/radiol.
2493081301.
16. Chung S, Kim KE, Park MS, Bhagavatula S, Babb J, Axel L. Liver stiffness assessment with tagged MRI of cardiac-induced liver motion in cirrhosis patients. J Magn Reson Imaging. 2014;39(5):1301–7, http://dx.doi.org/
10.1002/jmri.24260.
17. Desmet VJ, Roskams T. Cirrhosis reversal: a duel between dogma and myth. J Hepatol. 2004;40(5):860–7, http://dx.doi.org/10.1016/j.jhep.
2004.03.007.
18. Lewin M, Poujol-Robert A, Boëlle PY, Wendum D, Lasnier E, Viallon M, et al. Diffusion-weighted magnetic resonance imaging for the assessment of fibrosis in chronic hepatitis C. Hepatology. 2007; 46(3): 658–65.
19. Bakan AA, Inci E, Bakan S, Gokturk S, Cimilli T. Utility of diffusion-weighted imaging in the evaluation of liver fibrosis. Eur Radiol. 2012;22 (3):682–7, http://dx.doi.org/10.1007/s00330-011-2295-z.
20. Dale BM, Braithwaite AC, Boll DT, Merkle EM. Field strength and diffusion encoding technique affect the apparent diffusion coefficient measurements in diffusion-weighted imaging of the abdomen. Invest Radiol. 2010;45(2):104–8, http://dx.doi.org/10.1097/RLI.0b013e3181c8ceac.
21. Szafer A, Zhong J, Anderson AW, Gore JC. Diffusion-weighted imaging in tissues: theoretical models. NMR Biomed. 1995;8(7-8): 289–96, http://dx.
doi.org/10.1002/(ISSN)1099-1492.
22. Ikegami T, Shimada M, Imura S, Soejima Y, Yoshizumi T, Hanaoka J, et al. The changes of the medial right lobe, transplanted with left lobe liver graft from living donors. Transplantation. 2009;87: 698–703, http://dx.doi.org/
10.1097/TP.0b013e318195c2a3.
23. Kim BK, Han KH, Park JY, Ahn SH, Chon CY, Kim JK, et al. A novel liver stiffness measurement-based prediction model for cirrhosis in hepatitis B patients. Liver Int. 2010;30(7):1073–81, http://dx.doi.org/10.1111/liv.2010.30.
issue-7.
24. Nilsson H, Blomqvist L, Douglas L, Nordell A, Janczewska I, Näslund E, et al. Gd-EOB-DTPA-enhanced MRI for the assessment of liver function and volume in liver cirrhosis. Br J Radiol. 2013;86(1026): 20120653, http://dx.doi.org/10.1259/bjr.20120653.
25. Hagiwara M, Rusinek H, Lee VS, Losada M, Bannan MA, Krinsky GA, et al. Advanced liver fibrosis: diagnosis with 3D whole-liver perfusion MR imaging--initial experience. Radiology. 2008;246(3):926–34,
http://dx.doi.org/10.1148/radiol.2463070077.