Original Article
Artigo Original
Relationship between electrical activity of
the temporal and masseter muscles, bite
force, and morphological facial index
Relações entre potenciais elétricos dos
músculos temporais e masseteres, força de
mordida e índice morfológico da face
Deyves Gomes de Melo1
Esther Mandelbaum Gonçalves Bianchini1,2
Keywords
Stomatognathic System Masticatory Muscles Electromyography Bite Force Facial Morphology
Descritores
Sistema Estomatognático Músculos Mastigatórios
Eletromiograia
Força de Mordida Morfologia Facial
Correspondence address:
Deyves Gomes de Melo Central da Saúde
Avenida Lins de Vasconcelos, 1975, Sala 03, São Paulo (SP), Brazil, CEP: 01537-001.
E-mail: [email protected]
Received: January 08, 2015
Accepted: October 05, 2015
Study carried out at Programa de Pós-graduação, Mestrado Proissional em Fonoaudiologia, Universidade Veiga de Almeida – UVA - Rio de Janeiro (RJ), Brazil.
1 Universidade Veiga de Almeida – UVA - Rio de Janeiro (RJ), Brazil. 2 Pontifícia Universidade Católica de São Paulo – PUC - São Paulo (SP), Brazil.
Financial support: Fundação de Amparo à Pesquisa do Estado do Rio de Janeiro - FAPERJ. Original project
FAPERJ APQ1: Tools for the diagnosis of orofacial myofunctional disorders with a multidisciplinary approach:
protocols and detailing of clinical, electromyographic, and bite force analyses. Grant n. E-26/111.518/2011.
Scientiic report approved by FAPERJ on Nov 06, 2013.
Conlict of interests: nothing to declare. ABSTRACT
Purpose: To analyze possible correlations between the electrical activity of masseter and temporal muscles,
Bite Force (BF), and Morphological Facial Indices (MFI). Methods: The study involved 43 young adults, both genders, 18 to 37 years old. The individuals were submitted to: face measurement to calculate MFI; Masseter and Temporal Surface Electromyography (sEMG) and BF measurements on right and left premolars and incisors. The following electromyographic tests were conducted: at rest position; Maximal Voluntary Isometrical Contraction (MVIC) and usual chewing of raisins. Statistical analysis was conducted using the coeficient of Spearman correlation with signiicance level of 5%. Results: The values at rest in the temporal muscles were signiicantly higher than those in the masseter muscles. A meaningful correlation was found between MFI and sEMG in the MVIC test for the Left Temporal (rs=36, p=0.017). A signiicant correlation was observed between
FMI and sEMG during BF in incisors for temporal muscles and the Right Masseter. During the force tests, it was possible to observe a meaningful correlation between BF in right premolars and the sEMG of the Left Temporal
and Masseters. Conclusion: No correlation was found between the sEMG of temporal and masseter muscles, BF, and FMI in adult individuals based on the tests performed. The SEMG of temporal and masseter muscles seems to be associated only with BF. As a datum of habitual postural characteristic, the electrical activity of
temporal muscles is higher than the activity of masseters, also regardless of MFI.
RESUMO
Objetivo: Veriicar e analisar possíveis correlações entre a atividade elétrica dos músculos temporais e masseteres,
a força de mordida e os índices morfológicos da face, em indivíduos adultos. Método: Participaram 43 indivíduos,
adultos jovens de ambos os gêneros, entre 18 e 37 anos, submetidos à mensuração da face para cálculo do Índice Morfológico da Face (IMF), Eletromiograia de Superfície (EMGs) de Masseteres Direitos e Esquerdos (MD e ME), Temporais Direitos e Esquerdos (TD e TE) e obtenção da Força de Mordida (FM) nas regiões de pré-molares direitos, pré-molares esquerdos e incisivos. As provas eletromiográicas realizadas foram em repouso, Contração Voluntária Isométrica Máxima (CVIM) e mastigação habitual de uva-passa. Foi realizada análise estatística pelo coeiciente de correlação de Spearman com signiicância no nível de 5%. Resultados: Os valores de repouso em
TD e TE foram signiicativamente maiores que os de MD e ME. Foi encontrada correlação direta signiicativa entre IMF e a EMGs na prova de CVIM para o TE (rs=36, p=0,017). Observou-se correlação direta signiicativa
entre o IMF com a EMGs durante a FM em Incisivos para os músculos TD, TE e Masseter Direito (MD). Durante as provas de força, foi possível observar correlação direta signiicativa entre a FM em pré-molares direitos com a EMGs do TE, MD, ME. Conclusões: Não foi veriicada correlação entre as respostas elétricas dos músculos
temporais e masseteres, a força de mordida e os índices morfológicos da face, em indivíduos adultos a partir
INTRODUCTION
The mandible and its associated musculature play an important role in the functions of the stomatognathic system. They are
related to various structures ranging from the temporomandibular
joint (TMJ) and the oral structures to the elevator and depressor muscles of the mandible, which enable a variety of movements used in chewing, swallowing, and speech articulation.
Surface Electromyography (sEMG) has become an important complementary method in the search for a more comprehensive evaluation of the muscles of the stomatognathic system, because it captures information about the electrical activity of these muscles. sEMG can assist in determining conducts and demonstrating
results obtained by speciically employed treatments, in addition to adding knowledge to studies on different facial and occlusal
characteristics(1-3).
Likewise, assessment of Bite Force (BF) has been used in functional studies of the masticatory muscles. BF is inluenced by several factors, and it can be measured, among other ways, using a load cell placed between the dental arches, which records the
force being applied by the elevator muscles of the mandible(4,5).
The study of facial morphology is also of great importance
for understanding the pathophysiology of the stomatognathic
system. The functions of this system can occur in distinct ways in the various face types due to the relationship between hard and soft tissues, associated with genetic pattern and the various inluences of craniofacial growth.
Considering that distinct facial types can deine functional differences related to the dimensional aspects of the face, as well as to the muscular variations associated with these aspects(6-10),
it seems appropriate to consider the existence of different
behaviors of the elevator muscles of the mandible according to
face morphology. Little is also known about the relationship of these variables during mastication, as well as about bite force. Thus the main issues underlying this study refer to possible
changes in the behavior of temporal and masseter muscles
with respect to electrical activity and bite force associated with
variations in facial morphology, assuming that such changes
would be expected.
One of the possible classiications of facial morphology refers to the Morphological Facial Index (MFI)(6), which is the
centesimal ratio between the height of the face and its width, given by the bizygomatic diameter. According to this classiication,
MFI values(6) equal to or smaller than 78.9 correspond to an
extremely short and wide face (hypereuryprosopic), whereas values equal to or greater than 93.0 indicate a very long and narrow face (hyperleptoprosopic). In a less exaggerated order, MFI values between 79 and 83.9 denote a short and wide face (euryprosopic), whereas a long and narrow face (leptoprosopic) presents values between 88 and 92.9. Faces showing harmony between height and width have MFI values ranging from 84 to 87.9
(mesoprosopic)(1).
Studies on MFI are available in the speciic literature(7-10), but little can be found on the investigation of the associations
between MFI and orofacial functions, or on its relations with electromyography of the masticatory muscles, or with BF.
Some studies(11-14) on different facial types using sEMG report a
correlation between facial morphology and the electromyographic
response of temporal (anterior bundle) and masseter muscles for some types of electromyographic tests(11-14).
The morphological features of the face and their association with BF are reported in some studies(15,16). A study with children(15)
showed a strong correlation between craniofacial morphology
and BF only in boys, suggesting that this difference may be
related to the different degrees of growth between genders. That study(15) discards correlation with the different occlusal
situations, considering the Angle classiication, as well as with
variations of the head position. In a study involving Jordanian adults(16), researchers assessed BF in different facial types and
identiied signiicant differences between the facial patterns. The study shows that BF is smaller in individuals with long faces and greater in those with short faces(16).
Correlation between BF and sEMG was reported in a study(17)
which observed a reliable association between electromyographic
activity of the masseter and temporal muscles and BF in incisors and molars.
Based on the previously exposed facts, the investigation of
the behavior of temporal and masseter muscles and the analysis
of the possible correlations with respect to their electrical activity and BF, as well as with whether variations in facial
morphology represent an interference, can provide guiding data
for myofunctional characterization, especially for adults whose MFI are already fully deined and stable.
The purpose of this study was to investigate and analyze the possible correlations between the electrical activity of
masseter and temporal muscles, bite force, and morphological facial indices. In this sense, it aims to seek data to improve understanding on the behavior of masticatory muscles that can contribute to the process of diagnosis and conduct of orofacial myofunctional disorders.
METHODS
The research was conducted at the Laboratory of Surface Electromyography of the Graduate Program in accordance with the protocol (CEP-203.381) approved by the Ethical Research
Committee of the institution.
Forty-three consecutive subjects, young adults of both
genders, aged 18-37 years (mean 24.2) participated in the study.
The volunteers signed a free prior informed consent form. The inclusion criteria were age range of 18-45 years and
clinically healthy dentition.
The exclusion criteria were as follows: self-reported orofacial
functional complaints; dental or occlusal abnormalities such as
spaces due to anterior and/or posterior dental laws, anterior
or posterior open bite, and anterior or posterior crossbite;
anteroposterior maxillomandibular disproportion; orthodontic
treatment; facial trauma or surgery involving the musculoskeletal system of the face; symptoms and/or signs of temporomandibular
Motricity, who jointly and immediately analyzed and discussed
the compatibility of the volunteers submitted to the Protocol of Orofacial Myofunctional Evaluation and Anamnesis(18).
The veriication of possible occlusal and/or skeletal alterations, as well as signs of TMD - identiied in this study as exclusion criteria - was conducted through clinical inspection and joint
analysis(18) by the SLP examiners.
Volunteers who met all the criteria for inclusion in the study were submitted to face measurement procedures, surface
electromyography, and bite force measurement.
A digital pachymeter (Western PRO, DC-6 150 mm) adapted for bizygomatic reach was used to obtain the anthropometric data of the face. Assessment of the face was conducted with the individuals seated, with their teeth at normal intercuspal
position, and their heads guided in the Frankfurt Horizontal
Plan. The height and width of the face were recorded with three
repetitions(18) by the same examiner, and the results found were
used to calculate the arithmetic mean of these two variables. The respective obtained means conigured the values considered
for calculation of the MFI.
sEMG recordings and BF measurements were registered using the equipment Miotool 200/400 USB; 4 channels; 14-bit resolution; acquisition rate of 2000 samples per channel per second; noise <2 LSB; common mode rejection of 110 dB; and Data Acquisition System SDC500, MIOGRAPH software and USB 2.0, (Miotec Biomedical Equipment Ltda., Porto Alegre - Brazil) using a 20–500 Hz ilter.
For acquisition of the sEMG signal, we used a disposable SDS 500 bipolar electrode positioned at ixed distance of 1.5 cm, manufactured in polyethylene foam with hypoallergenic
medicinal adhesive, adherent solid gel, bipolar contact made of Ag/AgCl (silver/silver chloride) according to the recommended protocol(19). The reference mono-polar electrode Meditrace™
100 Pediatric Ag/AgCl, disposable, with solid gel (hydrogel) was used to eliminate acquisition interferences.
BF was assessed using a SDS1000 sensor connected to the
previously mentioned Miotool system and a 20 mm diameter, 15 mm thick, 200 kg capacity load cell (bite-force transducer) Miotec® manufactured. The transducers were coated with
PVC ilm and placed inside disposable latex inger cots, which were replaced at each test, thus fulilling the basic criteria for biosecurity. Readings were recorded in KgF (Kilogram-Force).
Participants were instructed with respect to the sEMG and BF test procedures. Palpation of the face area was performed to identify the exact location to attach the electrodes. After that, the skin was prepared through gentle abrasion sanding; it was then cleaned with gauze soaked in 70 °GL alcohol(19).
Attachment of the bipolar electrodes was performed in parallel to the ibers on the temporal (anterior bundle, predominantly) and masseter muscles, bilaterally. The reference electrode was placed at the distal extremity of the right or left humerus
bone(19). The four sensors and the reference cord were eventually connected.
In all tests, examination gloves were used and discarded after the examination of each individual. All the procedures listed were performed by a single examiner. The review of procedures and recordings was performed immediately by two other examiners who monitored the tests, as in the previous work(20),
aiming to ensure the correct completion of all phases. In case
of non-agreement of the two evaluators with the examiner on the quality of the signal detected, the test was repeated until a general consensus about its quality was achieved.
The BF tests were performed in between the sEMGs in order
to prevent the BF investigation from overburdening the muscles
and, consequently, interfering with the results.
Description of the tests:
- Bite Force Measurement on Right (BFRP) and Left (BFLP) Premolars and Incisors (BFI). For the irst BF measurement, the load cell was placed between the dental arches at the region of the right premolars. The participant was asked to
accommodate the load cell in order to bite it in the central
region. The participant was instructed to exert maximum bite force for ive seconds, for three consecutive times, with rest intervals of also ive seconds. The bite with the highest amplitude and regularity was chosen considering possible instabilities to bite exactly the center of the load cell. The procedure was completed by recording the average in Kgf (kilogram-force) for the central time period of two
seconds of the selected bite.
The same procedures were followed for the region of the
left premolars and incisors, but the measurement at the latter
region was conducted ive minutes after the electromyographic
evaluation of mastication.
sEMG data were recorded during the BF measurements for later analysis of the relation between these two variables and between the sEMG during BF and the MFI. The period of two seconds of the selected test was considered for analysis of sEMG during BF. The same procedure was adopted for analysis
in the three dental regions evaluated.
With regard to the units of measure, for purposes of comparison
with other studies, values in Newton (N) and in Kilogram-force (Kgf) were referenced.
- sEMG testing: recordings were obtained in raw signal and
analyzed in rectiied signal - Root Mean Square (RMS). - sEMG at habitual position (at rest): The participant was
instructed to remain as relaxed as possible, without making any movement for ifteen seconds. The average of values in microvolts (μV) recorded for ifteen seconds were considered. Subsequently, these igures were normalized in order to
obtain values in percentage(21).
- Maximum Voluntary Isometric Contraction (MVIC): Aiming
to reduce possible occlusal interferences and register the
MVIC, cotton rolls were placed in the intercuspal region
of molars and premolars bilaterally to avoid direct contact
- Habitual Mastication: The participant was instructed to habitually chew three raisings at the examiner’s command. Test recording was conducted simultaneously with mastication, stopping after complete swallowing of the food bolus. The recording corresponding to the complete chewing, from irst to last masticatory cycles, was selected and displayed in RMS to obtain the average in µV, which was subsequently
used for normalization.
After this test, the participant remained at rest for ive minutes
before performing the MFI assessment.
Statistical analysis
Inferential statistical analysis used the Spearman’s correlation coeficient to verify signiicant association between the study variables. Nonparametric tests were applied to the variables
that did not present Gaussian distribution because of large
dispersion and rejection of the normality hypothesis according to the Kolmogorov-Smirnov and/or Shapiro-Wilk tests. All statistical tests were done at a level of 5% for signiicance
(p<.05). The statistical analysis was process by the SAS 6.11
software (SAS Institute, Inc., Cary, NC).
RESULTS
The MFI assessment showed predominance of hyperleptoprosopic participants (37.74%), followed by leptoprosopic (30.23%), mesoprosopic (11.63%) and euryprosopic (11.63%) individuals.
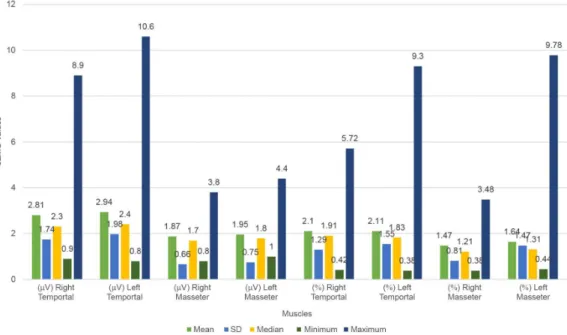
Regarding the sEMG, the descriptive presentation of the results in microvolts (μV) and in normalized data (%) is given
in Graphics 1, 2 and 3.
Graphic 1. Description of data at rest, in microvolts (µV) and normalized (%)
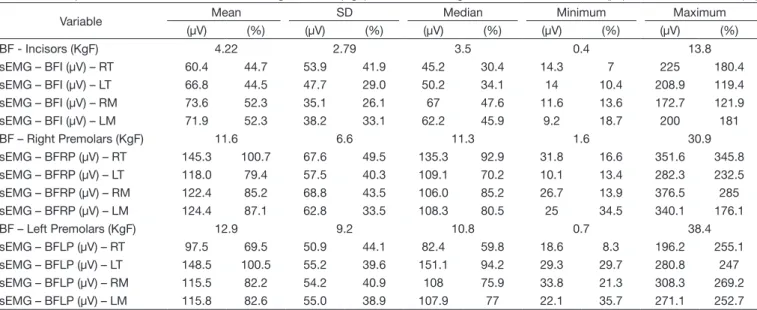
With respect to BF, Table 1 shows the descriptive presentation of the results in kilogram-force (kgf) and the sEMG data during
execution of the bite force test.
Possible correlations between the variables were investigated
by statistical studies. Table 2 shows the results regarding the
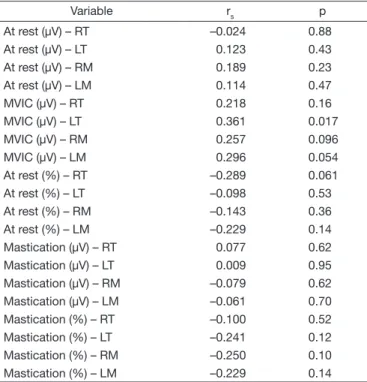
relationship between the MFI and sEMG variables. Signiicant direct correlation was found between MFI and sEMG in the
MVIC test only for the left temporalis (rs=36, p=0.017).
Table 3 shows the study of the correlation between MFI and the BF variable. No correlation was found between the MFI
score and BF in the dental regions analyzed.
Table 4 presents the correlation between MFI and sEMG. Signiicant direct correlation was observed between the MFI
score and sEMG during the BF evaluation in the incisors for
the left (LT) and right (RT) temporal and right masseter (RM) muscles, showing that the higher the MFI score, the higher the
value in microvolts of the MVIC in these muscles.
As shown in Table 5, signiicant direct correlation was observed between BF in the right premolars and the sEMG of the LT, RM and LM muscles when the BF in the three regions analyzed is correlated with the percentage values (normalized) of the sEMG conducted during the force tests. These data indicate
Graphic 3. Description of mastication data, in microvolts (µV) and normalized (%)
Table 1. Description of the results of Bite Force in kilogram-force (KgF) and sEMG during the bite test, in microvolts (µV) and normalized data (%)
Variable Mean SD Median Minimum Maximum
(µV) (%) (µV) (%) (µV) (%) (µV) (%) (µV) (%)
BF - Incisors (KgF) 4.22 2.79 3.5 0.4 13.8
sEMG – BFI (µV) – RT 60.4 44.7 53.9 41.9 45.2 30.4 14.3 7 225 180.4
sEMG – BFI (µV) – LT 66.8 44.5 47.7 29.0 50.2 34.1 14 10.4 208.9 119.4
sEMG – BFI (µV) – RM 73.6 52.3 35.1 26.1 67 47.6 11.6 13.6 172.7 121.9
sEMG – BFI (µV) – LM 71.9 52.3 38.2 33.1 62.2 45.9 9.2 18.7 200 181
BF – Right Premolars (KgF) 11.6 6.6 11.3 1.6 30.9
sEMG – BFRP (µV) – RT 145.3 100.7 67.6 49.5 135.3 92.9 31.8 16.6 351.6 345.8
sEMG – BFRP (µV) – LT 118.0 79.4 57.5 40.3 109.1 70.2 10.1 13.4 282.3 232.5
sEMG – BFRP (µV) – RM 122.4 85.2 68.8 43.5 106.0 85.2 26.7 13.9 376.5 285
sEMG – BFRP (µV) – LM 124.4 87.1 62.8 33.5 108.3 80.5 25 34.5 340.1 176.1
BF – Left Premolars (KgF) 12.9 9.2 10.8 0.7 38.4
sEMG – BFLP (µV) – RT 97.5 69.5 50.9 44.1 82.4 59.8 18.6 8.3 196.2 255.1
sEMG – BFLP (µV) – LT 148.5 100.5 55.2 39.6 151.1 94.2 29.3 29.7 280.8 247
sEMG – BFLP (µV) – RM 115.5 82.2 54.2 40.9 108 75.9 33.8 21.3 308.3 269.2
sEMG – BFLP (µV) – LM 115.8 82.6 55.0 38.9 107.9 77 22.1 35.7 271.1 252.7
that the greater the BF in the right premolars, the higher the
percentage value (normalized) expected for the sEMG in the
aforementioned muscles (Table 5).
DISCUSSION
Although we can currently count on advanced technology to
accurately and reliably perform morphological evaluations(22-24), the use of pachymeters and other instruments to measure soft
tissues have demonstrated their value owing to their fast and inexpensive application, as well as to the possibility of obtaining acceptably reliable measures, provided that the examiners have
had prior theoretical and practical training(25-27).
Previous studies have investigated MFI both separately and
together with other parameters, with different goals, including the attempt to demonstrate the unique morphological characteristics of some speciic geographic regions and ethnic groups(7-10). These
studies have shown differences in the frequency of facial groups
found according to the country or the region of a country studied, demonstrating that there is acceptable sensitivity regarding this
index in the differentiation between some ethnic groups. In the
present study, based on data from consecutive participants,
we found prevalence of hyperleptoprosopic and leptoprosopic individuals. Despite the fact that the study was conducted in a single region (Rio de Janeiro), it is not possible to infer that the characterization of the MFI achieved relects the ethnic factor
of the local population, considering the small sample size.
Analysis of the relation between the MFI variables and the sEMG data investigated in this study showed a signiicant direct
correlation in the MVIC test only for the left temporalis; it is not possible to interpret this datum considering that correlation is observed only for one of the muscles in only one of the sides.
Table 2. Correlation between the MFI score and sEMG
Variable rs p
At rest (µV) – RT –0.024 0.88
At rest (µV) – LT 0.123 0.43
At rest (µV) – RM 0.189 0.23
At rest (µV) – LM 0.114 0.47
MVIC (µV) – RT 0.218 0.16
MVIC (µV) – LT 0.361 0.017
MVIC (µV) – RM 0.257 0.096
MVIC (µV) – LM 0.296 0.054
At rest (%) – RT –0.289 0.061
At rest (%) – LT –0.098 0.53
At rest (%) – RM –0.143 0.36
At rest (%) – LM –0.229 0.14
Mastication (µV) – RT 0.077 0.62
Mastication (µV) – LT 0.009 0.95
Mastication (µV) – RM –0.079 0.62
Mastication (µV) – LM –0.061 0.70
Mastication (%) – RT –0.100 0.52
Mastication (%) – LT –0.241 0.12
Mastication (%) – RM –0.250 0.10
Mastication (%) – LM –0.229 0.14
Captions: rs: Spearman’s correlation coefficient; p: level of significance; RT: right temporal muscle; LT: left temporal muscle; RM: right masseter muscle; LM: left masseter muscle
Table 3. Correlation between the MFI scores and BF
Variable rs pP
Bite Force – Incisors (KgF) –0.079 0.62
Bite Force – Right Premolars (KgF) –0.109 0.48
Bite Force – Left Premolars (KgF) 0.141 0.37
Captions: rs: Spearman’s correlation coefficient; p: significance level; KgF: kilogram-force
Table 4. Correlation between the MFI scores and sEMG during BF
Variable rs p
sEMG – Force - Incisors (µV) – RT 0.523 0.0003
sEMG – Force - Incisors (µV) – LT 0.354 0.019
sEMG – Force - Incisors (µV) – RM 0.365 0.016
sEMG – Force - Incisors (µV) – LM 0.240 0.12
sEMG – Force - Incisors (%) – RT 0.297 0.053
sEMG – Force - Incisors (%) – LT 0.141 0.37
sEMG – Force - Incisors (%) – RM 0.138 0.38
sEMG – Force - Incisors (%) – LM –0.080 0.61
sEMG – Force - Right Premolars (µV) – RT 0.142 0.36
sEMG – Force - Right Premolars (µV) – LT 0.248 0.10
sEMG – Force - Right Premolars (µV) – RM 0.031 0.84
sEMG – Force - Right Premolars (µV) – LM 0.104 0.51
sEMG – Force - Right Premolars (%) – RT –0.077 0.62
sEMG – Force - Right Premolars (%) – LT –0.055 0.73
sEMG – Force - Right Premolars (%) – RM –0.137 0.38
sEMG – Force - Right Premolars (%) – LM –0.214 0.17
sEMG – Force - Left Premolars (µV) – RT 0.130 0.41
sEMG – Force - Left Premolars (µV) – LT 0.112 0.47
sEMG – Force - Left Premolars (µV) – RM 0.076 0.63
sEMG – Force - Left Premolars (µV) – LM 0.124 0.43
sEMG – Force - Left Premolars (%) – RT –0.050 0.75
sEMG – Force - Left Premolars (%) – LT –0.281 0.068
sEMG – Force - Left Premolars (%) – RM –0.073 0.64
sEMG – Force - Left Premolars (%) – LM –0.185 0.24
Captions: rs: Spearman’s correlation coefficient; p: significance level; RT: right temporal muscle; LT: left temporal muscle; RM: right masseter muscle; LM: left masseter muscle
Table 5. Correlation between BF and sEMG
Correlation rs p
BF in Incisors (KgF)
x sEMG (%) – RT –0.194 0.21
x sEMG (%) – LT 0.039 0.80
x sEMG (%) – RM 0.033 0.83
x sEMG (%) – LM 0.139 0.37
BF in Right Premolars (KgF)
x sEMG (%) – RT 0.253 0.10
x sEMG (%) – LT 0.504 0.0006
x sEMG (%) – RM 0.438 0.003
x sEMG (%) – LM 0.310 0.042
BF in Left Premolars (KgF)
x sEMG (%) – RT 0.013 0.93
x sEMG (%) – LT 0.121 0.44
x sEMG (%) – RM 0.203 0.19
x sEMG (%) – LM 0.234 0.13
Previous studies which also used normalized sEMG data have
reported varying results. In a study that assessed different facial types(1), the authors found no relation between facial type and electrical activity in clenching, but found correlation in the
right temporalis at rest. Such correlation at rest was reported in
another study(13) which found differences in electromyography
between different facial types. However, as in the present study, no correlation or differences were found during the isotonic
contraction observed in mastication(13). In this sense, the data
obtained in this study are in agreement with those of the
previous study(12), in which no correlation was found between the MFIs and electromyography during mastication and at rest. In contrast, some authors(27) have observed signiicant correlation
between such variables both at rest and in the MVIC test for all analyzed muscles, and these data are not consistent with the results of the present study. It is worth noting that the studies
aforementioned used different methods of facial assessment
and electromyographic data collection, as well as different
normalization procedures(22,28,29). Those authors agree that the conversion of data in microvolts to percentage values, based on
a speciic maximum activation value (normalization), should be used to eliminate inluences from the recording conditions
of the electromyographic signal(22,28,29).
In this study, correlation between MFI and BF was also not
observed in the dental regions assessed. A previous study(29) reported opposite results, concluding that facial morphology
does inluence bite force. Some authors(13) have also found
signiicant differences between young subjects with short and
medium, medium and long, short and long faces, demonstrating
that facial morphology inluences BF in these populations. In addition to inluential factors, such as the relation between
the nervous, musculoskeletal and dentoalveolar systems and mandibular biomechanics(4,5), several other factors can inluence BF, e.g., age, gender, interocclusal distance, length and thickness of muscle, etc(5,15,29). It should be noted that the cited studies
were performed using different instruments and methods, which
may have generated different mandibular positions and changes in the muscle length for more or for less of the ideal aspects during the bite(29), explaining the variations between the results of this and other studies.
With respect to the relation between MFI and sEMG during BF, no correlation was observed using the normalized values in the dental region examined. However, signiicant direct correlation was found between the MFI score and the sEMG data
during BF in incisors, using absolute values in microvolts, in the
RT, LT and RM muscles, showing that the higher the MFI, the greater the expected value in μV for these muscles during bite in the incisors. These data may clarify some doubts regarding differences between the studies analyzed(13,22,28,29), given that
many of them presented non-normalized data, whereas others
performed normalization.
In the present study, signiicant direct correlation between BF and sEMG was observed only during bite on the right side. The statistical analysis showed that the greater the force exerted, the higher the electrical activity in the LT, RM and LM muscles. This datum suggests that the impact of unilateral electrical
activity in the temporal muscles is more closely related to the
contralateral side, whereas it maintains bilateral inluence on the masseter muscles. It is not precisely known what could justify
this correlation on only one of the sides; the right side in the
case of this study. The methods and instruments used and the
results obtained do not provide data for analysis. Further studies
are suggested for veriication of the dominant side and detailed
analysis of the occlusion, aiming to associate the items that may
have inluenced these results; studies involving speciically facial morphology and BF, with acquisition of electromyographic values not yet found that would enable greater explanations.
Considering that, in general, studies using surface electromyography present very high standard deviations,
further research should be conducted with larger samples and grouping analysis of similar patterns. Also, studies speciically considering the anteroposterior maxillomandibular relation should be conducted to analyze whether this variable interferes
in electrical activity and bite force.
CONCLUSION
Based on the methodology employed, we conclude that: No correlation was found between the sEMG of temporal
and masseter muscles, BF, and FMI in adult individuals based on the tests performed.
The sEMG of temporal and masseter muscles seems to be associated only with BF, and the greater the bite force in the
region of premolars, the higher the electrical activity in the temporal muscle contralateral to the load and in both masseter
muscles. However, this datum is observed only for bite force
on the right side.
As a datum of habitual postural characteristic, the electrical activity of temporal muscles is higher than that of the masseter muscles, also regardless of FMI.
REFERENCES
1. Cha BK, Kim CH, Baek SH. Skeletal Sagittal and vertical facial types and electromyographic activity of the masticatory muscle. Angle Orthod. 2007;77(3):463-70. http://dx.doi.org/10.2319/0003-3219(2007)077[0463:SS
AVFT]2.0.CO;2. PMid:17465654.
2. Tartaglia GM, Grandi G, Mian F, Sforza C, Ferrario VF. Non-invasive 3d facial analysis and surface electromyography during functional pre-orthodontic therapy: a preliminary report. J Appl Oral Sci. 2009;17(5):487-94. http://
dx.doi.org/10.1590/S1678-77572009000500025. PMid:19936531. 3. Masci C, Ciarrocchi I, Spadraro A, Necozione S, Marci MC, Monaco A.
Does orthodontic treatment provide a real functional improvement? A case control study. BMC Oral Health. 2013;24:13-57.
4. Varga S, Spalj S, Varga ML, Milosevic SA, Mestrovic S, Slaj M. Maximum
voluntary molar bite force in subjects with normal occlusion. Eur J Orthod.
2011;33(4):427-33. http://dx.doi.org/10.1093/ejo/cjq097. PMid:21062965. 5. Palinkas M, Nassar MSP, Cecílio FA, Siéssere S, Semprini M, Machado-de-Sousa JP, et al. Age and gender influence on maximal bite force and masticatory muscles thickness. Arch Oral Biol. 2010;55(10):797-802.
http://dx.doi.org/10.1016/j.archoralbio.2010.06.016. PMid:20667521. 6. Ávila JB. Antropologia Física: introdução. Rio de Janeiro: Livraria Agir;
1958.
7. Pandey AK. Cephalo-facial variation among onges. Antrhopologist. 2006;8(4):245-9.
8. Shah S, Pandya P, Vadgama J, Chavda S, Rathod SP, Patel SV. The study of
9. Jeremić D, Kocić S, Vulović M, Sazdanović M, Sazdanović P, Jovanović B, Jovanović J, Milanović Z, Đonović N, Simović A, Parezanović-ilić K,
Maliković A, Toševski J, Živanović-mačužić I. Anthropometric study of
the facial index in thepopulation of central serbia. Arch Biol Sci Belgrade.
2013;65(3):1163-1168.
10. Mani R. Comparative study of facial index of rajput community of bikaner
district of rajasthan and other communities and races. AJBPS.
2013;3(20):5-7.
11. Miranda ALR, Vieira MM, Bommarito S, Chiari BM. Avaliação da atividade
eletromiográfica do músculo masseter em diferentes tipos faciais. Rev
Odontol. 2009;17(33):17-25.
12. Vianna-Lara MS, Caria PHF, Tosello DO, Lara F, Amorim MM.
Electromyographic activity of masseter and temporal muscles with
different facial types. Angle Orthod. 2009;79(3):515-20. http://dx.doi. org/10.2319/012308-41.1. PMid:19413373.
13. Alhaija ESJA, Al Zo’ubi IA, Al Rousan ME, Hammad MM. Maximum
occlusal bite forces in Jordanian individuals with different dentofacial
vertical skeletal patterns. Eur J Orthod. 2010;32(1):71-7. http://dx.doi.
org/10.1093/ejo/cjp069. PMid:19684125.
14. Ramires RR, Ferreira LP, Marchesan IQ, Cattoni DM, Silva MAA.
Tipologia facial aplicada à Fonoaudiologia: revisão de literatura. Rev
Soc Bras Fonoaudiol. 2010;15(1):140-5. http://dx.doi.org/10.1590/S1516-80342010000100023.
15. Sonessen L, Bakke M. Molar bite force in relation to occlusion, craniofacial dimensions, and head posture in pre-orthodontic children. Eur J Orthod. 2005;27(1):58-63. http://dx.doi.org/10.1093/ejo/cjh069. PMid:15743864. 16. Gonzalez Y, Iwasaki LR, McCall WD Jr, Ohrbach R, Lozier E, Nickel
JC. Reliability of electromyographic activity vs. bite-force from human masticatory muscles. Eur J Oral Sci. 2011;119(3):219-24. http://dx.doi.
org/10.1111/j.1600-0722.2011.00823.x. PMid:21564316.
17. Bianchini EMG. Avaliação fonoaudiológica da motricidade orofacial:
anamnese, exame clínico, o quê e por que avaliar. In: Bianchini EMG, organizadores. Articulação Temporomandibular: implicações, limitações
e possibilidades fonoaudiológicas. 2. ed. Barueri: Pró-Fono; 2010. p. 193-256.
18. Genaro KF, Berretin-Felix G, Rehder MIBC, Marchesan IQ. Avaliação
miofuncional orofacial: protocolo MBGR. Rev. CEFAC.
2009;11(2):237-55. http://dx.doi.org/10.1590/S1516-18462009000200009.
19. Hermens HJ, Freriks B, Disselhorst-Klug C, Rau G. Development of recommendations for SEMG sensors and sensor placement procedures.
J Electromyogr Kinesiol. 2000;10(5):361-74. http://dx.doi.org/10.1016/
S1050-6411(00)00027-4. PMid:11018445.
20. Farias BUL, Bianchini EMG, Paiva JB, Rino J No. Muscular activity in class III dentofacial deformity. Cranio. 2013;31(3):181-9. http://dx.doi. org/10.1179/crn.2013.029. PMid:23971159.
21. Shewman DT. Surface electromyography in temporomandibular dysfunction:
a beginner’s guide to clinical applications. Las Vegas: Advanced Aesthetic and Neuro Muscular Solutions; 2006.
22. Celik E, Polat-Ozsoy O, Toygar Memikoglu TU. Comparison of cephalometric
measurements with digital versus conventional cephalometric analysis.
Eur J Orthod. 2009;31(3):241-6. http://dx.doi.org/10.1093/ejo/cjn105. PMid:19237509.
23. Metzger TE, Kula KS, Eckert GJ, Ghoneima AA. Orthodontic soft-tissue parameters: a comparison of cone-beam computed tomography and the 3dMD Imaging System. Am J Orthod Dentofacial Orthop. 2013;144(5):672-81. http://dx.doi.org/10.1016/j.ajodo.2013.07.007. PMid:24182583. 24. Frainer DES, Adami F, Vasconcelos FAG, Assis MAA, Calvo MCM,
Kerpel R. Padronização e confiabilidade das medidas antropométricas para pesquisa populacional. ALAN. 2007;57(4):335-42.
25. Silva DAS, Pelegrini A, Pires-Neto CS, Vieira MFS, Petroski EL. O
antropometrista na busca de dados mais confiáveis. Rev Bras Cineantropom
Desempenho Hum. 2011;13(1):82-5.
26. Mojtahedzadeh F, Alizadeh S, Riazi B, Shamshiri AR. Measuring the reliability of sagittal facial anthropometric measurements under soft tissue
displacement using a modified ruler. J Dent (Tehran). 2013;10(2):164-8.
PMid:23724216.
27. Tecco S, Crincoli V, Di Bisceglie B, Caputi S, Festa F. Relation between facial morphology on lateral skull radiographs and sEMG activity of head,
neck, and trunk muscles in Caucasian adult females. J Electromyogr Kinesiol.
2011;21(2):298-310. http://dx.doi.org/10.1016/j.jelekin.2010.10.014. PMid:21138792.
28. Hodder JN, Keir PJ. Obtaining maximum muscle excitation for normalizing
shoulder electromyography in dynamic contractions. J Electromyogr Kinesiol.
2013;23(5):1166-73. http://dx.doi.org/10.1016/j.jelekin.2013.06.012. PMid:23871651.
29. Sathyanarayana HP, Premkumar S, Manjula WS. Assessment of maximum
voluntary bite force in adults with normal occlusion and different types of
maloclusions. J Contemp Dent Pract. 2012;13(4):534-8. PMid:23151705.
Author contributions