Inluences of Growth Velocity and Fe Content on Microstructure, Microhardness and
Tensile Properties of Directionally Solidiied Al-1.9Mn-xFe Ternary Alloys
Emin Çadırlıa*, Aynur Akerb, Yusuf Kaygısızc, Mevlüt Şahind
Received: January 17, 2017; Revised: March 15, 2017; Accepted: April 9, 2017
In this study, inluences of growth velocity and composition (Fe content) on the microstructure (rod spacing) and mechanical properties (microhardness, ultimate tensile strength and fracture surface) of Al–Mn–Fe ternary alloys have been investigated. Al–1.9 Mn–xFe (x=0.5, 1.5 and 5 wt. %) were prepared using metals of 99.99% high purity in the vacuum atmosphere. At a constant temperature gradient (6.7 K/mm), these alloys were directionally solidiied upwards under various growth velocities (8.3–978 μm/s) using a Bridgman-type directional solidiication furnace. The results show
that two kinds of Al-rich α-Al phase and Fe-rich intermetallic (Al6FeMn) phase may be present in the
inal microstructures of the alloys when the Fe content increases from 0.5 wt.% to 5 wt.%. Al6FeMn
intermetallic rod spacing, microhardness and ultimate tensile strength were measured and expressed as functions of growth velocity and Fe content by using a linear regression analysis method. According to experimental results, the microhardness and ultimate tensile strength of the solidiied samples increase with increase in the growth velocity and Fe content and decrease in rod spacing. The elongations of the alloys decrease gradually with increasing growth velocity and Fe content.
Keywords: Al alloys, intermetallics, directional solidiication, microhardness, tensile strength, fracture surface
* e-mail: [email protected]
1. Introduction
Among the alloys of the Al–Mn system, also known as the
3XXX alloys series, the most widely used is the 3003 alloy1.
Owing to their good conformability, corrosion resistance, weldability, and allied reasonable mechanical resistance, they are becoming very interesting materials. They are commonly used in the shape of plates and sheets, and can also be extruded or forged, although their use in this form has been limited. Some examples of inal applications are food packing (e.g., cans and domestic utensils), tiles, and heat
exchangers1. One great advantage of these alloys is attributed
to their composition variation and the presence of solute in solid solution. Although their optimum composition has relatively narrow limits, small variations do not substantially afect their manufacture or properties.
In the binary Al-Mn alloy system, the maximum solubility of manganese in the α-solid solution is 1.82 wt.% at the
eutectic temperature of 658.5 oC, the solubility decreasing
with decreasing temperature1-4. Alloys in this group, Al-Mn,
and Al-Mn-Mg, are generally not age-hardenable. These alloys tend to be used when moderate strength combined with high ductility, good weldability, good formability, and excellent corrosion resistance are required. Commercial
Al-Mn alloys generally contain 0.25−1.25 wt.% manganese1,4,5.
In these alloys, Fe and Si are normally present as impurities, and sometimes Cu, Mg and Zn are also added as minor
alloying elements1,3,4. There are three primary phases in the
Al-Fe-Mn system; Al, Al3Fe, and Al6(MnFe)1,6. The maximum
solubility of iron in aluminium is 0.03−0.04 wt.%, and this is unchanged in the ternary alloys. On the other hand, the manganese solubility is decreased. The maximum solubility of manganese in iron-bearing alloys may be approximately
one half of that in the binary aluminium-manganese alloys1.
The binary diagrams have limited application because commercial aluminium alloys always contain appreciable amounts of iron, which signiicantly afect the microstructure. Because of a greater tendency of the Fe atoms to segregate, the intermetallics formed during solidiication contain relatively more Fe than Mn. Al–Mn–Fe and Al–Mn–Fe–Si alloys are important commercial aluminium alloys. They have been used in many industrial sectors and in particular in the rapidly growing aluminium heat exchanger market. The previous works mainly revealed the inluences of the Mn and Fe content on the type and size of diferent Al-Mn
and Al-Mn-Si alloys7-9 or the cooling rate on the evolution of
diferent Al-Mn and Al-Mn-Si alloys during the solidiication
process10,11 separately. Still very limited work has reported
systematically about the inluences of the Fe content, the Fe/Mn ratio and cooling rate on the modiication of Al-Mn and Al-Mn-Si alloys.
a Department of Physics, Faculty of Arts and Sciences, Ömer Halisdemir University, Niğde, Turkey b Department of Computer Instructional Technologies, Faculty of Education, Siirt University, Siirt, Turkey
The aim of the present work is to experimentally
investigate efects of growth velocity (V) and Fe content
(Co) on the microstructure (rod spacing, λ), microhardness
(HV) and ultimate tensile strength (σu) of the directionally
solidiied Al–1.9Mn–xFe alloys (x=0.5, 1.5 and 5 wt. %) under well-controlled experimental conditions.
2. Experimental Procedure
2.1. Sample preparation and directional
solidiication
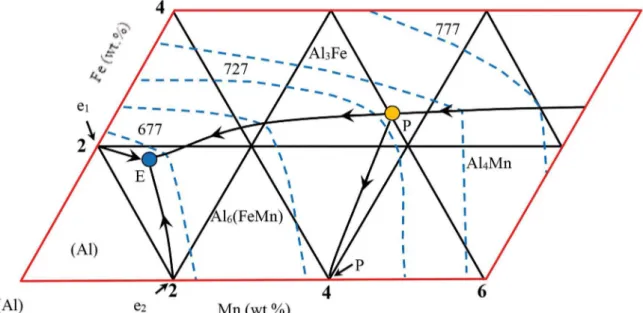
Using the vacuum melting and hot illing furnaces12, 13,
Al–1.9Mn–xFe alloys (x=0.5, 1.5 and 5 wt.%) alloys have been prepared under vacuum atmosphere by using 99.99 % purity metals taking into account the phase diagram as shown
Fig. 114. After allowing time for melt homogenization, the
molten alloy was poured into graphite crucibles (20 cm in length 0.4 cm inner diameter and 0.64 cm outer diameter) held in a specially constructed casting furnace (Hot Filling Furnace) at approximately 50 K above the melting point of alloy. The molten alloy was directionally solidiied from bottom to top to ensure that the crucible was completely full.
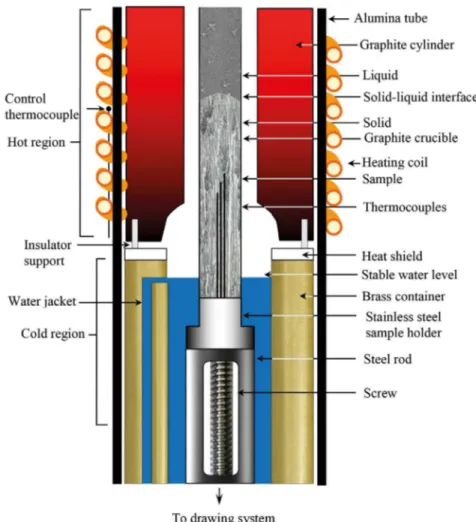
Then, each sample was positioned in a Bridgman-type furnace in a graphite cylinder (Fig. 2). The block diagram of the experimental design and details of the Bridgman–type directional solidiication furnace are given in previous studies12,13. In the experimental technique, the sample was heated about 100 K above the melting temperature and solidiication of the samples was carried out at a constant
temperature gradient, G (6.7 K/mm) under various growth
velocities (8.3–978 μm/s) in a Bridgman-type directional solidiication furnace. After 10 cm steady state growth,
the samples were quenched by rapidly pulling it down into the water reservoir. The temperature of water in the reservoir was kept at 275 K with accuracy of ± 0.1 K by
using a digitalheating / refrigerating circulating bath (Poly
Science-9102 model)to obtain a well quenched solid−liquid
interface in the present work. The sample temperature was also controlled to accuracy of ±0.1 K using a temperature controller (Eurotherm-2604 model). In order to see the
efects of the growth velocity and Fe content on the λ, HV
and σu, directional solidiication experiments were repeated
for each compositions of Al–1.9Mn–xFe alloy (x=0.5, 1.5 and 5 wt. %).
2.2. Measurement of temperature gradient and
growth velocity
The temperatures in the sample were measured by three K-type 0.5 mm in diameter insulated thermocouples which were ixed within the sample with spacing of 5 mm. In this study, A tapered thin alumina tube (120 mm length, 1.9 mm OD × 1.2 mm ID) was used to insulate the thermocouples from the melt. All the thermocouple’s ends were then connected the measurement unit consists of data-logger (Pico TC-08 model) and computer. The cooling rates were recorded with a data-logger via computer during solidiication process. When the solid/liquid interface was at the second thermocouple, the temperature diference between the irst and second thermocouples (∆T) was read from data-logger record. The temperature gradient (G =∆T/∆X) in the liquid phase for each sample was determined by using the measured value of ∆T and ∆X.
The growth velocity (V) was calculated with two diferent
methods. In the irst method, the values of growth velocity
Fig. 2. The Bridgman–type directional solidiication furnace
were calculated from the measurements of the time taken for the solid–liquid interface to pass the thermocouples separated by a known distance. In the second method, the total solidiication time and solidiication distance (on the longitudinal section of the polished sample) were measured. The ratios of the distances to the times were measured to obtain the growth velocities and these were similar for both methods.
2.3. Metallographic analysis
Precise metallographic processes were used to prepare the samples for microstructural analysis.
The quenched sample was removed from the graphite crucible and 1 cm in lengths from the top and bottom were cropped of and discarded. The rest of the sample was ground, polished and etched to reveal the quenched interface. Then, the longitudinal and transverse sections of sample were mounted in a cold-setting epoxy-resin. The longitudinal and transverse sections were wet ground down to grit 4000 and mechanically polished using 6, 3, 1 and 1/4 mm diamond paste (ASTM Standard E3). After the polishing process, the
microstructure was revealed by chemical etching process
(10 mL sulfuric, 5 mL hydroluoric acid and 85 mL H2O
for a 15 seconds at room temperature). The micrographs of
the samples were taken with an optical microscope(Nikon
Eclipse MA 100 inverted model)using diferent objectives.
Eutectic rod spacings (λ) were measured with the Adobe
Photoshop CS3 program, with the magniication factor taken into account.
2.4. Identiication of solid phases and
measurement of eutectic spacings
Scanning electron microscopy with energy dispersive X-ray spectroscopy (SEM/EDX) is the best known and most widely-used of the surface analytical techniques. EDX analysis was performed to determine the composition of the phases in the Al-Mn-Fe alloys at 20 keV using the X-ray lines (LEO 440 model). The EDX and XRD analysis results are given
in detail in section 3.1. Diferent methods15-17 have been
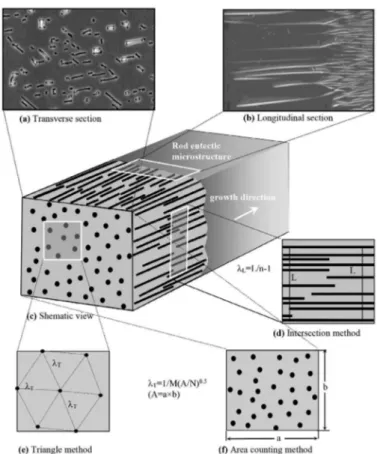
used to measure of eutectic spacings on the microstructure. As can be seen from Fig. 3, the rod or plate-like spacings
Fig. 3. The shematic illustration of rod spacings measurements from the longitudinal and transverse Sections
longitudinal section. Two diferent methods were used to measure the rod spacings on the transverse sections. The irst
method is the triangle method16. The triangle is formed by
joining the three neighbouring rod centers, and each sides
of the triangle corresponded to λ. The second method is the
area counting method17. The rod spacings measured on the
transverse section, λΤ, gave more accurate results than the
rod spacings measured on the longitudinal section, λL. There
might be two reasons for this: irstly, at least ive times more rod spacing can be measured from the transverse section than
the longitudinal section; secondly, λΤ is perpendicular to the
growth direction whereas λL is parallel to the growth direction
and it depends on the polished plane. The measurements on the transverse section were preferred rather than the longitudinal section because of these reasons. As a result, the values of
λT measured on the transverse section are more reliable
than the values of λL measured on the longitudinal section.
2.5. Measurement of microhardness and tensile
strength
The purpose of this investigation was to obtain the
relationships between solidiication parameters (V and
Co) and mechanical properties (HV and σu) of the studied
alloys. Microhardness measurements (all specimens were tested according to ASTM E384) in this work were made
with a Future-Tech FM−700 modelhardness measuring test
device18 using a 300 g load and a dwell time of 10 seconds
giving a typical indentation depth about 30−60 mm. The microhardness values were measured from on the transverse sections of samples. The minimum impression spacing (center to edge of adjacent impression) was about 3 times the diagonal and was located at least 0.5 mm from the edge of sample. To ensure cleanliness the surfaces of the samples
were polished prior to HV measurement. Each reading was an
average of at least ten separate measurements taken randomly on the surface of the samples. The highest and the lowest values of the ten reading were disregarded. Some errors are inevitable during microhardness measurements. These errors are due to factors such as surface quality, inhomogeneities in the microstructure and ambiguity of indenter traces. The estimated error in the microhardness measurements with statistical data analysis is about 5%.
3. Results and Discussion
In order to observe the efect of growth velocity and Fe content on microstructure and mechanical properties of Al–1.9Mn–xFe alloys, eutectic rod spacings, microhardness and tensile strength of alloys were measured with increasing growth velocity and Fe content.
3.1. Microstructure characterization
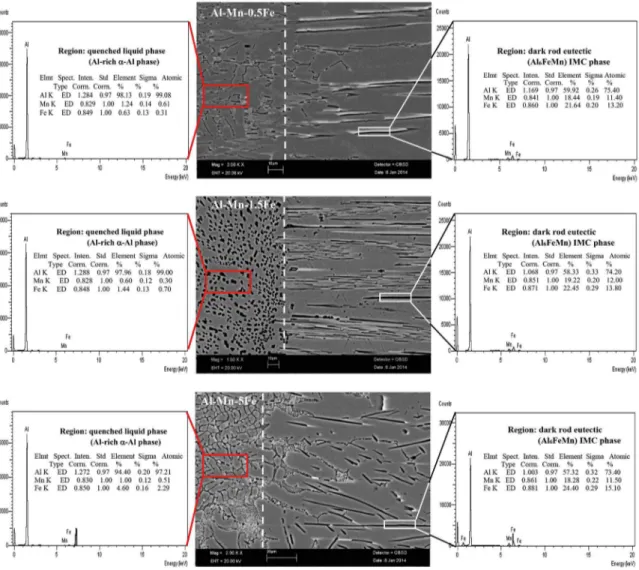
According to EDX results as shown in Fig. 4 and the quantity of components in each phases, dark rod eutectic phase (white rectangular frames) and quenched liquid
phase (red rectangular frames) were identiied as Al6FeMn
intermetallic phase (rod-or plate-like particles) and Al-rich
α-Al phase respectively. The compositions of α-Al phases
are close to nominal compositions. The constituent phases of the samples were identiied by X-ray difraction (XRD)
analysis using a Siemens X-ray difractometer (Model D500)
with Cu Kα (k = 1.79 Ao) radiation at room temperature.
Sample was cut from the ingots and polished to a mirror inish. Measurements were performed by step scanning 2h
from 20o to 65o with a 0.02o step size. A count time of 1 s
per step was used, giving a total scan time of ~1.5 h. Figure 5 shows peaks obtained in the analysis compared with the
JCPDS data and α-Al phase (red squares) and Al6FeMn (black
circles) intermetallic phases have been detected. Dominant
phases in the microstructure were α-Al and Al6FeMn phases.
All these phases were also conirmed in the corresponding microstructure (Fig. 4). Both EDX analysis (Fig. 4) and XRD
pattern (Fig. 5) strongly indicate that only two phases (α-Al
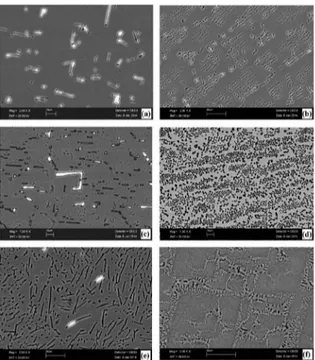
and Al6FeMn) are present in microstructure of the cast sample. Figure 6 shows the microstructures of the studied alloys with Fe content varying from 0.5 wt.% to 5 wt.% in the range of V (8.3-978 μm/s). Microstructures of the studied alloys
consist of α-Al and Al6FeMn intermetallic (rod eutectic
Fig. 5 X-ray difraction patterns obtained from the Al–1.9Mn–5Fe ternary alloy
Fig. 6 Rod eutectic microstructures images of directionally solidiied Al–1.9Mn–xFe alloys at constant G (6.7 K/mm) (a) Al–1.9Mn–0.5Fe (V=8.3 μm/s) (b) Al–1.9Mn–0.5Fe (V=987 μm/s) (c) Al–1.9Mn–1.5Fe (V=8.3 μm/s) (d) Al–1.9Mn–1.5Fe (V=978 μm/s) (e) Al–1.9Mn–5Fe (V=8.3 μm/s) (b) Al–1.9Mn–5Fe (V=978 μm/s)
and plate-like structure) phase. In the case of irregular eutectic structures (plate-like), the minimum and maximum eutectic spacings were measured both longitudinal section (linear intersection method) and transverse section (triangle
methodand area counting method) of samples. Numerous
measurements were taken to improve statistical conidence and the average of these values was used. Increasing the content of Fe and growth velocity, grain size of eutectics
(Al6FeMn intermetallics) reduced and microstructure highly
reined (Fig. 6e-f).
3.2. Efect of growth velocity and composition
(Fe content) on the eutectic rod spacings
As mentioned above, Al–1.9Mn–xFe alloys were also
solidiied with a constant G (6.7 K/mm) in a wide range of
V (8.3–978 mm/s). As can be seen from Fig. 6, rod eutectic
microstructures were observed at diferent V and Co values
for Al–1.9Mn–xFe alloys. At the low values of V (8.3 μm/s)
and Co (0.5 wt.% Fe) the microstructure consists of mainly
coarse rod and plate-like eutectics. At the high values of V
(978 μm/s) and Co (5 wt.% Fe), it is seen that increase in the
V and Co leads to a reined eutectic microstructure. So that,
the coarse rod and plate-like eutectic change into ine rod eutectic. Variations in λwith V at the constant G for diferent
Al–1.9Mn–xFe alloys are shown in Fig. 7a. The variation of
λversus V plot is essentially linear for the growth velocities between 8.3 and 978 μm/s. It can be seen that the points fall
on a family of straight lines each corresponding to a Co. A
linear regression analysis gives the proportionality equation as λ=kV−a. Fig. 7a shows clearly that an increase in V produce a decrease in λ. The values of the growth velocity exponent are equal to 0.39, 0.33 and 0.34 for the Al–1.9Mn–xFe (x=0.5,
1.5 and 5)alloys respectively (see Table 1).
As expected, the formations of the microstructures varied
with the alloy Fe content at a constant G (6.7 K/mm). As the
value of Fe content (Co) was increased, the rod spacings (λ)
Fig. 7 (a)Variation of λ versus V for diferent Fe contents (b)Variation
Composition Relationships Constants (k) Correlation coeicients (r)
Al-Mn-0.5Fe (constant)
λ = k1V
-0.39 k
1=77 (μm
1.39s-0.39) r
1= -0.984
HV=k2λ
-0.11 k
2=20 (kg mm
-1.89) r
2= -0.985
HV=k3V0.04 k3=34 (kg mm-2.04 s0.04) r3= 0.993
σ=k4V0.06 k4=151 (MPa mm-0.06 s0.06) r4= 0.988
Al-Mn-1.5Fe (constant) λ=k5V
-0.33 k
5=38 (μm
1.33s-0.33) r
5= -0.999
HV=k6λ-0.12 k6=22 (kg mm-1.88) r6= -0.975
HV=k7V
0.04 k
7=43 (kg mm
-2.04 s0.04) r
7= 0.974
σ=k8V0.04 k
8=181 (MPa mm-0.04 s0.04) r8= 0.993 Al-Mn-5Fe
(constant) λ=k9V
-0.34 K
9=30 (μm
1.34s-0.34) r
9= -0.979
HV=k10λ
-0.15 k
10=24 (kg mm
-1.85) r
10= -0.998
HV=k11V
0.05 k
11=60 (kg mm
-2.05 s0.05) r
11= 0.983
σ =k12V
0.05 k
12=194 (MPa mm
-0.05 s0.05) r
12= 0.993
Growth velocity (μm/s) Relationships Constants (k) Correlation coeicients (r)
8.3 (constant) λ=k13Co-0.43 k
13=0.024 mm (wt.%Fe)0.43 r13= -0.992
HV=k14Co0.23 k14=33 kgmm-2 (wt.%Fe)-0.23 r14= 0.999
σ=k15Co
0.12 k
15=131 MPa (wt.%Fe)
-0.12 r
15= 0.934
41.6 (constant) λ=k16Co-0.35 k
16=0.015 mm (wt.%Fe)0.35 r16= -0.942
HV=k17Co
0.23 k
17=35 kgmm
-2 (wt.%Fe)-0.23 r
17= 0.997
σ=k18Co0.12 k18=140 MPa (wt.%Fe)-0.12 r18= 0.908
166.3 (constant) λ=k19Co
-0.17 k
19=0.007 mm (wt.%Fe)
0.17 r
19= -0.991
HV=k20Co
0.24 k
20=37 kgmm
-2 (wt.%Fe)-0.24 r
20= 0.998
σ=k21Co
0.12 k
21=152 MPa (wt.%Fe)
-0.12 r
21= 0.942
978.0 (constant) λ=k22Co
-0.37 k
22=0.005 mm (wt.%Fe)
0.37 r
22= -0.998
HV=k23Co0.25 k23=40 kgmm-2 (wt.%Fe)-0.25 r23= 0.997
σ=k24Co0.09 k24=169 MPa (wt.%Fe)-0.09 r24= 0.971
Table 1. The relationships among V, HV, σU, Co, and λ for Al–1.9Mn–xFe alloys
were decreased. Variations in rod spacings with Fe content at
a constant G and various V are given in Fig. 7b. The variation
of λ versus Cois essentially linear on the logarithmic scale.
As can be seen from Fig. 7, the data form straight lines, the linear regression analysis gives the proportionality equation
for constant G and various V. The relationships between the
rod spacings and Fe content were determined by using linear regression analysis. A linear regression analysis gives the
proportionality equation as λ=kCo−b. The exponent values
of Co for λ were found to be -0.43, -0.35, -0.17 and -0.37
for each growth velocities, respectively (see Table 1). The
exponent values of the V (0.33-0.39) are in good agreement
with the values of 0.42, 0,46, 0.42, 0.45 0.44, 0.46 reported
by Wilde et al.19 for Al-Cu-Ag eutectic, Gündüz et al.20 for
Al-Si eutectic, Steinbach and Ratke21 for Al-Si-Mg, Aker et
al.22 for Al-Sb eutectic, Fan et al.23 for Al-Si-Ti and Çadırlı et
al.24 for Al-Cu-Co eutectic, respectively. But, exponent values
of V in this work are slightly lower than the value of 0.50
predicted on the basis of the Jackson–Hunt25 binary eutectic
theory. Until now, there have not any accepted theoretical model for ternary alloys in the literature for compared with experimental results.
3.3. Efect of growth velocity and Fe content on
the microhardness
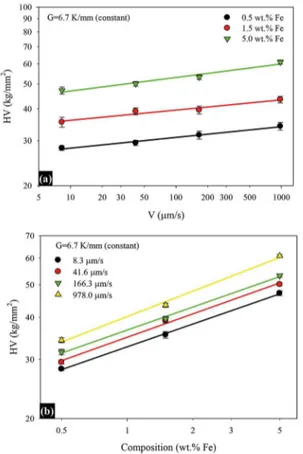
The dependencies of microhardness on the growth velocity, eutectic spacing and composition are given in Fig. 8, and the relationships between these parameters are given in Table 1. As seen in Fig. 8, At a constant temperature gradient (6.7 K/mm), an increase of the growth velocity resulted in increased microhardness (Fig. 8a). When the growth velocity was increased from 8.3 to 978 mm/s, microhardness values increased approximately 21 %, 23% and 29 % for Al–1.9Mn–
xFe (x=0.5, 1.5 and 5)alloys respectively
Some of the studies relating to investigation between composition and microhardness have been found in the literature for diferent alloys, but very few researchers have reported that there is a directly relationship between composition
and microhardness. Figure 8b shows the variation of HV
as a function of Co for various growth velocities. The HV
Fig. 8. (a)Variation of HV versus V for diferent Fe contents (b)
Variation of HV versus Co for diferent V
0.23, 0.23, 0.24 and 0.25 for 8.3, 41.6, 166.3 and 978 μm/s growth velocities, respectively. This average exponent value (0.24) has been compared with the exponent values obtained
in previous works26-30 for the various alloy systems. The
exponent values of Co in this work are close to the values
of 0.24, 0.28 and 0.28 obtained by Shah et al.26, Wang et
al.27 and Çadırlı and Kaya28 for various alloys, respectively.
But, exponent values of composition in this study are smaller than the values of 0.35 and 0.50 obtained by Novinrooz et
al.29 and Maruyama et al.30, respectively. Diferences exist
in the exponent values because of the possible diferences in purity, diferent alloy compositions, solidiication conditions and the surface preparation of the test pieces.
3.4. Efect of growth velocity and Fe content on
the tensile properties
Another purpose of present work was to study the dependency of tensile strength on Fe content (0.5, 1.5 and 5 wt.%) and growth velocity in the range of 8.3–978 μm/s. For this purpose a series of experiments were made. Typical strength-strain curves of Al–1.9Mn–xFe (x=0.5, 1.5 and 5)
alloys are shown in Fig. 9 for diferent V at a constant G for
strain rate (10-3 s-1). As can be seen from Fig.9(a-c), while the
increasing V and Fe content, the values of tensile strength
Fig. 9 Typical tensile strength-strain curves of Al–1.9Mn–xFe alloys for diferent V at a constant G (a) Al–1.9Mn–0.5Fe (b) Al–1.9Mn–1.5Fe (c) Al–1.9Mn–5Fe
increased, but the values of percent elongation (ε) decreased.
Goulart et al.31 carried out directional solidiication experiments
with hypoeutectic Al–Fe alloys, and reported that with the increase in the alloy Fe content higher density of eutectic ibers was observed, which improved the tensile strength but reduced the ductility. This result is good agreement with
our results. In addition, Mukai et al.32 were observed similar
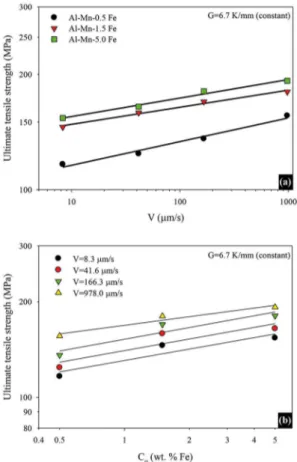
behavior due to increased Fe content for Al-Fe binary alloys. In this study, Al–Mn–Fe alloy containing 5 wt.% Fe shows a higher tensile strength and more brittle feature than the other Al–Mn–Fe alloys. As shown from Fig.10a and Table 1 that
an increase in the growth velocity (V) leads to an increase
Fig. 10. (a) Variation of the ultimate tensile strength with the V for diferent Co (b) Variation of the ultimate tensile strength with the Co for diferent V
The values of σu increase with increasing growth velocity
(Fig. 10a and Table 1). It was found that increasing the V
values from 8.3 mm/s to 978 mm/s, the maximum tensile
strength values increase from 116, 146 and154 MPa to
156, 180 and192 MPa for each composition (0.5, 1.5, and
5 Fe wt.%), respectively. Highest σu values were obtained
for the Al–1.9 Mn-5Fe alloy. The increasing V values, σu
values increased approximately 34%, 24% and 25% for each composition (0.5, 1.5, and 5 Fe wt.%), respectively.
The exponent value of V was found to be 0.06, 0.04 and
0.05 for Al–1.9Mn–xFe (x=0.5, 1.5 and 5)alloys, respectively
(Table 1). The exponent values of V (0.04-0.06) obtained
in this study are in good agreement with the values of 0,05,
0.08, 0.09, 0.04 and 0.07 reported by Çadırlı et al.24 for
Al-Cu-Co eutectic, Aker et al.22 for Al-Sb eutectic, Kaya et
al.33 for Al-Si eutectic, Guo et al.34 for NiAl-28Cr-5Mo-1Hf
(at%), Lapin and Marecek35 for
Ni-21.9Al-8.1Cr-4.2Ta-0.9Mo-0.3Zr (at%), respectively. But, this exponent value is lower than the values of 0.14, 0.15 and 0.16 reported by
Lapin et al.36 for Ti-46Al-2W-0.5Si (at%), Fan et al.37 for
Ti-46Al-0.5W-0.5Si (at%) and Fan et al.38 for Ti-49 at% Al
alloy, respectively.
Figure 10b shows the values of σu as a function of Co.
Highest σu value were obtained for the Al–1.9Mn-5Fe
alloy. The σt value increased from 156 MPa to 192 MPa (σu
values increased approximately 23 %). As evident from the
equations on Table 1, the exponent value of Co is equal to
0.12 (average value).
3.5. Fracture behavior
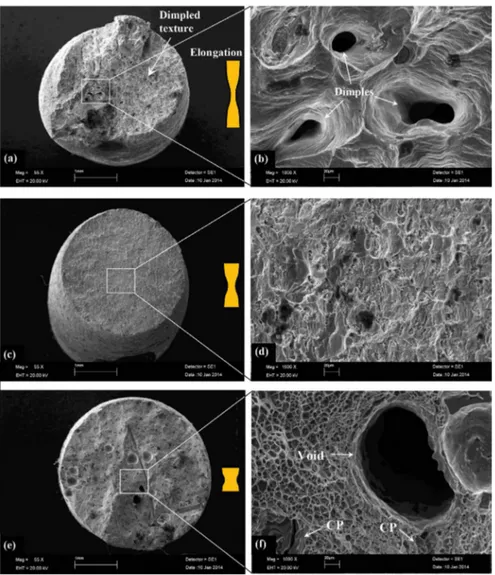
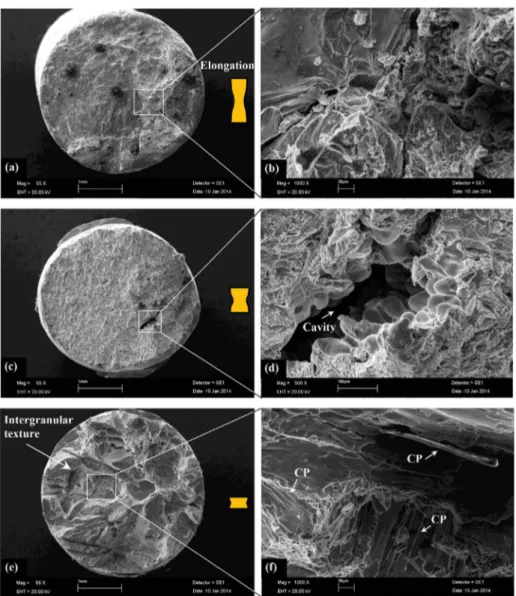
Fracture surface images of the studied alloys were analyzed depending on growth velocity and composition (Fe content) to verify mechanical tests. Figure 11 shows the macroscopic and high magniied appearance of fracture surfaces of the Al–1.9Mn–xFe alloys for lowest growth velocity (8.3 mm/s). These fracture surfaces exhibited a lot of dimples, a characteristic of ductile fracture (Fig. 11b). However, the cleavage fracture feature become more obvious when the Fe content increases from 0.5 wt.% to 5 wt.%. As evident from Fig. 11f, there are some cleavage planes and voids marked with white arrows. Many micro-cracks (white arrows) start from these voids. As can be seen these fractographs, increasing Fe content, the values of percent elongation decreased. Figure 12 shows the macroscopic and high magniied appearance of fracture surfaces of the Al–1.9Mn–xFe alloys for highest growth velocity (978 μm/s). In general, the studied alloys show a clearly macroscopic brittle fracture nature. In particular, in the Al–1.9Mn–1.5Fe and Al–1.9Mn–5Fe alloys, the mode of fracture signiicantly changed from less brittle to more brittle. The formation
of intermetallic phases (Al6FeMn) at the eutectic cells
may provide appropriate sites for crack propagation due to its brittle nature. An important factor that causes brittle fracture is grain size. As grains get smaller in a material, the fracture becomes more brittle. As can be seen from Fig. 12(c and d), cavity is visible. As the Fe content reaches to 5 wt.% at highest growth velocity (978 μm/s) (Fig.12e and f), fracture morphologies show intergranular texture including cleavage planes (white arrows). It can be clearly seen that the long rod shape Fe-rich intermetallics interwoven in the α-Al matrix. These factors have signiicantly reduced the amount of elongation.
Hafiz and Kobayashi39 conducted a study on the
microstructure- fracture behavior relations in Al–Si casting alloys using tensile testing. In general, the voids were found to initiate at silicon particles. The individual voids then grew and coalesced, creating micro-cracks in the eutectic region. These microcracks linked up to form the main crack, resulting in the inal fracture. Horng et al.40 studied the fracture behavior
of A356 alloys with diferent iron contents. According to them, the cracks were found to initiate and grow along the eutectic Si and Fe-rich intermetallic phase particles.
Consequently, the microhardness and tensile strength of the alloys increase with increasing growth velocity and Fe content. Especially, the Al–1.9Mn–5Fe alloy would be expected to have the highest microhardness and tensile
Fig. 11 SEM fractographs showing tensile fracture surface of Al–1.9Mn–xFe alloys for lowest growth velocity (V=8.3 μm/s) (a, b) Al–1.9Mn–0.5Fe (c, d) Al–1.9Mn–1.5Fe (e, f) Al–1.9Mn–5Fe (CP: cleavage planes)
intermetallics were decreased and hard Al6FeMn rods well
reined. Therefore, homogeneous distribution of Al6FeMn rods
throughout the matrix (α-Al) formed along the interdendritic
region that improves the microhardness and tensile strength of the matrix.
4. Conclusions
Inluence of composition on the microstructure, mechanical and electrical properties of Al–26Cu–0.5Fe–xSi alloys has investigated in this research. The results are summarized as follows:
1. Eutectic spacings (λ) of Al–1.9Mn–xFe alloys
decrease with increasing growth velocity and Fe
content. The relationships between the λ, V and
Co were obtained by binary regression analysis
as follows, λ=kV-a (a=0.39, 0.33 and a.34),
λ=kCO-b(b=0.43, 0.35, 0.17 and 0.37),
2. The experimental results show that HV values of
studied alloys increase with increasing V and Fe
content.The establishment of the relationship between
HV, V and Co can be given as HV=kVc(c=0.4, 0.4
and 0.5), HV=kCd
O(d=0.23, 0.23, 0.24 and 0.25)
3. Also, by increasing V and Fe content, σu increase and
elongation decreases. It is found that σu increases
from 116, 146 and 154 MPa to 156, 180 and 192 MPa for each alloy composition, respectively. The
establishment of the relationships among σ, Vand
Co can be given as σu=kVe(e=0.6, 0.4 and 0.5),
σu=kC f
O(f=0.12, 0.12, 0.12 and 0.09).
4. As the V and Fe content increases, the fracture surfaces show more brittle features. Especially, the number density of Fe-containing intermetallics
(Al6FeMn) increases with Fe content, and therefore
Fig. 12 SEM fractographs showing tensile fracture surface of Al–1.9Mn–xFe alloys for biggest growth velocity (V=978 μm/s) (a, b) Al–1.9Mn–0.5Fe (c, d) Al–1.9Mn–1.5Fe (e, f) Al–1.9Mn–5Fe
lower the ductility. Thus, as iron level increases, porosity increases, and this defect also has an impact on ductility.
5. As can be seen from exponent values in the obtained experimental relationships, the efect of V and Fe content at a constant G is quite efective. Thus, V and Fe content play a vital role for a good combination of microstructure and mechanical properties.
5. Acknowledgements
This research was supported inancially by the Scientiic and Technical Research Council of Turkey (TUBİTAK) under contract no. 212T130. The authors are grateful to the Scientiic and Technical Research Council of Turkey (TUBİTAK) for their inancial supports.
6. References
1. Mondolfo LF. Manganese in aluminum alloys. Paris: The Manganese Centre; 1978.
2. Avner SH. Introduction to Physical Metallurgy. New York: McGraw-Hill; 1974. p. 481-489.
3. Polmear IJ. Light Alloys: Metallurgy of the Light Metals. Hoboken: Wiley; 1995.
4. Cahn RW, Haasen P, Kramer EJ, eds. Materials Science and Technology: A Comprehensive Treatment. Weinheim: Wiley-VCH; 1996. p. 242-244, 267-273.
5. Craig BD, Anderson BD, eds. Handbook of Corrosion Data. Materials Park: ASM International; 1995.
6. Denholm WT, Esdaile JD, Siviour NG, Wilson BW. The nature of the FeAl3liquid-(FeMn)Al6 reaction in the Al-Fe-Mn system.
Metallurgical and Materials Transactions A. 1987;18(3):393-397. 7. Shabestari SG. The efect Fe and Mn on formation of intermetallic
compounds in Al-Si alloys. Materials Science and Engineering
8. Hwang JY, Doty HW, Kaufman MJ. The efects of Mn additions on the microstructure and mechanical properties of Al–Si– Cu casting alloys. Materials Science and Engineering A. 2008;488(1-2):496-504.
9. Dinnis CM, Taylor JA, Dahle AK. Interactions between iron, manganese, and the Al-Si eutectic in hypoeutectic Al-Si alloys.
Metallurgical and Materials Transactions A. 2006;37(11):3283-3291.
10. Dutta B, Rettenmayr M. Efect of cooling rate on the solidiication behaviour of Al-Fe-Si alloys. Materials Science and Engineering
A. 2000;283(1-2):218-224.
11. Zhang YH, Liu YC, Han YJ, Wei C, Gao ZM. The role of cooling rate in the microstructure of Al-Fe-Si alloy with high Fe and Si contents. Journal of Alloys and Compounds. 2009;473(1-2):442-445.
12. Çadırlı E. Efect of solidiication parameters on mechanical properties of directionally solidiied Al-rich Al-Cu alloys. Metals and Materials International.2013;19(3):411-422.
13. Yılmaz E, Çadırlı E, Acer E, Gündüz M.Microstructural Evolution and Mechanical Properties In Directionally Solidiied Sn–10.2 Sb Peritectic Alloy at a Constant Temperature Gradient.
Materials Research. 2016;19(2):370-378.
14. Davis JR, ed. ASM Specialty Handbook: Aluminum and Aluminum
Alloys. Materials Park: ASM International; 1993.
15. Ourdjini A, Liu J, Elliott R. Eutectic spacing selection in the Al-Cu system. Materials Science and Technology. 1994;10(4):312-318. 16. Ganesan S, Chan CL, Poirier DR. Permeability for low parallel to primary dendrite arms. Materials Science and Engineering
A. 1992;151(1):97-105.
17. Bhat MS, Poirier DR, Heinrich JC. Permeability for cross low through columnar-dendritic alloys. Metallurgical and Materials Transactions B. 1995;26(5):1049-1056.
18. Kaya H, Çadırlı E, Böyük U, Maraşlı N. Variation of microindentation hardness with solidiication and microstructure parameters in the Al based alloys. Applied Surface Science. 2008;255(5 Pt 2):3071-3078.
19. De Wilde J, Froyen L, Rex S. Coupled two-phase [alpha(Al)+theta(Al2Cu)] planar growth and destabilisation
along the univariant eutectic reaction in Al-Cu-Ag alloys.
Scripta Materialia.2004;51(6):533-538.
20. Gündüz M, Kaya H, Çadırlı E, Özmen A. Interlake spacings and undercoolings in Al-Si irregular eutectic alloy. Materials
Science and Engineering: A. 2004;369(1-2):215-229. 21. Steinbach S, Ratke L. The inluence of luid low on the
microstructure of directionally solidiied AlSi-base alloys.
Metallurgical and Materials Transactions A. 2007;38:1388-1394. 22. Aker A, Engin S, Yılmazer I, Kaya H. Inluence of the growth
rate on physical properties in the aluminum-antimony eutectic alloy. International Journal of Materials Engineering and Technology. 2013;9(1):59-76.
23. Fan J, Li X, Su Y, Guo J, Fu H. The microstructure parameters and microhardness of directionally solidiied Ti–43Al–3Si alloy. Journal of Alloys and Compounds. 2010;506(2):593-599.
24. Çadırlı E, Yılmazer İ, Şahin M, Kaya H. Investigation of the Some Physical Properties of the Directionally Solidiied Al–Cu–Co Ternary Eutectic Alloy. Transactions of the Indian Institute of
Metals.2015;68(5):817-827.
25. Jackson KA, Hunt JD. Lamellar and rod eutectic growth. Transactions of the Metallurgical Society of AIME. 1966;236:1129-1142. 26. Shah KV, Goswami M, Deo MN, Sarkar A, Manikandan S,
Shrikhande VK, et al. Efect of B2O3 addition on microhardness
and structural features of 40Na2O–10BaO–xB2O3–(50–x)P2O5
glass system. Bulletin of Materials Science. 2006;29(1):43-48.
27. Wang X, Lu HM, Li XL, Li L, Zheng YF. Efect of cooling rate and composition on microstructures and properties of Zn-Mg alloys. Transactions of Nonferrous Metals Society of China. 2007;17:122-125.
28. Çadırlı E, Kaya H. The efect of composition on microhardness and determination of electrical and thermal properties in the Sn-Cu alloys. Journal of Materials Science: Materials in Electronics. 2011;22(9):1378-1386.
29. Novinrooz AJ, Seyedi H, Larijani MM. Microhardness study of Ti(C, N) ilms deposited on S-316 by the Hallow Cathode Discharge Gun. Journal of Achievements in Materials and Manufacturing Engineering. 2006;14(1-2):59-63.
30. Maruyama K, Suto K, Nishizawa J. Compositional Dependence of Hardness in ZnSe1-x Tex and BeyZn1-ySe1-xTex. Japanese Journal of Applied Physics. 2000;39(Pt 1 9A):5180-5183.
31. Goulart PR, Cruz KAS, Spinelli JE, Cheung N, Ferreira I, Garcia A. Cellular growth during transient directional solidiication of hypoeutectic Al-Fe alloys. Journal of Alloys and Compounds. 2009;470(1-2):589-599.
32. Mukai T, Suresh S, Kita K, Sasaki H, Kobayashi N, Higashi K, Inoue A. Nanostructured Al–Fe alloys produced by e-beam deposition: static and dynamic tensile properties. Acta Materialia. 2003;51(14):4197-4208.
33. Kaya H, Çadırlı E, Gündüz M, Ülgen A. Efect of the temperature
gradient, growth rate, and the interlake spacing on the microhardness in the directionally solidiied Al-Si eutectic alloy. Journal of Materials Engineering and Performance. 2003;12(5):544-551.
34. Guo JT, Xu CM, Du XH, Fu HZ. The efect of solidiication rate on microstructure and mechanical properties of an eutectic NiAl– Cr(Mo)–Hf alloy. Materials Letters.2004;58(26):3233-3236. 35. Lapin J, Marecek J. Efect of growth rate on microstructure and
mechanical properties of directionally solidiied multiphase intermetallic Ni–Al–Cr–Ta–Mo–Zr alloy. Intermetallics. 2006;14(10-11):1339-1344.
36. Lapin J, Ondrúš L, Nazmy M. Directional solidiication of intermetallic Ti–46Al–2W–0.5Si alloy in alumina moulds. Intermetallics. 2002;10(10):1019-1031.
38. Fan J, Li X, Su Y, Chen R, Gou J, Fu H. Dependency of microstructure parameters and microhardness on the temperature gradient for directionally solidiied Ti-49Al alloy. Materials
Chemistry and Physics.2011;130(3):1232-1238.
39. Haiz MF, Kobayashi T. A study on the microstructure–fracture behavior relations in Al–Si casting alloys. Scripta Metallurgica
et Materialia.1994;30(4):475-480.