AN EMPIRICAL EXAMINATION OF FIREARM USERS
IN BRASILIA, DF
Adolfo Sachsida* André V. Mollick†
Mario Jorge Cardoso de Mendonça‡
Resumo
Este artigo relaciona características individuais à probabilidade do in-divíduo possuir arma de fogo: a) dentro de casa; b) fora de casa; e c) dentro e fora de casa. Foram coletados dados de 2.045 individuos em Brasilia-DF no ano de 2002. O modelo multinomial logit trouxe vários novos resul-tados. Em primeiro lugar, o nível educacional de uma pessoa afeta ne-gativamente a probabilidade dela ter armas fora de casa, mas não afeta a probabilidade dela ter armas dentro de casa, o que contradiz alguns re-sultados para os Estados Unidos. Em segundo lugar, indivíduos que são donos de carros e têm casa própria possuem maior probabilidade de ter armas dentro de casa, o que pode indicar um desejo de proteger sua pro-priedade.
Palavras-chave:Brasil, crime, demanda por armas de fogo, propriedade
de armas de fogo, logit multinomial.
Abstract
This paper relates individuals’ characteristics to the probability of possessing firearms: a) inside the home; b) outside the home; and c) in-side and outin-side the home. Extending the literature on the demand for firearms whose focus is on the first trait, we collected survey data on 2,045 random individuals of Brasília, Brazil, in 2002. The multinominal logit model yields several new results. First, while we do find that a person’s educational level negatively affects the likelihood that an individual will use arms only outside his or her home, education does not affect the prob-ability of an individual possessing a gun only at home, which contrasts sharply with results for the U.S. Second, individuals who own cars and houses have a 2.8% greater probability of keeping guns at home, which may reflect a desire to protect property.
Keywords:Brazil, crime, demand for firearms, gun ownership,
multino-mial logit.
JEL classification:K42
*Catholic University of Brasilia (UCB) - Institute for Applied Economic Research, Department
of Economics, SGAN 916 Modulo B Sala A-115, 70790-160 Brasilia – DF, Brazil. Phone: +55 (61) 3315-5152. E-mail: [email protected]
†University of Texas - Pan American (UTPA),1201 W. University Drive, Edinburg, TX
78541-2999, Phone: (956) 316-7913. E-mail: [email protected]
‡IPEA
1
Introduction
The theoretical literature dealing with the penalties on crime started byBecker
(1968) and its extensions to other illegal activities byEhrlich(1973) has been expanding considerably recently. One particular branch is the empirical veri-fication of some of the hypotheses on the usage of guns and its effects on crime
statistics with new data sets and estimation methods. SeeGlaeser(1999) for a review, as well asGlaeser & Sacerdote(2000),Fajnzylber & Loayza(2002),
Mustard (2003), andArgys & Mocan (2003).Trumbull (1989) compares ag-gregate data with individual data in estimations of convictions. Most of this literature is concerned with firearms usage by the population and its effects
on the levels of criminality, as developed byLott(1998),Duggan(2001), and
Cook et al.(2001).
Among the drawbacks identified with the growing literature on guns and crime, one could include: i) data availability; ii) the possibility of reverse cau-sation running from crime to economic or social conditions; and iii) the omit-ted variables problem as the severe biases for U.S. county-based estimations reported byMustard(2003), who suggest that arrest rates are negatively cor-related with normally excluded variables, such as: conviction rates and time served (prison sentence).
Rather than estimating the effects of guns on crime, this paper is very
much related to the verification of the characteristics of the individuals that demand firearms. The standard reference is the study byGlaeser & Glendon
(1998), who used the National Opinion Research Center’s (NORC) General So-cial Survey (GSS) for the U.S. They justified the usage of their data set on the grounds that the 1972-1974 GSS provides the largest sample size and largest array of covariates with respect to gun ownership, surveying approximately 1,500 randomly selected people annually in U.S. areas.
The first motivation for this empirical study is gaining a better under-standing of the mechanisms behind the demand for firearms. We therefore believe that identifying the demand side of firearms is particularly helpful given the various problems referred to above on the effects of guns on crime.
Contrary toGlaeser & Glendon(1998), however, this research is focused on a country widely believed to have a higher incidence of crime than indus-trial countries (Brazil), whose lack of available data precludes estimation and more formal statistical analysis. Therefore, the first contribution of this study is to go a step further in the direction of overcoming the data paucity on gun ownership in less developed countries. The empirical methodology adopted herein is based on survey performed on more than 2,000 individuals selected randomly from the city of Brasilia, the capital of Brazil. In addition to a vast list of questions on gun ownership, the rich set of covariates allows us to test several empirical hypotheses.
Third, several prescriptions for public policy are provided. If the individ-ual’s determinants to use firearms inside and outside the home are distinct we can offer important suggestions for public policies. For example, if the
principal reason that the individual possesses a firearm is for the safety of his property, the increase of public safety (and not a law against the use of firearms) would be an effective measure to reduce the demand for weapons.
On the other hand, if the main reason that an individual uses a firearm outside his home is due to his violent behavior, a law restricting the use of firearms (and not a increase in public safety) would be an effective measure to reduce
the demand for firearms.
Our major results are as follows. First, while we do find that a person’s educational level negatively affects the likelihood that an individual will use
arms only outside his or her home, the educational level does not affect at all
the probability of an individual possessing a gun only in the home, which is in sharp contrast to results for the U.S. Second, individuals who own cars and houses have a 2.8% greater probability of keeping guns at home, which may reflect a desire to protect property. Third, when the parents of the individual possess firearms, the likelihood of the offspring possessing a gun inside the
home increases by 12.4% and the probability of keeping firearms inside and outside the home grows 1.7%. Fourth, we identify substantial peer effects in
the demand for firearms. Individuals who are part of a group that possesses firearms find their probability of having firearms inside the home increases by 2.9%. The similar marginal effect rises by 1.8% for possessing firearms
inside and outside the house. Fifth, institutions seem to be important (at the 10% significance level only): increases in the credibility of the legal system are able to produce a reduction of 1.6% in the probability of the individual possessing firearms inside his or her home. Several prescriptions for public policy are provided.
Section2contains a description of the database and some general informa-tion about Brasilia, the capital of Brazil. The econometric results are shown in Section3and Section4contains final remarks with policy implications.
2
Overview of Brasilia and the Database
The information contained herein was obtained from field research in Brasilia, the capital of Brazil and located in the Distrito Federal (D.F.) state, in Brazil’s Midwest region. According to census data provided by the Brazilian Institute of Geography and Statistics (IBGE), in the year of 2000 there were 169,799,170 inhabitants in Brazil, of which 2,051,146 of them lived in D.F. and 198,422 lived in the city of Brasília.
The Human Development Index (HDI), measured by the United Nations in the year of 2003, gives a rating of 0.936 to the city of Brasília, which is about the same rating obtained by Iceland and very much to the United States (0.939), but above rich countries as the Netherlands (0.935) and Japan (0.933). While the Distrito Federal received a lower rating (0.849), it is much higher than the Brazilian average (0.766).
Table 1: Distribution of Sampled Individuals
Possess Arms Inside Home
Yes No Total
Posses Arms Outside Home
Yes 114 38 152
No 152 1741 1893
Total 266 1779 2045
Source: The authors.
states. However, the per capita GDP in the Distrito Federal state is the highest per capita GDP in the country. As to basic education, 98.7 percent of children between 7 and 14 years old are currently attending school.
As far as the crime rate is concerned, the homicide rate was 27.5 homicides per 100,000 inhabitants in the D.F. for 2002, according to Brazil’s Ministry of Justice. This rate is much higher than both the United States (9 per 100,000 inhabitants) and the United Kingdom (4 per 100,000 inhabitants). However, the homicide rate in the Distrito Federal state remains below that of other Brazilian states, such as: São Paulo (32.4 per 100,000 inhabitants) and Rio de Janeiro (53.4 per 100,000 inhabitants). On crimes against property, 4,385 oc-currences per 100,000 inhabitants were reported in the D.F, which is higher than the state of São Paulo (2,708 occurrences per 100,000 inhabitants) and the satate of Rio de Janeiro (1,573 occurrences per 100,000 inhabitants). Ac-cording to the Ministry of Justice, public safety services in the D.F. are ranked among one of the best of the country. In the Distrito Federal, there are 108 in-dividuals per policeman (the lowest rate in the whole country). Adjusting the police force by state size results in a policeman for each 300 meters, Brazil’s lowest rate.
The preceding data and facts suggest Brasília is a relatively safe and edu-cated metropolitan area in a country that fares worse in homicide rates than the U.S. A total of 2,045 people were interviewed and provided complete an-swers to all 29 questions of the Survey. The data were obtained through survey techniques, via directin locointerviews. Table1contains the 29 questions, of which 26 are “Yes” or “No” questions. This research classifies the individual in one of four distinct groups: 1) possesses firearms inside the home only; 2) possesses firearms outside the home only; 3) possesses firearms both inside and outside the home and; 4) does not possess firearms. We then estimated each group of firearms users to specific individual and social characteristics, allowing for a rich set of covariates as inGlaeser & Glendon(1998).
Table1also shows how the observations of this research are distributed among the 4 groups mentioned above. In Table1we notice that of the 2,045 people interviewed, 1,741 (85.1%) do not keep firearms inside or outside their homes. In other words, only 304 (14.9%) interviewees possess firearms. Of the 304 individuals interviewed who possess firearms, 114 (37.5%) possess arms inside as well as outside their homes, while 152 (50%) possess arms inside their homes only and 38 (12.5%) of the individuals possess arms outside their homes only.
the fear of being assaulted, the fact that the individual is aggressive or not, or if he or she has had a good relationship with his/her parents, etc. The research also inquires about the lifestyle of the person instead of inquiring directly about his/her income. This was done to eliminate distortions be-cause many of the interviewees do not honestly speak about their personal income. Additionally, we can argue that the decision to possess a firearm may not be associated with the individual’s current income. A person could have acquired a gun when his/her income was different from their present income.
It seems to make more sense to associate the demand for weapons to a stock variable (if the individual owns a house, for instance) than to a flow variable (in the case of earnings or “salary”).
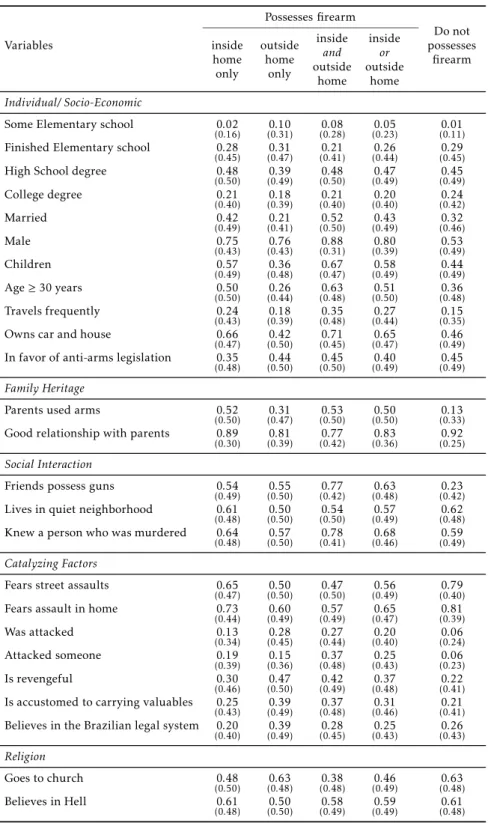
Table2presents the descriptive statistics of the variables. All the variables that appear in the table are dummy variables. In Table2we verify that of the individuals who do not possess firearms, 32% are married, 53% are men and 44% have children. As for those that possess firearms, 43% are married, 80% are men and 58% have children.
Some differences in Table 2are worth mentioning. For example, of the
individuals that possess firearms, 50% had parents who were also owners of weapons. For the individuals that do not possess firearms, this percentage falls to 13%. Additionally, of the people that possess firearms, 39% prac-tice some type of martial art. Among those individuals that do not possess firearms, only 11% practice martial arts. Finally, of the individuals who pos-sess arms 25% physically attacked another person within the last year. This percentage reduces to 6% among those who do not possess firearms.
The variables used in this study may be grouped for convenience. The first group refers to the socio-economic and individual characteristics of the interviewees. In this group information appears concerning education, sex, marital status, children, age and proxies which attempt to capture the income level of the individual. We also include variables that capture income, such as frequent travel or ownership of a car and house. The second group describes factors related to “family heritage”, a term that denotes factors that are associ-ated with the home where the individual was raised. For the variables of this group we present information about the relationship between the individual and his parents and if his parents possessed, firearms, or not.
The third group presents the variables that are linked to social interaction. The variables of this group exist to check if the group to which the person be-longs influences his/her behavior. These variables inform us if the individual lives in a quiet neighborhood, if his friends use guns and if he/she personally knew somebody who was murdered. The high average for this last variable, between 57% and 78% across columns (1) to (5), gives an idea about the pre-vailing level of violence in Brazilian society. Of the individuals that possess firearms, 68% personally knew someone who was murdered. Among those who do not possess arms, this percentage falls to 59%.
Although the variables mentioned above can be important to explain why the individual carries a handgun, it is possible to imagine other factors that could influence this phenomenon. In this way, one contribution of this paper is to verify if determined factors, sometimes mentioned in the literature or even through the press, affect the use of firearms. Here such variables are
Table 2: Descriptive Statistics of the Averages of Variables Variables Possesses firearm Do not possesses firearm inside home only outside home only inside and outside home inside or outside home Individual/ Socio-Economic
Some Elementary school 0.02
(0.16) (0.31)0.10 (0.28)0.08 (0.23)0.05 (0.11)0.01
Finished Elementary school 0.28
(0.45) (0.47)0.31 (0.41)0.21 (0.44)0.26 (0.45)0.29
High School degree 0.48
(0.50) (0.49)0.39 (0.50)0.48 (0.49)0.47 (0.49)0.45
College degree 0.21
(0.40) (0.39)0.18 (0.40)0.21 (0.40)0.20 (0.42)0.24
Married 0.42
(0.49) 0 .21 (0.41) 0 .52 (0.50) 0 .43 (0.49) 0 .32 (0.46) Male 0.75
(0.43) (0.43)0.76 (0.31)0.88 (0.39)0.80 (0.49)0.53
Children 0.57
(0.49) (0.48)0.36 (0.47)0.67 (0.49)0.58 (0.49)0.44
Age≥30 years 0.50
(0.50) 0 .26 (0.44) 0 .63 (0.48) 0 .51 (0.50) 0 .36 (0.48)
Travels frequently 0.24
(0.43) (0.39)0.18 (0.48)0.35 (0.44)0.27 (0.35)0.15
Owns car and house 0.66
(0.47) (0.50)0.42 (0.45)0.71 (0.47)0.65 (0.49)0.46
In favor of anti-arms legislation 0.35
(0.48) 0 .44 (0.50) 0 .45 (0.50) 0 .40 (0.49) 0 .45 (0.49) Family Heritage
Parents used arms 0.52
(0.50) (0.47)0.31 (0.50)0.53 (0.50)0.50 (0.33)0.13
Good relationship with parents 0.89
(0.30) (0.39)0.81 (0.42)0.77 (0.36)0.83 (0.25)0.92
Social Interaction
Friends possess guns 0.54
(0.49) (0.50)0.55 (0.42)0.77 (0.48)0.63 (0.42)0.23
Lives in quiet neighborhood 0.61
(0.48) (0.50)0.50 (0.50)0.54 (0.49)0.57 (0.48)0.62
Knew a person who was murdered 0.64
(0.48) (0.50)0.57 (0.41)0.78 (0.46)0.68 (0.49)0.59
Catalyzing Factors
Fears street assaults 0.65
(0.47) 0 .50 (0.50) 0 .47 (0.50) 0 .56 (0.49) 0 .79 (0.40)
Fears assault in home 0.73
(0.44) (0.49)0.60 (0.49)0.57 (0.47)0.65 (0.39)0.81
Was attacked 0.13
(0.34) (0.45)0.28 (0.44)0.27 (0.40)0.20 (0.24)0.06
Attacked someone 0.19
(0.39) (0.36)0.15 (0.48)0.37 (0.43)0.25 (0.23)0.06
Is revengeful 0.30
(0.46) (0.50)0.47 (0.49)0.42 (0.48)0.37 (0.41)0.22
Is accustomed to carrying valuables 0.25
(0.43) (0.49)0.39 (0.48)0.37 (0.46)0.31 (0.41)0.21
Believes in the Brazilian legal system 0.20
(0.40) (0.49)0.39 (0.45)0.28 (0.43)0.25 (0.43)0.26
Religion
Goes to church 0.48
(0.50) (0.48)0.63 (0.48)0.38 (0.49)0.46 (0.48)0.63
Believes in Hell 0.61
(0.48) (0.50)0.50 (0.49)0.58 (0.49)0.59 (0.48)0.61
Table 2: Descriptive Statistics of the Averages of Variables (continued)
Habits and Tastes
Arrives home late 0.51
(0.50) (0.48)0.65 (0.49)0.59 (0.49)0.56 (0.49)0.52
Goes to bars and nightclubs 0.32
(0.47) (0.50)0.47 (0.49)0.44 (0.48)0.39 (0.44)0.26
Uses drugs 0.07
(0.27) (0.31)0.10 (0.37)0.16 (0.31)0.11 (0.16)0.02
Practices self-defense 0.29
(0.45) (0.43)0.23 (0.49)0.57 (0.48)0.39 (0.31)0.11
Would buy a gun if assaulted 0.43
(0.49) (0.49)0.39 (0.48)0.62 (0.50)0.50 (0.31)0.11
Number of observations 152 38 114 304 1741 Notes: The total number of observations is 2,045. The values in parenthesis are the standard-deviations of the variables.
revengeful if he/she physically beat someone in the last 12 months; if he/she has the custom of transporting valuables (jewels, money, etc.); and if he/she is afraid of being assaulted.
Data referring to habits and preferences of the agents, such as the use of drugs, if the individual has a habit of arriving home late, or if he practices some kind of martial art are also represented. We also tried to verify if religion has any influence on the use of firearms. There is thus information about the individual having the habit of attending church and if he/she believes in hell. In our sample, the incidence of believing in the existence of hell runs from 2 to 3 times the faith respondents have in the Brazilian legal system.
3
Econometric Results
This section contains estimations of the econometric model separately for in-dividuals who possess a firearm: only at home; only outside home; and at home or outside. The multinomial logit model to each group of firearms users provide equations with sets of probabilities for the choices for a decision-maker with a vector of characteristics comprising individual, family, social interaction terms, catalyzing factors, religion, and habits and tastes.
This section provides estimation of an econometric model which supplies information about the determinants of an individual to possess firearms. Our dependent variable can be any of the four categories: (0) the individual does not possess firearms; (1) the individual posseses firearms only inside his/her residence; (2) the individual posseses firearms only outside his/her residence; and (3) the individual posseses firearms inside and outside his/her residence. In other words, our dependent variable can assume different discrete values
ranging from zero to three. In situations like these it is usual to approach the problem through a multinomial logit model as reviewed byGreene(2003).
the presence of firearms inside or/and outside home.
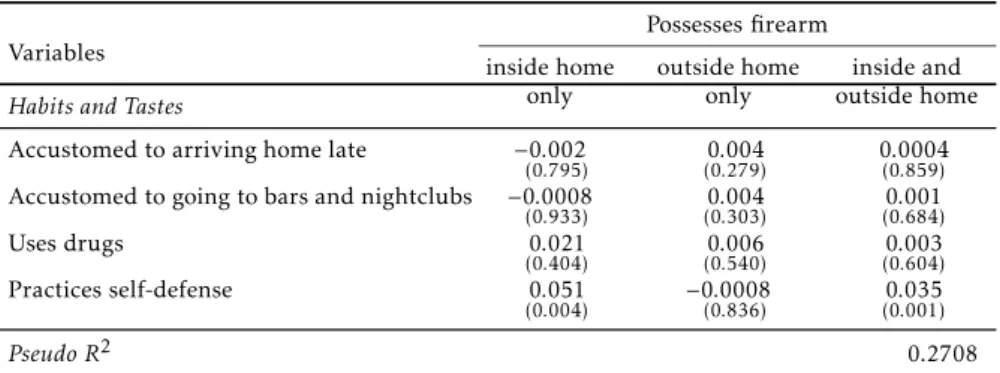
Table 3 displays the results of the estimation of the multinomial logit model. The endogenous variable, denoted ARM, assumes the following val-ues: 0 if the individual does not possess a firearm (this shall be the comparison group); 1 if the individual possesses a firearm only at home; 2 if the individual possesses a firearm only outside his home; and 3 if the individual possesses a firearm inside and outside his residence. To simplify the understanding of Table3, we will make a comparative analysis by groups of variables. We then note that the variables that make up the group “Socio-economic and Individ-ual” distinctly affect the probability of individuals possessing firearms.
The results suggest that a person’s educational level negatively affects the
likelihood that an individual will use firearms only outside his or her home (p-values of 0.030 for elementary, 0.070 for high-school, and 0.031 for col-lege degree education), but it seems to have little effect on the likelihood of
an individual possessing a gun inside and outside the home. Moreover, the educational level in no way affects the probability of an individual possessing
a gun only in the home. The latter is in sharp contrast toGlaeser & Glendon
(1998) who reported that U.S. gun-owners of guns or pistols are less likely to be either college graduates or high-school graduates. An interesting policy conclusion for the case of Brazil is that improvements in the educational level of the population would result in a reduction of the number of people who use firearms outside their homes, but would not alter the number of individuals who use guns inside their homes.
The fact that people own their own cars and homes increases the probabil-ity (0.028) they will keep firearms only inside their homes. This new result, under a stock measure of wealth, is consistent with people possessing firearms at home to protect their property. For the U.S.Glaeser & Glendon(1998) re-port statistically significant positive effects of income on owing guns (0.072)
and on owing pistols (0.027). Since they used data for possessing firearms only inside home, our 0.028 in the same category is remarkably close to their value. A few other studies report income coefficients, although in different
contexts.1
The effect one’s parent have on the probability of the individual possessing
a gun is statistically significant for firearms only inside houses and shows a weaker effect for owning firearms inside and outside home. More specifically,
a person who is a child of parents who had firearms at home increases one’s probability of possessing arms only at home by 12.4%, and his/her probability of possessing firearms inside and outside the home by 1.7%. Note also the effect that social interaction has on the probability of an individual possessing
a gun. The simple fact of being in the company of a group of friends who possess arms increases the probability of an individual possessing firearms only at home by 2.9% and of possessing arms inside and outside the home by 1.8%. Also, the probability of keeping firearms outside the home increases by 0.8%, an effect statistically significant only at the 11% level of statistical
significance.
1Using data from FBI, Census, and criminal justice sources on North Carolina counties in
Table 3: Results of the Multinomial Logit Model Variables Possesses firearm inside home only outside home only inside and outside home Individual/ Socio-Economic
Finished Elementary school −0.0101
(0.711)
−0.012
(0.030)
−0.012
(0.013)
High School degree 0.006
(0.822)
−0.016
(0.070)
−0.004
(0.439)
College degree −0.0104
(0.705)
−0.011
(0.031)
−0.007
(0.116)
Married 0.002
(0.802)
−0.002
(0.555) (0.118)0.006
Male 0.022
(0.023) (0.046)0.008 (0.001)0.013
Children 0.019
(0.112) (0.612)0.002 (0.093)0.006
Age≥30 years 0.012
(0.328)
−0.004
(0.331) (0.023)0.011
Travels frequently 0.017
(0.182)
−0.0005
(0.897) 0
.008
(0.075)
Owns car and house 0.028
(0.007)
−0.0003
(0.939) (0.121)0.005
In favor of anti-arms legislation −0.0201
(0.027) 0.0002(0.943)
−0.0001
(0.964)
Family Heritage
Parents use arms 0.124
(0.000) (0.416)0.004 (0.005)0.017
Good relationship with parents −0.004
(0.770) −0.004 (0.526) −0.011 (0.112) Social Interaction
Friends own arms 0.029
(0.012) 0
.008
(0.113) 0
.018
(0.002)
Lives in quiet neighborhood 0.001
(0.902)
−0.003
(0.443)
−0.002
(0.455)
Knew person who was murdered −0.002
(0.833)
−0.004
(0.301) (0.149)0.004
Catalyzing Factors
Fear of assault on street −0.016
(0.232)
−0.008
(0.199)
−0.004
(0.239)
Fear of assault at home −0.001
(0.882)
−0.004
(0.391)
−0.007
(0.123)
Was attacked 0.006
(0.678) 0.0201(0.102) (0.308)0.005
Attacked someone 0.024
(0.215)
−0.005
(0.086) 0.0105(0.130)
Is revengeful 0.0007
(0.943) (0.199)0.007 (0.470)0.002
Accustomed to transporting values −0.006
(0.531) 0
.005
(0.312) 0
.003
(0.369)
Believes in the Brazilian legal system −0.016
(0.083) (0.115)0.008 0.0002(0.930)
Religion
Attends church −0.014
(0.135) (0.121)0.005
−0.006
(0.046)
Believes in hell 0.012
(0.172)
−0.007
(0.083) 0.0006(0.800)
Table 3: Results of the Multinomial Logit Model (continued)
Variables
Possesses firearm
inside home only
outside home only
inside and outside home
Habits and Tastes
Accustomed to arriving home late −0.002
(0.795) (0.279)0.004 0.0004(0.859)
Accustomed to going to bars and nightclubs −0.0008
(0.933) (0.303)0.004 (0.684)0.001
Uses drugs 0.021
(0.404) (0.540)0.006 (0.604)0.003
Practices self-defense 0.051
(0.004)
−0.0008
(0.836) (0.001)0.035
PseudoR2 0.2708
Notes:The number of observations is 2,045. The coefficients represent the marginal effects and the values in parenthesis are the p-values of the variables.
Another important result from Table3deals with individual’s view of the Brazilian legal system. If an individual believes in the Brazilian legal system, his or her probability of possessing a gun inside the home is reduced by 1.6%, while this relationship is less clear for the remaining two groups of individu-als.
Another interesting result is about religious beliefs. For example, people who regularly attend church are 0.6% less prone to possess guns inside and outside the home. The fact that someone believes in the existence of hell reduces the probability that he or she will possess firearms outside the home by 0.7%. Finally, we should emphasize that people who practice some type of martial arts (self-defense) are 5.1% more likely to possess firearms only inside the home and 3.5% inside and outside home.
One important assumption about the multinomial logit regression is the independence of irrelevant alternatives (IIA). In the words of Aaron Gullick-son “it implies that the relative odds between any two outcomes are indepen-dent of the number and the nature of other outcomes being simultaneously considered”. That is, there is an implicit hypothesis that all the options are completely independent. This hypothesis implies that the exclusion of an op-tion will have a similar impact over each of the remaining categories. In our case, the IIA hypothesis implies that the choice to have firearm inside the resi-dence is a completely different (and not substitutional) choice to have firearm
outside the house2. Table4presents the results of the test proposed by Haus-man & McFadden(1984) for checking the IIA hypothesis. As one can see this test does not reject the IIA assumption.
Finally, the overall fitness of the model is fairly good with an R2 of 27%, which is in line with the 19.4% for own-gun regressions for the U.S. reported byGlaeser & Glendon(1998) and the 16.5% for own-pistol regressions in that same paper.
3.1 Robustness
To check the robustness of the results we compare them with another set of results from an alternative model. The main statistical problem associated with the choice of the Multinomial Logit model relies in the Independence of
Table 4: Hausman and McFadden Test for IIA Hypothesis
Omitted χ2 Dfy P-Value Evidence
Alternative 1 −144.45 58 0.97 For H0 Alternative 2 −1.887 58 0.95 For H0 Alternative 3 −24.539 58 0.9 For H0
Ho: Odds(Outcome-J vs Outcome-K) are independent of other alternatives.
Base Category: Alternative 0.
Table 5: Hausman and McFadden Test for IIA Hypothesis
Omitted χ2 Dfy PValuee Evidence
Alternative 1 −7.093 29 0.95 For H0 Alternative 2 −2.598 29 0.98 For H0
H0: Odds(Outcome-J vs Outcome-K) are independent of other alternatives.
Base Category: Alternative 3.
Irrelevant Alternatives (IIA). That is, if a new legislation make illegal to carry firearms, IIA implies that this new law should have the same impact over the probabilities of do not posses firearms both inside and outside home. Table 5 applies the Hausman and Fadden (1984) test to verify the ability of our model to validade the IIA. The econometric results suggest that we can not reject the IIA hypothesis, which validate our approach.
4
Final Remarks
Our surveys conducted of 2,045 random individuals in the city of Brasília in 2002 contain new results and provide important suggestions for economic policy. First, exploring a feature hitherto overlooked in the literature, we show that the determinants of the demand for firearm usage inside the home are remarkably different from those for firearms outside the home. While we do
find that a person’s educational level negatively affects the likelihood that an
individual will use firearms only outside his or her home (p-values of 0.030 for elementary, 0.070 for high-school, and 0.031 for college degree education), there is little effect on the likelihood of an individual possessing a gun inside
and outside the home. Moreover, the educational level does not affect at all
the probability of an individual possessing a gun only in the home, which is in sharp contrast toGlaeser & Glendon(1998) who reported that U.S. gun-owners of guns or pistols are less likely to be either college graduates or high-school graduates.
It follows from these findings that public policies which increase the ed-ucational level of the population will generate a reduction in the demand for firearms for use outside the home, but will have no effect on the demand for
arms for use inside the residence. So if the objective of the government is to reduce the quantity of firearms in circulation in the streets a more active educational policy could be appropriate.
rep-resented by the stock measure “owns car and house”) has on the probability of possessing a gun. Individuals who own cars and houses have a 2.8% greater probability of keeping guns at home. Maybe this is an indication that the dismal state of public safety implies that the individual demands firearms to protect his or her property. Improvements in public safety are likely to reduce the demand for arms for home usage.
Third, “family values” represented by parents using firearms do affect the
probability of the individual possessing a gun. When the parents of the indi-vidual possess firearms, the likelihood of the offspring possessing a gun inside
the home increases by 12.4% and the probability of keeping arms inside and outside the home grows 1.7%. Thus long term public policy for the reduction of firearms inside and outside the home should concentrate on the reduction of the demand for firearms in the present generation.
Fourth, we identified substantial peer effects in the demand for firearms.
Individuals who are part of a group that possesses firearms find their prob-ability of having firearms inside the home increases by 2.9%. The similar marginal effect rises by 1.8% for possessing firearms inside and outside the
house. This is significant for public polic- making. A law which hinders ac-cess of an individual to firearms will reduce the number of individuals who carry firearms, and less people with guns imply a smaller group effect. Thus
a law which restricts the sales of firearms will have two effects: a) the price of
possessing a gun will rise (supposing the benefit of possessing a gun stays con-stant) and will reduce the number of people with firearms; and b) the decrease in the number of armed people will, by the peer effect, reduce the demand for
firearms by other people. Similarly, any public policy that increases the num-ber of individuals with firearms will also produce the two effects mentioned
above, but with the opposite results.
Fifth, institutions seem to be important to some extent, which motivates the importance of strengthening the Brazilian legal system. The econometric results suggest that an increase in the credibility of the legal system is able to produce a reduction of 1.6% (at the 10% significance level only) in the probability of the individual possessing firearms inside his/her home.
Overall, it appears that the best way to reduce the number of firearms on the streets is through a more active educational policy which would increase the educational level of the population. A recent study for the U.S. byDuggan
(2001) reports that recent reductions in the fraction of households owning a gun can explain one-third of the differential decline in gun homicides
Bibliography
Argys, L. M. & Mocan, H. N. (2003), Who shall live and who shall die? an analysis of prisoners on death row in the united states, Technical report, World Bank National Bureau of Economic Research.
Becker, G. (1968), ‘Crime and punishment: An economic approach’,Journal of Political Economy76, 169–217.
Cook, P. J., Moore, M. H. & Braga, A. (2001),Crime: Public Policies For Crime Control, ICS Press.
Duggan, M. (2001), ‘More guns, more crime’, Journal of Political Economy 109, 1086–1114.
Ehrlich, I. (1973), ‘Participation in illegitimate activities: A theoretical and empirical investigation’,Journal of Political Economy81, 521–567.
Fajnzylber, P. & Loayza, D. L. A. (2002), ‘Inequality and violent crime’, Jour-nal of Law and Economics45, 1–40.
Glaeser, E. (1999), An overview of crime and punishment, Technical report, Harvard University.
Glaeser, E. & Glendon, S. (1998), ‘Who owns guns? criminals, victims, and the culture of violence’,American Economic Review88, 458–462.
Glaeser, E. & Sacerdote, B. (2000), The determinants of punishment: Deter-rence, incapacitation and vengeance, Technical report, Harvard Institute of Economic Research.
Greene, W. H. (2003),Econometric Analysis, Prentice-hall.
Hausman, J. & McFadden, D. (1984), ‘Specification tests for the multinomial logit model’,Econometrica52, 1219–1240.
Lott, J. R. (1998),More Guns, Less Crime: Understanding Crime and Gun Con-trol Laws, University of Chicago Press.
Mustard, D. B. (2003), ‘Reexamining criminal behavior: The importance of omitted variable bias’,Review of Economics and Statistics85, 205–211.
Appendix A
Questions in the survey
1. Gender: Male or Female.
2. Do you carry a gun when leaving home? Yes or No
3. Do you own a firearm at home? Yes or No
4. Marital Status: Single, Married, Divorced, or Widower.
5. Have you physically attacked someone in the last year? Yes or No
6. Have you ever been attacked, before reacting, in the last year? Yes or No
7. Do you have a good relationship with your parents? Yes or No
8. Are you afraid of being physically assaulted in the streets? Yes or No
9. Are you afraid of burglars breaking into your home? Yes or No
10. Do you live in a quiet neighborhood? Yes or No
11. Do your parents or siblings possess firearms? Yes or No
12. Do your friends possess firearms? Yes or No
13. Do you practice any martial arts? Yes or No
14. Do you travel at least once every 3 months? Yes or No
15. Do you have children? Yes or No
16. Do you use drugs? Yes or No
17. Do you go to church regularly? Yes or No
18. Suppose you do not own a gun and get assaulted. Would that lead you to own a gun? Yes or No
19. Have you met personally someone who has been assaulted? Yes or No
20. Would you support a bill that bans firearms for civilian people? Yes or No
21. Are you over 30 years old? Yes or No
22. Do you carry valuable objects? Yes or No
23. Do you often go out to bars, nightclubs or movie theaters? Yes or No
24. Do you believe in hell? Yes or No
25. Do you trust in the Brazilian legal system? Yes or No
26. Would you classify yourself as a revengeful person? Yes or No
27. Do you own a home and car? Yes or No
28. Do you often arrive back home after 10 pm? Yes or No