Engineering
www.abeq.org.br/bjchePrinted in BrazilVol. 34, No. 02, pp. 557 - 566, April - June, 2017 dx.doi.org/10.1590/0104-6632.20170342s20150766
BIODEGRADATION OF ACRYLIC PAINTS: PROCESS
MODELLING OF BIOCIDE EFFECT ON BIOMASS
GROWTH AT DIFFERENT TEMPERATURES
V. Piemonte
1, F. Francioni
1, M. Capocelli
1and M. Prisciandaro
2*1Faculty of Engineering, University Campus Bio-Medico of Rome, via Alvaro del Portillo 21, 00128 Rome, Italy.
2Department of Industrial and Information Engineering and of Economics, University of L’Aquila, viale Giovanni Gronchi 18, 67100 L’Aquila, Italy.
E-mail: [email protected]
(Submitted: November 27, 2015; Revised: February 28, 2016; Accepted: March 31, 2016)
Abstract – Acrylic paint, notwithstanding the attention paid during the production process, couldbe contaminated by bacteria. This is a consequence of microbiological residuals on the can, resulting in the alterationof paint characteristics. It is therefore necessary to provide an in-canpreservation of the paint by using a biocide.In this paper, the evolution of an in-can system, using a thermo-luid dynamic model is presented; as a biocide, 2-methyl-4-isothiazolin-3-one, commercially known as MIT,was considered. The model was implemented on gPROMSsoftware and it was possible to determine the inhibitory concentration of the biocideinorder to guarantee both the protection of the can and the protection of thecover phase. To develop the model, kinetic parameters have been found by itting available literature experimental data. As far as the thermodynamical parameters, theequilibrium between liquid and vapor phases was described bythe NRTLmodel (ASPEN Plus). The model has been validated through a comparison with experimental literature results using MIT alone and a mixture of biocides (MIT/BIT). The main results are that,at the maximum allowable concentration (100 ppm as imposed by law), the MIT biocide is able to protectthe paint for long periods, even when the temperature varies cyclically from 10 to 40°C.
Keywords: acrylic paints; biocide; MIT; microbiological contamination; modelling.
INTRODUCTION
To meet the growing demand for environmentally friendly products, the organic solvents used in the formulation of paints areincreasingly replaced by water-based systems. This leads, however, to amore pronounced problem of microbiological contamination. Typically, paints contain alarge number of components (thickening, binders and minor ingredients, such as coalescing agents or defoamers, anticorrosion agents)(Ulb rich and Kalendová,
2013; Del Amo et al., 2002) some of which are easily
attacked bymicroorganisms.A wide range of bacteria, molds and yeasts can infect and cause the deterioration of
water-based paints and they may originate from a number
of sources(Ravikumar et al., 2012; Bethencourt et al., 2003; Obidi et al., 2009). The principal contaminants of
paints are bacteria and rarely fungi, which use the organic compounds of the paint to grow and multiply (Olufemi et al., 2013). For sanitary reasons the bacterial proliferation
must be prevented by adding eicient preservatives in the paint itself. The use of efective broad-spectrum biocides,
compatibility, the toxicity of the biocidal product and its
inalcharacteristics. Microbial infections may occur during
the manufacturing stages of paint production and during the storage as packaged product (La Rosaet al., 2008).As a
matter of fact, when subject to diferent temperatures, the
in-canproduct could evaporate and then condense again under the cover of the can. Since biocides are not volatile substances, they are present in very small quantities in
the cover phase; the bacteria are thus free to proliferate. Therefore, paints require diferent biocides for their efective protection: a biocide to protect the paint inside
the can itself (in-can protection), and onefor the protection of the layer of paint when applied to surfaces (Contant et al., 2010).The presence of microorganisms in the layer of paint applied on the surface is not desirable since they cause discoloration of the paint, damaging it considerably. Microbial growth is common in outdoor environments under certain conditions of temperature and humidity. In indoor environments with high humidity the growth of fungimay occur (Kham and Karuppayil, 2012). The microorganisms cover the paint surface with a thin layer of cells. Moreover, the presence of microorganisms due to the increase of the porosity of the layer of paint, causes a decrease in its physical resistance and allows moisture to penetrate the treated surface, which in the case for example of a wood surface can cause serious corruption problems
(Unger et al., 2013; Goossens et al., 2003).
For all the above mentioned reasons, the presence of biocide in paint is therefore mandatory.
The inhibition of the growth of microorganisms by means of biocidal products has been explained as the result
of diferent actions implemented by the biocide, such as
the destruction of the cell membrane, the inhibition of metabolic reactions, the variation of intracellular pH and the accumulation of toxic anions. There are numerous methods described in the literature for the determinationof
a biocidal product eicacy, both for storage in-can as well
as if paint is applied on surfaces. The most used methods are the ASTM Standards (2012), particularly ASTM D2574-86(Test Methods for Resistance of Emulsion Paints in the container to attack by microorganisms), ASTM D 3273-86 (Test Method for Resistance to Growth of Mold on the surface of interior coatings in an environmental chamber), ASTM D 3456-86 (Practice for determining by
exterior exposure tests the susceptibility of paint ilms to
microbiological attack).
Heavy metals have been used for many years as biocidal compounds,but their use has been widely restricted in recent years, mostly because of new environmental decrees.The EuropeanUnion establishes some regulations
about the biocides to be commercialized in Europe; from
01/05/2015 all the substances must be adequatedto the new statement and the biocide concentration in products has been considerably reduced.
Among available molecules, typically used biocides
for in-can protection are:1,2-benzisothiazolin-3-one (BIT),
5-chloro-2-methyl-isothiazolin-3-one/2-methyl-isothiazolin-3-one (CMIT,MIT); formaldehyde donors. Biocides used for ilm protection are: zinc pyrithione,
Carbendazim, octylisothiazolin-3-one (OIT). All these
compounds are classiied as sensitizing substances and
there are restrictive concentration limitsto regulate their presence in paints and coatings, according to EUH208 valid from June 2015 (Chema, 2015).
In this paper, a MIT-basedbiocide (2-methyl-4-isothiazolin-3-one) has been chosen to simulate the biocide hindering of microorganism proliferation inside a paint can, based on a previous more basic model (Piemonte et al., 2016). In details, we model the evolution of an in-can system, evaluating the behavior of the bacteria in the presence of the biocide with the aim of determining the
efect of biocide on biomass growth as a function of time and as well as the efect of temperature on bacteria proliferation
inside the can. Unlike other available simulations, the present model allows one to consider the bacterial growth on the cover of the paint-can, underestimated in all the available experimental tests, focusing primarily on bacterial behavior in the bulk of the paint. The equilibrium between liquid and vapor phases is modeled by using the
NRTL model; a kinetic model is developed to describe the
biomass growth and substrate consumption. The model results are compared to available experimental data and it is used to predict the biomass and substrate evolution in the
paint at diferent temperatures.
MATHEMATICAL MODELLING
The system shown in Figure 1 has been considered for simulation. It consists of three phases: a liquid phase a, representing the bulk of the paint contained in the can, a vapor phase b and a liquid phase c derived from evaporation and subsequent condensation of the paint under the lid.
The paint composition considered is the following:
vinyl acetate (substrate 1 - S1): 6% weight; monopropylene glycol (substrate 2 - S2): 2 weight%; calcium carbonate: 6% weight; water (W): 85.99% weight;MIT (I): 0.01%
weight=100ppm. The contribution of pigments (calcium carbonate) to the calculation of the phase equilibrium was
neglected. Considering the speciic weight of paint equal
to1.66g/cm3, S10 = 99597.4 g/m3, S20 = 33200 g/m3, W0 =
1427000 g/m3, I0 = 165.9 g/m3.
The biomass consideredconsists of ive bacterial species in competition; in details, the strains
consideredare:Pseudomonas aeruginosa, Pseudomonas
luorescens, Enterobacter aeruginosa, Alcaligenes faecalis, Staphylococcus aureus.
It is then necessary to describe the bacterial growth in the two liquid phasesa and c, also takinginto accountthe liquid-vapor balance of paint, which determines a
Figure 1. Sketch of the simulated system: a) liquid paint
phase; b) air and vapor phase; c) condensed phase.
Consequently, the biocidewill have a diferent bactericidal
action, with varying temperature of the system and initial concentration of biocide present in the phase a.
The equilibrium between the three diferent phases
has been described by the thermodynamic model NRTL (Renon and Prausnitz, 1968). Model parameters have been derived from the database of Aspen Plus except for
those related to MIT, whose properties have been deined
by means of the predictive group contribution model UNIFAC (Pöllmann and Löbbecke, 1996). As a matter of
fact UNIFAC is an activity coeicient model, like NRTL
or UNIQUAC, but is basedon group contributions rather than molecular contributions and, with a limitednumber of group parameters and group-group interaction parameters,
it can predict activity coeicients (AspenTech, 2011).
All the functional groups of the component were given and,through the UNIFAC method, all MIT propertieshave
been estimated, including the binary interaction coeicients
of the various subsystems. Finally, in phase b the presence of airhas been assumed, which represents an incondensable for the phases a and c; no chemical reactions are considered
in the vapor-phase b and the temperature diference
between phases c and a is ΔT=5 °C.
To describe the system from a dynamic point of view a Monod diauxic growth model has been used. The model based equations for biomass growth are reported
below(Bailey and Ollis, 1986; Villadsen et al., 2011):
where X is the biomass concentration, ui and vi are cybernetic variables used to model the intracellular autoregulation devoted to the enzyme synthesis and cellular activity control, respectively. They can be calculated as:
where the speciic growths on substrates S1 and S2 are modeled by:
being:
where α and β are the synthesis and degradation key
enzyme constants (Kompala, 2013) and ki1 the substrate inhibition constant.
From Eqs. 6 and 7 it is evident that a substrate
inhibitory efect has been considered for the degradation
kinetics of substrate S1. This efect has not been considered
for substrate S2.
��
��
=
�
1�
1+
�
2�
2�
(1)�
1=
�
1�
1+
�
2�
2=
�
2�
1+
�
2�
1=
�
1��� �
1,
�
2�
2=
��� �
�
2 1,
�
2(2)
(3)
(4)
(5)
�
1=
�
���1�
1�
1�
���1�
�1+
�
1+
�
12�
�1�
2=
�
���2�
2�
2�
���2�
�2+
�
2(6)
(7)
�
���1=
�
1
µ
���1+�1�
���2=
�
2
µ
���2+�2(8)
In order to take into account the biocide efect on biomass growth, Eq. 1 can be modiied as follow:
where I is the biocide concentration and Kei is the biomass lethality constant.
Then, the mass balance equations for enzymes, substrates and biocide can be written as:
where Yxs1 and Yxs2 are the yield growth factors.
First of all, the values of the kinetic parameters were
evaluated through a it of literature experimental data
ofeach substrate.In details, for substrate S1 it has been considered that:
while for substrate S2:
Figures 2a-b and 3a-b show the best it between
the model and experiments for substrate S1(data fromKasperczyk et al., 2007) and S2 (data fromToscano et al., 2009), respectively, while Table 1 reports the values of the resultant estimated kinetic parameters.
In details, for substrate S1 (vinyl acetate), the
experiments used to it the kinetic parameters are those
by Kasperczyk and coworkers (2007), in which the
Pseudomonas luorescens strain utilizes vinyl acetate. The experiments were performed in a batch reactor – volume about 2 L at constant optimal conditions for
Pseudomonas luorescens (temperature 30°C, pH = 7 and aeration of 4 to 7 mg dm-3 of dissolved oxygen in the
solution). The kinetics of vinyl acetate biodegradation were considered for the various initial concentrations of the substrate, from S0= 32 g dm-3 to 400 g dm-3.
As for substrate S2 (monopropylene glycol), the
experiments used to it the kinetic parameters are those
by Toscano and coworkers (2009), who worked in aerobic
conditions at T=30°C and T=4°C, by using diferent species
belonging to Pseudomonas strain to degrade propylene glycol.
As for the model constants α, β and Kei their values have been taken from the work by Kompala et al. (2013).
The equations of the kinetic model are used for both liquid phases a and c; their composition is determined by
thermodynamic equilibrium calculated with the NRTL model. As regards the vapor-phase b, with no chemical reaction, this phase is responsible only for the partitioning
of components between the two liquid phases. The diferent
tendency of substrates and biocide to go into the vapour
phase essentially determines the diference in composition
of the two liquid phases a and c. Finally, the temperature of phase c was assumed slightly lower than that of the phase
a (ΔT=5 °C), taking into account the almost direct contact
with the external environment and the small volume of the same phase c.
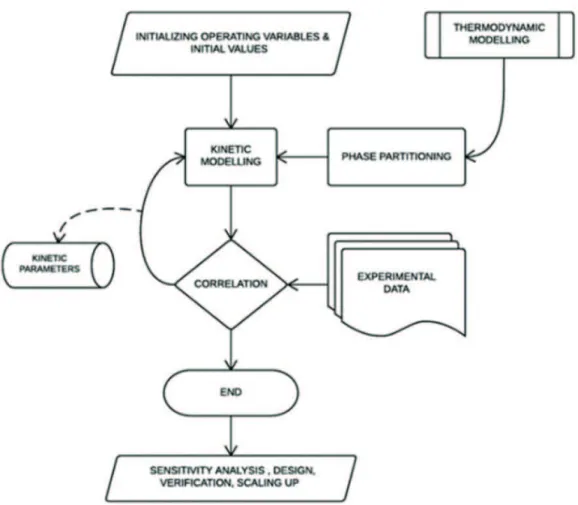
The modelling criteria implemented are summarized
��
��
=
�
1�
1+
�
2�
2� − �
����
��
1��
=
�
1�
1�
1�
�1+
�
1− ��
1−
��
��
�
1�
��
2��
=
�
2�
2�
2�
�2+
�
2− ��
2−
��
��
�
2�
��
1��
=
−
�
1�
1�
��1�
��
2��
=
−
�
2�
2�
��2�
��
��
=
�
(10) (11) (12) (13) (14) (15)��
��
=
�
���1�
1�
�1+
�
1+
�
12�
�1�
��
1��
=
−
�
���1�
1�
�1+
�
1+
�
12�
�1�
�
��1��
��
=
�
���2�
2�
�2+
�
2�
��
2��
=
−
�
���2�
2�
�2+
�
2�
�
��2 (16) (17) (18) (19)Figure 2. Kinetic parameter estimation for substrate S1 – Eqs
(16-17). Line: model equations; symbols: experimental results
in Figure 4. The thermodynamic model allows one to account for the phase partitioning. The kinetic modelling needs the evaluation (or experimental estimation) of some parameters.
Once the kinetic parameters have been estimated, the model is implemented to simulate the system of Figure 1, reproducing the experimental points (symbols) derived from literature (Urška, 2011) that used a mixture MIT/
BIT.To it experimental data relative to the mixture MIT/
BIT, the model, which considers only one biocide (MIT), was forced by increasing the value of the biomass lethality constant (see eq.10) by several orders of magnitude.
RESULTS
The model described above was validated through a comparison with available experimental results and then
used to predict the behavior of biomass and substrate as a function of time. Figures 5 and 6 show the behavior of biomass X in phase a as a function of time with MIT as biocide (upper orange curve) and a mixture MIT/BIT (bluelower curve). The experimental points (symbols) derived from the literature(Urška, 2001) refer to a mixture MIT/BIT. The experimental conditions are: biocide initial concentration I0=1.78g/m3 and inoculum concentration
Xa0= 1.46 g/m3 for Figure 5; I0=199 g/m3 and inoculum
concentration Xa0= 1.62 g/m3 for Figure 6.
As can be seen, the model its very well the experimental
condition for the mixtures MIT/BIT, while if the model considers the only MIT, it fails to describe the real system behavior.
Once tested the model reliability, a sensitivity analysis was carried out, structured into three groups of simulation runs.
A irst group of simulations was intended to study the efect of biocide (only MIT) on the concentration proiles
of biomass (X) and substrates (S1, S2) in the two phases
a and c, at the ixed temperature equal to 35°C, and an
initial concentration of biocide in phase a, I0
a=165.9g/m
3,
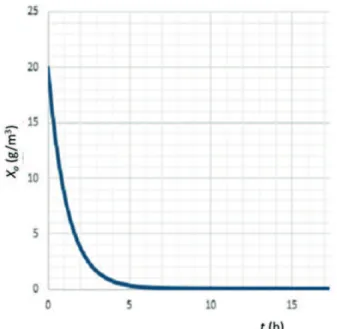
corresponding to 100 ppm which is the maximum allowed by the legal limits (Chema, 2015).Figure 7 shows the
biomass proile in phasea(Xa) as a function of time: as can be seen, the biomass concentration decreases with time due to the presence of biocide, which at the tested concentration
is suicient to kill all microorganisms in about 15 hours.
Figure 8 a-b shows the substrate consumption (S1a – see
Fig.8a; S2a – see Fig. 8b) always in phasea.
Figure 9 shows the bacterial concentration in phasec(Xc), which has an initial lag phase, due to the acclimatization of
bacteria; as a result, there is a phase of growth in which
the substrate S1 is consumed (see Fig. 10a) and, once exhausted (after 250 hours, about ten days), the biomass starts to grow degrading S2 (Fig. 10b). The trend of the biomass in phasec shows the typical trend of a diauxic growth, previously described: when both substrates are consumed, the biomass slowly begins to decrease due to the biocidebut this occurs for very long times (about 1600 h), not shown here.
A second group of simulations was intended to
study the efect of temperature on the distribution of
biocide (only MIT) and biomass in the two phases, with the temperature ranging in the interval 20-40°C, while keeping constant the biocide concentration (I0
a=165.9g/
m3). With varying temperature in the interval 20-40°C, the
behavior of Xa with time (not shown here) does not change
signiicantly, even if the two substrate concentrations in
phase a decrease with increasing temperature, due to a higher evaporation (see Fig 11a-b). However, the biocide concentration is high enough at all the tested temperatures to exert its antimicrobial action (see Fig. 12).
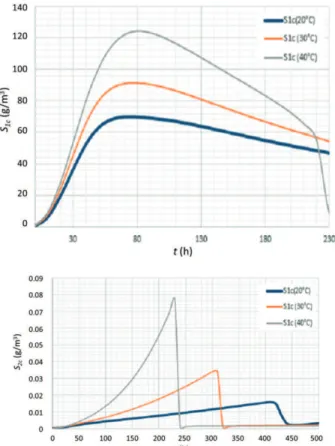
On the contrary, the concentration of biomass in phase
c increases with temperature: at higher temperatures, the substrate amount that passes in phase c grows, and so
Figures 3. Kinetic parameter estimation for substrate S2 –
Eqs (18-19). Line: model equations; symbols: experimental
results by Toscano et al. (2009).
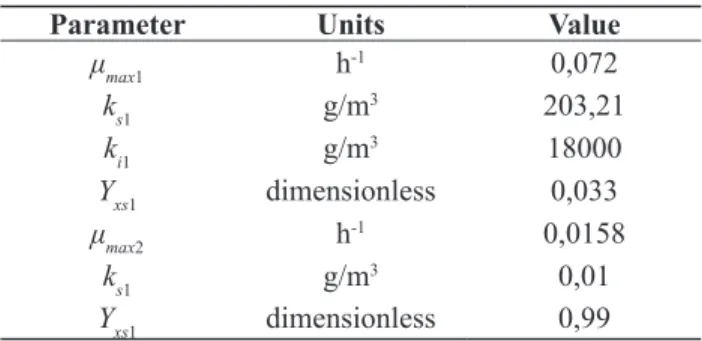
Table 1. Kinetic parameters obtained from itting.
Parameter Units Value
μmax1 h-1 0,072
ks1 g/m3 203,21
ki1 g/m3 18000
Yxs1 dimensionless 0,033
μmax2 h-1 0,0158
ks1 g/m3 0,01
Figure 4. Logical scheme of the procedure implemented for simulating the system.
Figure 5. Biomass Xa as a function of time; comparison between model and experimental results for MIT biocide (orange line)
and MIT/BIT biocide (blue line); symbols: experimental results (Urška, 2011); I0=1.78 g/m3 and X
a
0= 1,46 g/m3
Figure 6. Biomass Xa a s a function of time; comparison between model and experimental results for MIT biocide (orange line)
and MIT/BIT biocide (blue line); symbols: experimental results (Urška, 2011); I0=199 g/m3 and X
a
Figure 8. Substrate concentration in phase a as a function
of time; T=35°C, I0
a=165,9g/m 3. a):S1
a, b):S2a
Figure 7. Biomass proile inphase a (Xa) as a function of
time; T=35°C, I0
a=165,9g/m 3
Figure 9. Biomass proile in phase c (Xc) as a function of
time; T=35°C, I0
a=165,9g/m 3
Figure 10. Substrate consumption in phase c as a function
of time; T=35°C, I0
a=165,9g/m 3. a):S1
Figure 11. Substrate concentration inphase a as a function
of time at the temperatures T=20, 30 40°C; I0
a=165,9g/m 3.
a):S1a, b):S2a
Figure 12. Biocide concentration in phase a as a function
of time at the temperatures T=20, 30 40°C; I0
a=165,9g/m 3.
the growth of biomass.Figure 13a-b shows the substrate concentration (S1c – see Fig.13a; S2c – see Fig. 13b) in phasec at diferent temperatures, showing a faster
consumption rate at higher temperatures.
A third simulation was intended to determine biomass
and substrate proiles with a cyclic sinusoidal temperature proile, with a maximum of 40°C and a minimum of
10°C, simulating the exposure of the paint can to night and day temperatures. The most interesting result is that
shown in Figure 14, which shows the proile of biomass
concentration in phase c.
As can be seen, the biomass Xcin phase c has a maximum concentration of 1037 g/m3 (equal to 1.09x10⁹ cfu/mL).
The upper limit for the concentration ofbacteria is 3.4x10¹⁰
Figure 14. Biomass proile in phase c (Xc) as a function of time for the sinusoidal temperature proile on Figure 13,
I0a=165,9g/m3
Figure 13a-b. Substrate consumption inphase c as a
function of time at the temperatures T=20, 30 40°C;
I0
a=165,9g/m 3. a):S1
cfu/mL, Therefore, after 1600h (approximately two and a half months), there is a possible critical situation for the system,in which it is likely to have the presence of bacteria in phase c under the lid; however, this maximum bacterial
concentration is not achieved with the tested biocide, that appears to be able to provide protection for both the liquid phase and the can. It is to be pointed out also that the considerations are conservative, since in reality the biocide is typically a mixture CMIT/MIT, or MIT/BIT, while the model take into account onlyMIT.
CONCLUSIONS
In this paper, a model describing the efect of a
biocide (MIT) on a water-based paint is presented. The initial biocidal concentration considered in this study is themaximum allowed by the limits of the law, that is, 165.9 g/m3= 100 ppm.The main result obtained is that
the concentration of bacteria in the paint, using a suitable biocide concentration within the limits of the law, decreases with time. This indicates that the chosenbiocideis suitable for the protection of paint for long periods. Moreover, the concentration of bacteria under the cover of the can, in the case of possible evaporation of the product and successive recondensation when subjected to changes in temperatureof the external environment, shows a maximum after about two months anda half. This period is therefore to be considered critical for the possibleformation of bacteria. However, the maximum bacterial concentration achieved at that time in the presence of MIT is always below the allowed limit, so the biocide appears to be able to provide protection for both the liquid phasesaand c.
It is worth noting that the present modelallowsconsidering the bacterial growth on the coverof the paint can, often underestimated in experimental tests, which focus attention primarily onbacterial behavior only in the bulk of the paint.
Future work will be aimed at verifying the efect of other
process parameters, such as initial biocide concentration,
and to test the eicacy of diferent biocides ora mixture of
them.
REFERENCES
AspenTech - Aspen Physical Property, System Physical Property Methods (2011) Version No: V7.3http:// classes.engr.oregonstate.edu/cbee/spring2014/ che432/Aspen%20Engineering%20V7_3/Aspen%20 Properties/AspenPhysPropMethodsV7_3-Ref.pdf ASTM Standard test method for resistance of emulsion
paints in the container to attack by microorganisms. ASTM International (2012).
Bailey J.E. and D.F. Ollis. Biochemical Engineering Fundamentals. Mc-Graw-Hill (1986).
Bethencourt M, BotanaF.J, Cano M.J, Osuna R.M, Marcos M Degradation mechanism of an acrylic water-based paint applied to steelsProgress in Organic Coatings, 47, 164–168 (2003).
ChemaP., 2015 Information for avoiding of EUH 208 in Paints & Coatings. www.chemap.cz/wp-content/ uploads/Information_for_avoiding_of_EUH208_in_ Paints.pdf.
ContantS., G.J: Caritá, P.F.M.P.B. Machado, L.M.F. Lona.
Evaluation of the efect of dry-ilm biocides on paint ilm preservation using neural networksBraz. J. Chem. Eng.,27,643–651 (2010).
Del Amo, B., Romagnoli, R., Deyá, C., and González, J. A. High performance water-based paints with non-toxic anticorrosive pigments. Progress in Organic Coatings, 45, 389-397 (2002).
Goossens, E. L. J., van der Zanden, A. J. J., Wijen, H. L. M., and van der Spoel, W. H. The measurement of the
difusion coeicient of water in paints and polymers
from their swelling by using an interferometric technique. Progress in Organic Coatings, 48, 112-117 (2003).
KarsaD.R., D. Ashworth. Industrial biocides selection and application, R. S. C.Cambridge CB4 OWF, UK, 2002. Kasperczyk D., G. Bartelmus, A. Gąszczak.Clean
processes – Biodegradation kinetics andmathematical modelling of microbial removal of vinylacetate from dilute gaseous waste streamsChemEng Trans., 11:665– 670 (2007).
Kham A.A.H., S.M. Karuppayil SM. Fungal pollution of indoor environments and its management. Saudi J. Biol. Sci.19, 405–426 (2012).
Kompala D.S.. Bioprocess Engineering: Fundamentals and Applications. CRC Press(2013).
La Rosa F.R., E.C. Giese, R.F.H. Dekker, J. S. Pelayo, A. M. Barbosa. Microbiological contamination of water-basd paints from an industry in the state of Paraná, Brazil.
Ciências Exatas Ciências Exatas e Tecnológicase da Terra, Londrina. 29, 85-92 (2008).
Obidi O.F., O.O. Aboaba, M.S. Makanjuola, S.C. Nwachukwu. Microbial evaluation and deterioration of paints and paint-products. J Environ Biol., 30, 835-840 (2009).
Olufemi, O.L., M.O. Kolawole, A.S. Joshua. Isolation and Characterization of Fungi Associated with in-Can Degradation of PaintJ Environ. Earth Sci., 3, 142-145 (2013).
Pöllmann P. and M. Löbbecke. Gas Separation &
Puriication, 10,177–180 (1996).
Ravikumar, H.R., Shwetha S. Rao S.S., C.S.B KarigarC.S.B. Biodegradation of Paints: a Current StatusIndian J. Sci. Tech., 5, 1977-1087 (2012).
Renon H. and J.M. Prausnitz. Local composition in thermodynamic excessfunctions for liquid mixtures.
AICHE Journal,14, 135-144 (1968).
Toscano G., L. Cavalca; M. Letizia Colarieti; R. Scelza; R. Scotti; M. Rao; V. Andreoni; S. Ciccazzo; G. Greco
Aerobic biodegradation of propylene glycol by soil bacteria.Biodegradation 24, 603-613 (2013).
Ulbrich M., Kalendová A. Properties of organic coatings with nonisometric ferrite particles Physics Procedia 44, 247 – 255 (2013).
UngerA., A. Schniewind, W. Unger. Conservation of Wood Artifacts: A Handbook. Springer Science & Business Media (2013).
UrškaT.. Isolation of microorganisms from water-based
paint manufacturing plant and analysis of eiciency
of biocides. Graduation thesis. Department of Food Science and Technology, University of Ljubljana (2001).